C
ase
s
tudy
: On-Farm Evaluation
of Liquid Dairy Manure
Application Methods to Reduce
Ammonia Losses
A. B. Leytem,*1 D. L. Bjorneberg,* R. E. Sheffield,† and M. E. de Haro Marti‡ *Northwest Irrigation and Soils Research Laboratory, USDA, ARS, Kimberly, ID 83341;
†Department of Biological and Agricultural Engineering, Louisiana State University AgCenter, Baton Rouge 70803; and ‡Gooding Extension Office, Cooperative Extension System, University of Idaho, Gooding 83330
ABSTRACT
The volatilization of NH3 from land-applied manure is not only a loss of valuable N, but also an air quality concern because NH3 plays a role in the formation of airborne particulate matter, which can be a health hazard. The rela-tive differences in potential NH3 losses from land application of liquid dairy manure were determined via 3 methods: surface application, Aerway incorpora-tion (shallow incorporaincorpora-tion with a rolling tine aerator), and subsurface injection. Liquid manure was applied at a rate of 190 m3/ha on 4 farms with average N
and P application rates ranging from 28 to 130 kg N/ha and 6 to 36 kg P/ha, respectively. Average NH3 concentrations were measured with passive samplers for 3 d after manure application and ranged from 0.03 to 0.21 mg NH3-N/m3. There
were main effects of sampler height, day, and application method. The great-est NH3 concentrations occurred during the first 48 h after manure application. Concentrations of NH3 measured at 1
m (averaged over 48 h) indicated that surface and Aerway applications had the greatest concentrations (0.16 and 0.17 mg NH3-N/m3, respectively) whereas
subsurface injection of manure resulted in a 67% decrease in NH3 concentration, which was similar to the control plots (0.06 and 0.04 mg NH3-N/m3,
respec-tively). Subsurface injection was the best method of liquid manure application for minimizing NH3 losses.
Key words: ammonia, dairy ma-nure, Aerway, soil injection, best management practice
INTRODUCTION
The state of Idaho has recently experienced rapid growth of the dairy industry. The number of milk cows has increased by approximately 88% in the past decade, with a 122% increase in milk production (National Agricultural Statistics Service, 2007). Idaho is the second largest milk producer among the 12 western states and has become the fourth largest milk-producing state (National Agri-cultural Statistics Service, 2007). In 2006, there were 477,193 milking cows
in Idaho, with 71% of these being located in the Magic Valley region of southern Idaho (United Dairymen of Idaho, 2006).
The concentration of dairy produc-tion in the Magic Valley has led to increased land application of manure from these operations within the val-ley. One impact of land application
of these manures is the loss of NH3
because of volatilization, which is a concern from an air quality perspec-tive because NH3 plays a role in the formation of airborne particulate matter of less than 2.5 μm, which can be a health hazard (McCubbin et al., 2002; Erisman and Schaap, 2004). In addition, subsequent deposition
of NH3 can lead to damaged
vegeta-tion (Fangmeier et al., 1994), reduced biodiversity of natural ecosystems (Sutton et al., 1993), and the nitri-fication of water bodies (Hutchinson and Viets, 1969).
Concern over the impacts on air quality of large-scale dairy operations has led to the development of a set of rules for the control of NH3 from dairy farms, which were developed by the Idaho State Department of Agriculture, Idaho Department of
En-1 Corresponding author: april.leytem@ars.
vironmental Quality, the University of Idaho, dairy farm industry representa-tives, and environmental organization representatives. The rules require dairy farms exceeding specified animal unit thresholds to implement industry best management practices
(BMP) to control NH3 emissions
through a permit by rule. A permit by rule is a simplified and expedited process whereby a facility that emits air pollutants may register with Idaho Department of Environmental Qual-ity, and the permit conditions are addressed in the rule rather than a site-specific permit.
The permit by rule applies to dairy farms with a capacity to produce 100
or more tons of NH3 emissions per
year. The capacity to produce this
NH3 load is based on the number of
animal units or mature cows and the type of manure collection system, and ranges from 2,293 to 7,089 animal units. The rules prescribe various
BMP to control NH3 emissions
rang-ing from installrang-ing certain types of waste storage and treatment systems to implementing composting practices and exporting manure. Because land application of manure is also a source
of NH3 emissions, BMP such as
injec-tion of lagoon slurry and incorpora-tion of solid manure are considered effective in reducing NH3 losses from the operations, although there has been no validation or quantification of these reductions.
Brunke et al. (1988) reported that
NH3 flux from surface-applied manure
declined rapidly over the period of 10
h and that incorporation of manure
led to an 85 to 90% decrease in NH3
losses. Sullivan et al. (2003) showed that NH3 losses after swine effluent application to bermudagrass pasture decreased steadily over a 5-d period, with 60% of the total NH3 volatiliza-tion taking place within 4 d of appli-cation. Morken and Sakshaug (1998)
reported a 62% decrease in NH3 losses
when manure slurry was directly injected into the ground vs. by surface broadcast application, and that the majority of losses occurred over the first 24-h period.
To evaluate the effectiveness of BMP for land application of liquid
dairy manure, NH3 concentrations
from test plots were measured using 3 different application methods, sur-face broadcast, Aerway incorporation (shallow incorporation with a rolling tine aerator), and subsurface injec-tion, to determine relative differences in potential NH3 losses from these application methods.
MATERIALS AND METHODS
Field Trials
The on-farm trials were conducted at 4 dairy farms located in southern Idaho ranging in size from approxi-mately 200 to 10,000 milking cows. Each farm used a pond to capture runoff water from the open lots as well as wash water from the milking parlors. The pond was used as the source of liquid manure at each of the sites. The treatments at all sites
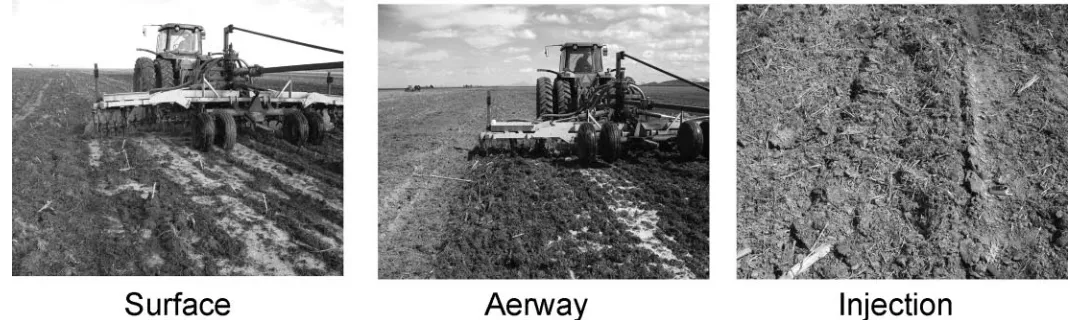
comprised 3 manure application meth-ods (Figure 1): surface broadcast, incorporation using an Aerway system (Aerway SSD, Holland Equipment Ltd., Norwich, Ontario, Canada), and subsurface injection (Balzer Inc., Mountain Lake, MN). At each of the farms, 3 plots of approximately 120
m2 were arranged in a north-to-south
orientation with approximately 50 m between plots to avoid cross-contam-ination between treatments, because the prevailing winds are normally from the west. The previous crops at 3 of the sites were corn, with one site having barley as the previous crop; 2 of the sites had been disked after harvest and the other 2 were left as corn stubble fields (Table 1).
Manure lagoons were agitated be-fore and during application. Manure was pumped from the lagoon directly to the application equipment. The 3 treatments were applied sequentially during the same day. Subsurface injec-tion placed manure behind the shank in a band approximately 30 cm deep. Aerway application incorporated ma-nure in approximately the top 10 cm of soil with a rolling tine aerator. The Aerway implement was used to apply manure for the surface treatment with the tines in a raised position to avoid disturbing the soil surface.
Within each plot, 3 towers were placed in line perpendicular to the prevailing wind direction and spaced approximately 15 m apart, with the middle tower at the center of the plot. Passive NH3 samplers (Ogawa & Co. USA Inc., Pompano Beach, FL) were
installed on each tower at a height of
1, 2, and 4 m to determine the NH3
concentration at each location. Am-monia samplers were changed approx-imately every 24 h over a 3-d period after manure application. Background
concentrations of NH3 entering the
sites were determined by placing 3 towers at an upwind location of the treatment plots following the same procedure described previously. Details regarding the design and
calculation of NH3 concentrations can
be found in Roadman et al. (2003). Concentrations from passive samplers are time-average concentrations for the amount of time the sampler was exposed to the air and were calcu-lated with the following equation:
mg NH3-N/m3 = [NH
3-N (mg/L)/
min deployed]/(31.1 cm3/min) ×
1,000,000, where NH3-N (mg/L) is the
concentration of extracted NH3-N and
31.1 cm3/min is a constant used to
calculate diffusion to the trap (Road-man et al., 2003).
A meteorological station was lo-cated adjacent to the application sites and recorded air temperature, soil
temperature, wind speed, solar radia-tion, and relative humidity during the experimental period. Measurements for wind speed, air temperature, and humidity were made at 2 m, and soil temperature was measured at 5 cm below the soil surface. All meteoro-logical instruments were interfaced to a 21X Micrologger (Campbell Scien-tific Inc., Logan, UT), which recorded data in 10-min increments. Ambient weather data at each farm over the
experimental period are shown in Table 2.
NH
3-N Sampler Preparation
and Analysis
The disassembled components of the passive samplers were thoroughly cleaned before each use (to avoid con-tamination and carryover) by rinsing with deionized water, soaking in a 1
M HCl bath, rinsing again with
deion-ized water, and then air-drying in a
Table 1. Manure content and application rates of N and P at the 4 dairy farms and field conditions present at the time of manure application
Treatment
Manure nutrient concentration,1 mg/kg Manure application rate,1 kg/ha
Field condition TKN P TKN P
Farm 1 Corn, disked after harvest, manure
applied
Injection 636 45 119 8
Aerway 625 46 117 9
Surface 615 42 115 8
Farm 2 Barley, disked
Injection 296 31 55 6
Aerway 274 30 51 6
Surface 275 31 51 6
Farm 3 Corn, not tilled
Injection 629 170 118 32
Aerway 691 214 129 40
Surface 766 198 143 37
Farm 4 Corn, not tilled
Injection NA2 NA NA NA
Aerway 116 233 22 44
Surface 187 241 35 45
1TKN-N = total Kjeldhal N in the manure or land applied; P = total P in the manure or land applied.
2NA = not applicable.
Table 2. Ambient weather conditions recorded at the application sites over the experimental period
Item
Farm
1 2 3 4
Average wind speed, m/s 4.2 4.0 4.0 3.2
Air temperature (minimum), °C 0.8 −0.2 0.6 5.9
Air temperature (maximum), °C 16.1 23.3 22.9 24.3
Average soil temp at 5 cm, °C 7.2 11.6 13.4 13.1
Average relative humidity, % 61 59 59 64
clean hood. The filters (which trap
NH3) were prepared by saturating a
clean filter with 100 μL of 2% (wt/ vol) citric acid and air-drying before assembling the samplers (filters were purchased from Ogawa & Co. USA Inc.). Assembled samplers were then placed into airtight containers and transported to the field for deploy-ment. Immediately after collection in the field, samplers were placed back into the airtight containers and then transported to the laboratory. The filters were carefully removed from the samplers with clean forceps and transferred into 15-mL centrifuge tubes, where they were extracted with
5 mL of 1 M KCl for 30 min, with the
extractant analyzed for NH4-N via
flow-injection analysis (Quickchem 8500, Lachat Instruments, Milwaukee, WI).
Manure Collection and
Analysis
For each plot, a grab sample (~1 L) of liquid manure was collected and transported to the laboratory for analysis (1 sample was missed for the injection treatment at farm 4). Ma-nure was digested using the Kjeldahl method (US Environmental Protec-tion Agency, 1974), with total Kjel-dahl N determined via flow-injection analysis (Quickchem 8500, Lachat Instruments) and total P determined via inductively coupled optical
emis-sions spectrometry (Optima 4300 DV, Perkin Elmer Inc., Waltham, MA). The manure N and P concentrations and calculated N and P application rates are shown in Table 1. The liquid application rate was approximately 190 m3/ha on all plots, with average
N and P application rates ranging from 28 to 130 kg N/ha and 6 to 36 kg P/ha, respectively.
Statistics
Ammonia concentrations were tested for normality by using the Shapiro-Wilk test with the CAPA-BILITY procedure (SAS Institute, 2004). Where results suggested nonnormality, variables were square root transformed before statistical analyses, with untransformed numbers presented in the text. The data were analyzed using the MIXED procedure of SAS. Data were analyzed using a full factorial model that included application method, sampler height, day, and their interactions as fixed effects, with farm as a random effect. Where appropriate, means separation was carried out using the difference of the least squares means with Tukey-Kramer adjustment and an α level of 0.05. Statements of statistical signifi-cance were based on P < 0.05 unless otherwise stated.
RESULTS AND DISCUSSION
The average concentrations of NH3
ranged from 0.03 to 0.21 mg NH3-N/
m3 over the 3-d period. There were
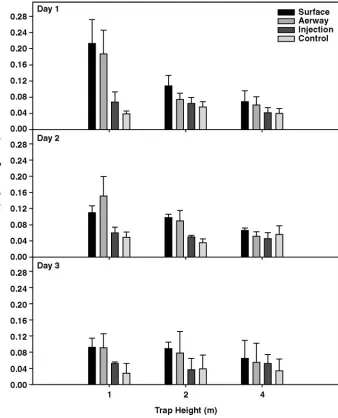
significant main effects (P < 0.001) of sampler height, day, and application method, with all interaction terms be-ing not significant. The placement of the samplers had a significant effect
on measured NH3 concentrations, with
concentrations being negatively cor-related with height of sampler
(Fig-ure 2). Average NH3 concentrations
(averaged across treatments and days) decreased by approximately 50% (0.10 to 0.05 mg NH3-N/m3) as the height
of trap placement increased from 1 to 4 m above the soil surface. This trend was likely due to increased dilution of
NH3 with background air as distance
increased between the sampler and
the NH3 source. This suggests that it
is advisable to place samplers at lower heights to increase sensitivity for mea-suring treatment differences.
Ammonia concentrations averaged over treatment and height were 0.09, 0.07, and 0.06 mg NH3-N/m3 for d 1,
2, and 3, respectively. The greatest
NH3 concentrations were found during
the first 48 h after manure applica-tion (Figure 2). This is similar to the results of Sullivan et al. (2003),
who reported that NH3 volatilization
rates from land-applied swine efflu-ent peaked immediately after appli-cation and then rapidly declined to background emissions 4 to 6 d after treatment. Beauchamp et al. (1982)
also reported that NH3 fluxes from
land-applied liquid cattle manure were greatest during the first and second day and diminished during succeeding days. Bittman et al. (2005) reported
that approximately 85% of NH3
emis-sions from land application of liquid dairy manure occurred during the first 24 h. This suggests that immedi-ate incorporation of manure is needed
to minimize NH3 losses and that the
benefits are greater when manure is incorporated within 48 h.
Average NH3 concentrations
(aver-aged across all farms) were 0.11, 0.10, 0.05, and 0.04 mg NH3-N/m3 for the
surface, Aerway, subsurface injection, and control treatments, respectively. When the full model was used, there was a main effect of application
method on NH3 concentrations
fol-lowing the trend: surface = Aerway > subsurface injection > control. The
effect of treatment on NH3
concentra-tion averaged over d 1 and 2 at a 1-m height is shown in Figure 3 (there was
no significant difference between NH3
concentrations for these days at a
1-m height). The average NH3
con-centrations in this case followed the trend: surface = Aerway > subsurface injection = control. There was a 67%
decrease in NH3 concentration when
liquid manure was applied by subsur-face injection vs. sursubsur-face or Aerway application, which did not differ. Hoff et al. (1981) reported an 80% decrease in NH3 losses by injecting liquid swine manure compared with surface application. Morken and Sakshaug (1998) reported a decrease of 62%
in NH3 losses when manure slurry
was injected directly into the ground vs. surface applied. These litera-ture values are very similar to those determined in the present study and indicate that injection of manure is an excellent way to decrease NH3 losses from land-applied liquid manures.
In the present study, there was no difference between surface applica-tion of liquid manure and Aerway application, which incorporates the liquid into the soil surface. This is similar to the findings of Gordon et al. (2000), who reported no difference in NH3 volatilization when using the Aerway equipment for incorporation vs. surface application. However, in the study by Gordon et al. (2000), the Aerway was used either before slurry application or after, whereas in the present study the manure was ap-plied immediately before the tines of the Aerway system. Contrary to the present findings, Bittman et al. (2005)
reported a 48% reduction in NH3
emissions with Aerway incorporation vs. surface application of liquid dairy manure. In the study by Bittman et al. (2005), the application rates were approximately 2.5-fold less than the rates used in the present study and the plots were harvested pasture, which may have improved incorpora-tion of the liquid manure over that found in the present study and there-fore reduced emission rates.
Based on the results of the pres-ent study, the use of liquid manure injection would be the best BMP for
reducing NH3 emissions from land
ap-plication sites. Additionally, immedi-ate incorporation of surface-applied manure is advisable, because most of
the NH3 losses occurred within the
first 48 h. Shallow incorporation of liquid manure provided no reduction
in NH3 losses compared with surface
application and would therefore not
be a suitable BMP for reducing NH3
volatilization at application rates similar to those used in this study.
IMPLICATIONS
Subsurface injection of manure
reduced average NH3 concentrations
by 67% compared with surface or
Figure 3. Ammonia concentrations for the manure application treatments averaged over 2 d at 1-m height. a,bTreatments with the same letter are not statistically different
Aerway application. Both the surface and Aerway applications had the
same NH3 concentrations, indicating
that shallow incorporation of manure (Aerway) did not have an effect on potential NH3 losses and therefore is not an appropriate BMP to reduce
NH3 volatilization from liquid manure
application at these rates. Ammonia concentrations were greatest during the first 48 h after application, indi-cating that immediate incorporation of surface-applied manure is necessary to reduce NH3 losses.
ACKNOWLEDGMENTS
This work was partially funded by the USDA Natural Resource Conser-vation Service (Boise, ID) through a Conservation Innovation Grant. We would also like to thank Dave Roper (M.V.P. Environmental Services) for his assistance with this project.
LITERATURE CITED
Beauchamp, E. G., G. E. Kidd, and G. Thur-tell. 1982. Ammonia volatilization from liquid dairy cattle manure in the field. Can. J. Soil Sci. 62:11.
Bittman, S., L. J. P. van Vliet, C. G. Kow-alenko, S. McGinn, D. E. Hunt, and F.
Bou-naix. 2005. Surface-banding liquid manure over aeration slots: A new low-disturbance method for reducing ammonia emissions and improving yield of perennial grasses. J. Agron. 97:1304.
Brunke, R., P. Alvo, P. Schuepp, and R. Gor-don. 1988. Effect of meteorological param-eters on ammonia loss from manure in the field. J. Environ. Qual. 17:431.
Erisman, J. W., and M. Schaap. 2004. The need for ammonia abatement with respect to secondary PM reductions in Europe. Envi-ron. Pollut. 129:159.
Fangmeier, A., A. Hadwiger-Fangmeier, L. Van der Eerden, and H.-J. Jäger. 1994. Effects of atmospheric ammonia on vegeta-tion—A review. Environ. Pollut. 86:43. Gordon, R., G. Patterson, T. Harz, V. Rodd, and J. MacLeod. 2000. Soil aeration for dairy manure spreading on forage: Effects on am-monia volatilization and yield. Can. J. Soil Sci. 80:319.
Hoff, J. D., D. W. Nelson, and A. L. Sutton. 1981. Ammonia volatilization from liquid swine manure applied to cropland. J. Envi-ron. Qual. 10:90.
Hutchinson, G. L., and F. G. Viets Jr. 1969. Nitrogen enrichment of surface water by absorption of ammonia volatilized from cattle feedlots. Science 166:514.
McCubbin, D. R., B. J. Apelberg, S. Roe, and F. Divita. 2002. Livestock ammonia management and particulate-related health benefits. Environ. Sci. Technol. 36:1141. Morken, J., and S. Sakshaug. 1998. Direct ground injection of livestock waste slurry
to avoid ammonia emission. Nutr. Cycling Agroecosyst. 51:59.
National Agricultural Statistics Service. 2007. Data and Statistics, Quick Stats. National Agricultural Statistics Service, USDA. http:// www.nass.usda.gov/Data_and_Statistics/ Quick_Stats/index.asp Accessed October 3, 2007.
Roadman, M. J., J. R. Scudlark, J. J. Meis-inger, and W. J. Ullman. 2003. Validation of Ogawa passive samplers for the determination of gaseous ammonia concentrations in agricul-tural settings. Atmos. Environ. 37:2317. SAS Institute. 2004. SAS/STAT User’s Guide. Release 9.1. SAS Inst. Inc., Cary, NC. Sullivan, D. G., C. W. Wood, W. F. Owsley, M. L. Norfleet, B. H. Wood, J. N. Shaw, and J. F. Adams. 2003. Ammonia volatilization from a swine waste amended bermudagrass pasture. Commun. Soil Sci. Plant Anal. 34:1499.
Sutton, M. A., C. E. R. Pitcairn, and D. Fowler. 1993. The exchange of ammonia be-tween the atmosphere and plant communities. Adv. Ecol. Res 24:301.
United Dairymen of Idaho. 2006. Idaho Dairy Facts. United Dairymen of Idaho. http:// www.idahodairycouncil.com/generaldairyinfo. asp Accessed October 3, 2007.