www.BioTechniques.com
195
Vol. 46 | No. 3 | 2009
Introduction
With the introduction of new high-throughput DNA sequencing techniques capable of gener-ating millions/billions of sequence reads per run, genomic research is advancing faster than ever (1–4). In the field of paleogenetics, the first complete nuclear genome has yet to be recovered, but major sequencing projects of woolly mammoth (5) and Neanderthal (6) are heading what has been called the “third wave” of progress in ancient DNA (aDNA) studies (7). These new sequencing platforms generate large quantities of protein coding data, which will undoubtedly assist in the
study of molecular evolution, functional genomics, and adaptation. In addition to coding data, the huge number of randomly amplified sequences provides the opportunity to search for microsatellites or short tandem repeats (STRs). These non-coding sequences with a high rate of mutation are applied as markers in a wide array of genetic research, especially in relation to forensics, modern population biology, and parentage analyses.
A limited number of successful STR amplifications have been reported from ancient substrates using “modern” STRs as templates (8–10) but to our knowledge, no microsatellite primers developed directly from
aDNA templates (let alone extinct species) have been published prior to this study. This is likely due to complications in tradi-tional microsatellite library construction as the result of the degraded and cross-linked nature of ancient DNA (11). Greenwood et al. (10) managed to amplify a single microsat-ellite locus in woolly mammoth using primers developed for modern elephants. However, to rely solely on primers developed for related modern taxa, when targeting microsatellites in extinct ones, is problematic because of possible low cross-species amplification rates and chance of monomorphism in the target species (12,13). This is especially pertinent in taxa such as moa, where the likelihood of cross-species amplification is limited as a result of the >80 million years that separate moa from their closest living relatives among the ratite birds (14). Consequently, the chance of identi-fying polymorphic microsatellite markers in ancient DNA templates of an extinct taxon seems greatly enhanced when the potential markers have been identified directly on the target species.
The Roche GS-FLX (454 Life Sciences, Branford, CT, USA) sequencing technology is currently capable of producing 0.1 gigabases per run with a read length averaging 200–300 nucleotides—a sequence size that allows for the presence of an STR and sufficient flanking regions to design primers. A GS-FLX run was conducted on a Pachyornis elephantopus
(heavy-footed moa) bone extract to identify a series of microsatellite loci. To illustrate the viability of this technique, we identified an (AC)12 microsatellite (directly from raw
GS-FLX data) and demonstrated cross-species amplification in three cross-species of moa. All eleven New Zealand moa species were driven to extinction in the early 15th century, following the arrival of Polynesians. Identifi-cation of new STR markers, such as described here, will enable detailed DNA profiling of extinction processes and past population dynamics of these ancient ratites.
Materials and methods
Sampling of moa fossils and DNA isolation
Sampling of moa fossils was conducted by drilling out cylindrical elements (diameter of _1 cm) of moa tibiotarsal bones using a power drill and diamond-dust coated drill bits. Each sample was then ground into bone powder using a Dremel tool (Part no. 114; Racine, WI, USA). To minimize the incorporation of any possible DNA contamination present on the bones, the bone surfaces and the inner porous parts were excluded, and only solid cortical bone was processed. Contamination from external sources—as well as
cross-contami-Identification of microsatellites from
an extinct moa species using high-
throughput (454) sequence data
Morten E. Allentoft
1,4, Stephan C. Schuster
2, Richard N. Holdaway
1,3,
Marie L. Hale
1, Emma McLay
4, Charlotte Oskam
4, M. Thomas P.
Gilbert
5, Peter Spencer
4, Eske Willerslev
5, and Michael Bunce
41
School of Biological Sciences, University of Canterbury, Christchurch, New
Zealand,
2Pennsylvania State University, Center for Comparative Genomics
and Bioinformatics, University Park, PA, USA,
3Palaecol Research Ltd,
Christchurch, New Zealand,
4Ancient DNA laboratory, School of Biological
Sciences and Biotechnology, Murdoch University, Perth, Australia, and the
5
Department of Biology, University of Copenhagen, Copenhagen, Denmark
BioTechniques 46:195-200 (March 2009) doi 10.2144/000113086
Keywords: ancient DNA; microsatellite development; extinct species; high-throughput 454 sequencing Supplementary material for this article is available at www.BioTechniques.com/article/113086.
www.BioTechniques.com
196
Vol. 46 | No. 3 | 2009
nation between samples—was minimized by thoroughly cleaning equipment and sampling environment (with 10% bleach and 100% alcohol) between the processing of each individual. To minimize the risk of a ubiquitous DNA contaminant being present on all the bones, fossils representing three different moa species—from two different sites, and from several different museum/ university collections—were included (Supplementary Table 1). Pyramid Valley and Bell Hill Vineyard Swamp both represent late Holocene deposits in North Canterbury, New Zealand, with a known fossil record spanning app. 3700–700 bp (15, R.N.H. unpublished data).
DNA was extracted from 200 mg of bone powder through incubation with rotation at 55°C for 48 h in 1.5 mL digestion buffer [20 mM Tris, pH 8.0, 1% Triton X-100, 10 mM dithiotheitol (DTT), 1 mg/mL proteinase K and 0.5 M EDTA]. The super-natant was spun through Centricon 30,000 molecular weight cut-off (MWCO) ultra-filtration devices (Millipore, Billerica, MA, USA) columns combined with 5 volumes of PBI buffer (Qiagen, Valencia, CA, USA) and DNA was then extracted using silica spin columns (Qiagen) and cleaned with AW1 and AW2 wash buffers (Qiagen) before final elution in 60 μl of 10 mM Tris buffer. For species identification, and to confirm the relative quantities of aDNA in the fossil extracts, a 242-bp sequence of moa mitochondrial control region was amplified (by qPCR) using the species-specific primer set 262f/441r (Supplementary Figure 3) and then sequenced as described in Bunce et al. (16) (data not shown).
GS-FLX sequencing, microsatellite primer development and PCR
A DNA extract from a single moa individual (P. elephantopus) from the Bell Hill Vineyard Swamp, which demonstrated good qPCR amplification and long nuclear amplicons (data not shown), was picked for a quarter-plate run on a GS-FLX instrument (Center for Comparative Genomics and Bioin-formatics, Pennsylvania State University, PA, USA). The moa DNA library was constructed, as previously described (5,17), with the modification of leaving the extracted DNA unsheared before blunt-ending and phosphorylating the DNA fragments by enzymatic polishing using T4 DNA polymerase, T4 polynucleotide kinase, and
E. coli DNA polymerase. The blunt-ended, double stranded DNA fragments were then subjected to adapter ligation followed by isolation of the single-stranded template DNA (sstDNA). Subsequently, DNA library fragments were captured onto beads and clonally amplified within individual
emulsion droplets (emPCR). The emulsions were disrupted using isopropanol and beads containing amplified DNA fragments were enriched and recovered for sequencing. The recovered sstDNA beads were packed onto a quarter division of a 70 mm × 75 mm PicoTi-terPlate (454 Life Sciences) and loaded onto the GS-FLX sequencing system as previously described (5). The sequencing run yielded 79,796 sequences averaging 112 bp in length. Subsequently, the data were screened for STR sequences using MSATCOMMANDER (18) and a total of 195 di-, tri-, and tetranu-cleotide repeat sequences were detected (23 of them with six or more repeats). Seven of these proved particularly promising, with flanking regions of sufficient lengths and a base composition suitable for primer design (Figure 1A and Supplementary Figure 2). The sequence chosen for initial trial was clone # 103234_2765_0456, a 158-bp sequence which included an (AC)12 dinucleotide
repeat (Figure 1A, GenBank accession no. FJ513189). Primers were then manually designed from this original clone to target
a 114-bp sequence, designated Moa_MS2 (Figure 1A).
Each microsatellite PCR was conducted in a 25-μL volume containing 2 μL DNA extract, 1 μL 10mg/mL bovine serum albumin (BSA), 1 μL each of 10 mM
forward (5b-TGAGCACCA
ATA-CAACTTCATGG-3b) and reverse primer
(5b
-GACTGTTATTCTATTCCAG-TATATGTTTG-3b), 2.5 μL 10× ABI Gold Buffer, 2.5 μL 25mM MgCl2, 0.2 μL 5 units/
μl ABI Gold Taq polymerase, 0.25 μL of each dNTP (25 mM) and 14.55 μl ultrapure H2O (Catalog nos. 4311816 and AM 9935;
Applied Biosystems, Foster City, CA, USA). Thermal cycling was initiated with a 3-min 95° denaturation step followed by 50 cycles of 95° for 20 s, 57° for 45 s, and 72° for 45 s. A final extension was carried out at 72° for 10 min to maximize adenylation. Negative extraction and amplification controls were always included. DNA fragments were separated on an ABI 3730 genetic analyzer and sized by co-running a Genescan LIZ500 size standard (Applied Biosystems, Foster
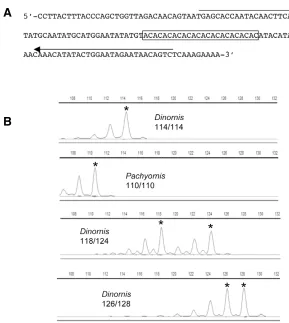
Figure 1. Identification of a polymorphic microsatellite (Moa_MS2) in an extinct species. (A) The orginal clone identified in the GS-FLX data (clone # 103234_2765_0456). The (AC)12 repetitive region
is boxed and the location of forward and reverse primer sequences indicated by arrows. (B) Chro-matographs obtained from the amplification of the Moa_MS2 locus in two moa genera (Dinornis and
Pachyornis). Modified screencapture from GENEMARKER version 1.5. The upper two panels show homozygotes and the two lower panels show heterozygotes. Alleles are marked with an asterisk and aditional peaks represent stutter and A+ peaks, commonly observed during STR profiling. Chromato-graphs from other species/individuals are found in Supplementary Figure 1.
A
City, CA, USA). DNA fragments were scored manually with the aid of GENEMARKER version 1.5 (Soft Genetics, State College, PA, USA). To check the integrity of the microsat-ellite, several individual Moa_MS2 amplifi-cation products were cloned using a TOPO TA cloning kit (Invitrogen, Carlsbad, CA, USA) and sequenced using vector specific M13 primers according to the manufacturer’s instructions. Comparisons of the clone sequence data with the original GS-FLX clone confirmed that the Moa_MS2 locus was amplified (data not shown). In accor-dance with aDNA guidelines, DNA extrac-tions and PCR setup occurred in separate and dedicated aDNA facilities at Murdoch University (Perth, Australia).
Results and discussion
Of the 74 bone DNA extracts prescreened with mtDNA control region amplifica-tions, 52 amplified with the Moa_MS2 primers. The generated chromatographs were consistent with expected dinucleotide STR patterns (including stutters and A+ peaks, see Figure 1B and Supplementary Figure 1). The Moa_MS2 locus yielded a total of 13 different alleles in the three extinct moa genera tested here (Dinornis, Pachyornis, and Euryapteryx). Summary statistics for this single locus are presented in Table 1. Because of the relatively low quality of the template molecules in the fossils, some alleles did not always amplify with the same efficacy in heterozygotes, and allele dropout was observed on occasion. This is not totally unexpected for microsatellites in ancient or
low copy number substrates (19), and when this marker is applied in actual population research (M.A., R.N.H., and M.B., unpub-lished data), these issues would need to be accounted for through multiple replicates
and established protocols (20,21). The chromatographs shown in Figure 1B are a sample of profiles (two homozygotes and two heterozygotes) obtained from 4 moa fossils and demonstrate the 2-bp stuttering charac-teristic of dinucleotide STR in addition to A+ peaks. Other chromatographs can be found in the supplementary information (Supplementary Figure 1).
The developed primer set amplified across all the three moa genera tested, and—more importantly—displayed polymorphism (Table 1), making it ideal for population studies. Attempts to amplify the Moa_MS2
Table 1. Summary Statistics for the Moa_MS2 Microsatellite Locus
Species Size range (bp) n NA NE FIS H Heterozygosity
O HE
South Island giant moa (D. robustus) 110–136 31 10 3.1 0.143 0.581 0.677 ± 0.089
Stout legged moa (E. gravis) 110–128 11 8 5.8 0.230 0.636 0.826 ± 0.145
Heavy footed moa (P. elephantopus) 106–110 10 2 1.9 0.167 0.400 0.505 ± 0.155
Characteristics of the microsatellite locus Moa_MS2 that was optimized for use in three extinct Moa species, including the South Island giant moa (D. robustus), stout-legged
moa (E. gravis) and the heavy-footed moa (P. elephantopus). Descriptive measures include n, the number of individuals; NA, number of alleles; NE, effective number of alleles;
HO, observed and HE, expected heterozygosity and FIS, Wright’s fixation index as a measure of heterozygote deficiency/excess.
BioTechniques Weekly
!!"!BioTechniques
"
" #
!
locus in other ratites (emu, ostrich, rhea) were unsuccessful but considering the deep split to the most recent common ancestor, this was not unexpected. Since this study serves to document the use of high-throughput sequence data as a source of microsatel-lites, a further characterization of the allelic diversity in relation to the various moa species is beyond the scope of this proof-of-concept paper. Clearly, population genetic analyses based on microsatellite data require multiple polymorphic loci. Significantly, our results demonstrate how several potential markers were identified in this quarter-plate GS-FLX run. Although only one STR has been evaluated here, at least seven STRs appeared potentially suitable as genetic markers (Figure S2). Given that birds exhibit a relatively low frequency of microsatellites (22), the frequency of detected microsatellites per run may be even greater in other verte-brate lineages. We screened _64,000 clones of GenBank mammoth data (5), generated using the GS-20 sequencing platform (454 Life Sciences), for microsatellites and identified 15 STRs with ≥6 repeating units (data not shown). The shorter read lengths of the GS-20 (_100 bp), used in the mammoth study, likely explain the slightly lower frequency of identified microsatellites
(0.023%) when compared with the GS-FLX (_200bp) moa run (0.029%).
The characterization of DNA from the fossil record is not without challenges. In fossil bones recovered from soil, a fraction of the present biomolecules is likely to be of bacterial or fungal origin, see (5,23). Moreover, museum specimens are commonly contaminated with human DNA from previous handling (24). When using shotgun sequencing methods such as the ones described here, all DNA molecules in an extract are amplified with equal chance (however, see Reference 25), including any exogenous DNA. Hence, in theory, there is a potential risk of identifying microsatellites— and even conduct population analyses—for the microbial flora/fauna or other contami-nants associated with the fossils instead of the target species itself. With regard to the data presented here, we consider human contamination unlikely because the flanking regions of Moa_MS2 demonstrated no significant matches when queried against the human genome database. The paucity of environmental microbe sequences in GenBank makes a similar approach to detect microbes more problematic, but in the case of Moa_MS2, it is unlikely to be of microbial origin for the following reasons:
(i) Though present, microsatellites are much scarcer in prokaryotes and fungus compared with higher eukaryotes (26–29). (ii) Many heterozygotes were detected among the 52 genotyped moa, whereas the haploid nature of bacteria should generate only one allele per clone. (iii) Fungi exist in a variety of ploidy states, and we never observed more than 2 alleles in any of the fossil bone profiles. (iv) Fossils from different collections and origi-nating from very different depositional environments in New Zealand with different microbial communities still yielded repro-ducible amplifications. (v) Allele frequencies differed among species (see Supplementary Table 2); for example, alleles 106, 114, and 124 are considered “private” alleles for Pachy-ornis, DinPachy-ornis, and Euryapteryx respec-tively. These findings are incompatible with the possibility that the locus is not of moa origin. (vi) Lastly, the qPCR data presented in Supplementary Figure 3 show a significant difference (t-test, P = 0.000038) between mean mtDNA control-region Ct values for those DNA extracts that yielded a Moa_ MS2 profile (mean Ct = 32.4) and those that yielded mtDNA but failed to amplify the Moa_MS2 locus (mean Ct = 36.7). Fossils with poor mtDNA preservation (high Ct values) had a lower success rate for
amplifi-BioTechniques
& #!#!)' ''
#JP5FDIOJRVFTDPN
'FCSVBSZ
7PMVNF
*T
TVF
! ! "
$!" $('&''"# %'&
#JP5FDIOJRVFTDPN
.BS
DI
7PMVNF
*TTVF
www.BioTechniques.com
200
Vol. 46 | No. 3 | 2009
cation of the nuclear marker. A quantitative correlation, such as observed here, should not exist if the microsatellite originated from a source other than moa.
In summary, data generated using a high-throughput DNA sequencing technique were pivotal in identifying a polymorphic micro-satellite marker in the extinct New Zealand moa. Mining genomic data for microsatel-lites is especially relevant to aDNA where the preservation is not conducive to more tradi-tional approaches of library enrichment and construction. We argue that STRs identified using shotgun sequencing approaches, coupled with better DNA isolation techniques, will facilitate research into high-resolution ancient population genetics similar to those currently conducted on extant species.
As average 454 read lengths increase to _400 bp (30) and the costs of sequencing decrease, the number of potential microsat-ellite markers identified per run can increase dramatically. It may not be long before shotgun sequencing will replace traditional enrichment library approaches, with one major benefit being the large amount of ancillary mitochondrial and nuclear data that are generated. Moreover, when enrich-ments steps are combined with coded primers (31), it will be possible to generate microsat-ellite libraries from multiple species simulta-neously. In the context of aDNA, the use of enrichment steps may present a number of additional technical challenges (such as the extent of cross linking) and may be dependent on DNA preservation within the substrate.
Acknowledgements
We would like to gratefully acknowledge the following institutions for samples: Museum of New Zealand Te Papa Tongarewa (A.J.D. Tennyson), Canterbury Museum (P. Scofield) and The American Museum of Natural History. We thank Malene Møhl, Fiona Wilson, James Haile, and Ross Barnett for help during the bone sampling process and Lynn Tomsho for technical assistance in the GS-FLX sequencing. Financial support was provided by The Australian Research Council (DP0771971) and the Marsden Fund of the Royal Society of New Zealand (programme 06-PAL-001-EEB) with Palaecol Research, Ltd. Stephan C. Schuster is supported in part by the Gordon and Betty Moore Foundation.
The authors declare no competing interests.
References
1. Mardis,E.R. 2008. The impact of next-gener-ation sequencing technology on genetics. Trends Genet. 24:133-141.
2. Medini,D.,D.Serruto,J.Parkhill,D.A.Relman, C.Donati,R.Moxon,S.Falkow, andR.Rappuoli.
2008. Microbiology in the post-genomic era. Nat. Rev. Microbiol. 6:419-430.
3. Blow,N. 2008. DNA sequencing: generation next-next. Nat. Methods 5:267-274.
4. Schuster,S.C. 2008. Next-generation sequencing transforms today’s biology. Nat. Methods
5:16-18.
5. Poinar,H.N.,C.Schwarz,J.Qi,B.Shapiro, R.D.E.MacPhee,B.Buigues,A.Tikhonov,D.H. Huson,et al. 2006. Metagenomics to paleog-enomics: Large-scale sequencing of mammoth DNA. Science 311:392-394.
6. Green,R.E.,J.Krause,S.E.Ptak,A.W.Briggs, M.T.Ronan,J.F.Simons,L.Du,M.Egholm, et al. 2006. Analysis of one million base pairs of Neanderthal DNA. Nature 444:330-336. 7. Millar,C.D.,L.Huynen,S.Subramanian,E.
Mohandesan, andD.M.Lambert. 2008. New developments in ancient genomics. Trends Ecol. Evol. 23:386-393.
8. Amory,S.,C.Keyser,E.Crubezy, andB.Ludes.
2007. STR typing of ancient DNA extracted from hair shafts of Siberian mummies. Forensic Sci. Int. 166:218-229.
9. Manen,J.F.,L.Bouby,O.Dalnoki,P.Marinval, M.Turgay, andA.Schlumbaum. 2003. Micro-satellites from archaeological Vitis vinifera seeds allow a tentative assignment of the geographical origin of ancient cultivars. J. Archaeol. Sci. 30 :721-729.
10. Greenwood,A.D.,F.Lee,C.Capelli,R.DeSalle, A.Tikhonov,P.A.Marx, andR.D.E.MacPhee.
2001. Evolution of endogenous retrovirus-like elements of the woolly mammoth (Mammuthus primigenius) and its relatives. Mol. Biol. Evol.
18:840-847.
11. Paabo,S. 1989. Ancient DNA: extraction, charac-terization, molecular cloning, and enzymatic amplification. Proc. Natl. Acad. Sci. USA 86 :1939-1943.
12. Primmer, C.R., A.P. Moller, and H. Ellegren. 1996. A wide-range survey of cross-species microsatellite amplification in birds. Mol. Ecol. 5:365-378.
13. Primmer,C.R.,J.N.Painter,M.T.Koskinen, J.U.Palo, andJ.Merila. 2005. Factors affecting avian cross-species microsatellite amplification. J. Avian Biol. 36:348-360.
14. Cooper,A.,C.Lalueza-Fox,S.Anderson,A. Rambaut,J.Austin, andR.Ward. 2001. Complete mitochondrial genome sequences of two extinct moas clarify ratite evolution. Nature 409 :704-707.
15. Burrows,C.J. 1989. Moa browsing: evidence from the Pyramid Valley mire. N. Z. J. Ecol.
12:51-56.
16. Bunce,M.,T.H.Worthy,T.Ford,W.Hoppitt, E.Willerslev,A.Drummond, andA.Cooper.
2003. Extreme reversed sexual size dimorphism in the extinct New Zealand moa Dinornis. Nature
425:172-175.
17. Margulies,M.,M.Egholm,W.Altman,S.Attiya, J.Bader,L.Bemben,J.Berka, et al. 2005. Genome sequencing in microfabricated high-density picolitre reactors. Nature 437:376-380. 18. Faircloth,B.C. 2008. MSATCOMMANDER:
detection of microsatellite repeat arrays and automated, locus-specific primer design. Mol. Ecol. Resour. 8:92-94.
19. Burger,J.,S.Hummel,B.Herrmann, andW. Henke. 1999. DNA preservation: A microsat-ellite-DNA study on ancient skeletal remains. Electrophoresis 20:1722-1728.
20. Taberlet, P., S. Griffin, B. Goossens, S.Questiau,V.Manceau,N.Escaravage,L.P. Waits, andJ.Bouvet. 1996. Reliable genotyping of samples with very low DNA quantities using PCR. Nucleic Acids Res. 24:3189-3194. 21. Morin,P.A.,K.E.Chambers,C.Boesch, andL.
Vigilant. 2001. Quantitative polymerase chain reaction analysis of DNA from noninvasive samples for accurate microsatellite genotyping of wild chimpanzees (Pan troglodytes verus). Mol. Ecol. 10:1835-1844.
22. Primmer, C.R., T. Raudsepp, B.P. Chowdhary,A.R.Moller, andH.Ellegren.
1997. Low frequency of microsatellites in the avian genome. Genome Res. 7:471-482. 23. Noonan, J.P., M. Hofreiter, D. Smith,
J.R.Priest,N.Rohland,G.Rabeder,J.Krause, J.C.Detter,et al. 2005. Genomic sequencing of Pleistocene cave bears. Science 309:597-600. 24. Gilbert, M.T.P., L. Rudbeck, E.
Willerslev,A.J.Hansen,C.Smith,K.E.H. Penkman,K.Prangenberg,C.M.Nielsen-Marsh, et al. 2005. Biochemical and physical correlates of DNA contamination in archaeological human bones and teeth excavated at Matera, Italy. J. Archaeol. Sci. 32:785-793.
25. Dohm,J.C.,C.Lottaz,T.Borodina, andH. Himmelbauer. 2008. Substantial biases in ultra-short read data sets from high-throughput DNA sequencing. Nucleic Acids Res. 36:e105. 26. Karaoglu, H., C.M.Y. Lee, and W.
Meyer. 2005. Survey of simple sequence repeats in completed fungal genomes. Mol. Biol. Evol.
22:639-649.
27. Toth,G.,Z.Gaspari, andJ.Jurka. 2000. Micro-satellites in different eukaryotic genomes: Survey and analysis. Genome Res. 10:967-981. 28. Schlotterer, C., M. Imhof, H. Wang,
V.Nolte, andB.Harr. 2006. Low abundance of
Escherichia coli microsatellites is associated with an extremely low mutation rate. J. Evol. Biol. 19 :1671-1676.
29. Field,D.andC.Wills. 1998. Abundant micro-satellite polymorphism in Saccharomyces cerevisiae, and the different distributions of microsatel-lites in eight prokaryotes and S. cerevisiae, result from strong mutation pressures and a variety of selective forces. Proc. Natl. Acad. Sci. USA
95:1647-1652.
30. Droege, M. and B. Hill. 2008. The Genome Sequencer FLX System~longer reads, more applications, straight forward bioinfor-matics and more complete data sets. J. Biotechnol.
136:3-10.
31. Binladen,J.,M.T.P.Gilbert,J.P.Bollback, F.Panitz,C.Bendixen,R.Nielsen, andE. Willerslev. 2007. The use of coded PCR primers enables high-throughput sequencing of multiple homolog amplification products by 454 parallel sequencing. PLoS ONE 2:e197.
Received 15 September 2008; accepted 16 December 2008.