R E S E A R C H
Open Access
Expected climate change impacts on land and
natural resource use in Namibia: exploring
economically efficient responses
Jon I Barnes
1, James MacGregor
2*and Moira Alberts
3* Correspondence:james. [email protected] 2Department of Economics, Gothenburg University, Gothenburg, Sweden
Full list of author information is available at the end of the article
Abstract
This paper informs policy over the efficiency of investments on Namibia's rangelands both now and under future expected climate change. It is in this setting that Namibia's pastoralist communities, communal conservancies and increasing numbers of wildlife reside, and their economic activity dominates. We bring the principles of economics to decision-making. We analyse primary land uses, livestock production and wildlife viewing tourism in three ecologically different biomes - the southern Karoo Biome, the central Savanna Biome and the northeastern Woodland Biome. We analyse how expected climate change will impact these investments to 2080. From an economic perspective, pastoralism and wildlife-based tourism developed within common property management systems can be sound investments across Namibia's communal lands. Furthermore, as climate changes, the existing economic benefits to the Namibian economy associated with pastoralism and wildlife-based tourism should be magnified, as capital-intensive commercial fenced ranching systems become less economic. Recent research indicates that adoption of good rangeland management principles involving flexible herding, economies of scale and
commercially viable utilisation of invasive bush can significantly increase profits and economic returns on investment for livestock systems in Namibia. Furthermore, under conditions of expected climate change, our results indicate that income from natural resource use will be more resilient than livestock and other agricultural investments. Estimated losses in economic contribution will be highest in the agricultural sector, and in particular with commercial fenced ranching, and rainfed cropping. Climate change poses considerable challenges for pastoralists and other economic activity on Namibia's rangelands. Global climate modelling suggests that by 2080, Namibia's temperatures will have increased by some 3°C and rainfall decreased by 5% to 20%. Our results suggest that gradual change in climate over the next 70 years will see the potential national value of livestock income halved and that of tourism income reduced by one quarter. Active interventions should include shifts in livestock and rangeland policy, encouraging the adoption of more flexible and resilient systems and including efforts to make rangeland use less rigid and more able to change and adapt. Adaptation to climate change should include promotion of natural resource-based land uses such as continued expansion of the Community Based Natural Resource Management programme. Furthermore, national policy now recognises this, and implementation of the Namibia Rangeland
Management Policy will provide incentives to invest in sound rangeland management.
(Continued on next page)
(Continued from previous page)
Keywords:Namibia, Livestock, Wildlife, Land use, Climate change, Economics
Introduction
Namibia embraces some 900,000 km2 and straddles the Tropic of Capricorn on the southwest seaboard of Africa. It is sparsely populated, with one of the driest countries in sub-Saharan Africa, containing biomes ranging from true desert on the west coast, through arid semi-desert and semi-arid savanna, to semi-arid and sub-humid wood-lands in the northeast. Land use is based on natural rangewood-lands and takes place com-mercially on private land, traditionally on communal state land, and to a lesser extent through leasehold in protected areas.
Reid et al. (2007) used results from a stakeholder workshop exercise and a comput-able general equilibrium model to estimate likely overall impacts of climate change on the Namibian economy. They reported that over a period of 20 years, the annual losses to the Namibian economy could be up to 6% of gross national product (GDP) due to the impact that climate change will have on its natural resources. They argued that this will affect the poor most, with resulting constraints on employment opportunities and declining wages, especially for unskilled labour, and urged Namibia to take steps that will ensure ‘climate proofed’ policies and activities and to have a strategy to deal with displaced farmers and farm workers. Reid et al. (2007) identified the need for climate change to be mainstreamed into policies and planning. Turpie et al. (2010) have ana-lysed the vulnerability of biodiversity and protected areas in Namibia in the face of cli-mate change. They also examined adaptations expected to result and made recommendations in relation to possible interventions which might mitigate impacts.
Humavindu et al. (2011) have analysed national-level policy options for the main agri-cultural and natural resource land uses under the national rangeland management pol-icy (NRMP) (MAWF 2012). This polpol-icy is found to be economically efficient since costs associated with implementation of sound rangeland management are recovered through increased financial and economic income. Further, adoption of sound grazing management plans holds potential for significantly increased profits and returns on in-vestment for rangeland users. Furthermore, as time goes on, with increased adoption and improved skills and understanding among range users, national income amounting to some N$5 billion (US $610 million at September 2012 prices) might be added to the national economy from the rangeland use sector. Such benefits can go a long way to-wards mitigating and reversing the anticipated negative effects of climate change and increasing drought incidence in Namibia.
economic contribution of these activities. Most analytical emphasis was placed on pri-mary land uses, livestock production and wildlife viewing tourism in three ecologically different biomes - the southern Karoo Biome, the central Savanna Biome, and the northeastern Woodland Biome. However, all land and natural resource uses in these areas were considered. These are described below.
Crop and livestock production
Livestock are the mainstay of agricultural production and land use in Namibia. The Woodland and Savanna biomes, found in the north east, north and centre, are essen-tially dominated by cattle, with lesser amounts of small stock. The Karoo biome found in most of southern Namibia is dominated by small stock (sheep and goat) production.
All livestock production is based on extensive systems, breeding and rearing or rearing of stock, based on the productivity of natural rangeland. Cattle are kept on privately owned or leased commercial land on medium-scale fenced farms averaging some 15,000 ha each to produce beef. They are also kept on state-owned communal land, mostly in unfenced common property systems on a small-scale around villages to produce meat, milk, as transport and as a store of wealth. They are also kept at medium-scale cat-tle posts away from villages for the production of beef and as a store of wealth. Some commercial production in fenced land is taking place in communal land mainly to pro-duce beef and as a store of wealth. Fenced commercial farms in the arid south are used to produce mutton sheep and karakul pelts with small amounts of wool, and goats are kept for meat production. On communal land in the south, small-scale production of sheep and goats, also for mutton, pelts and goat meat, takes place on open access or partly fenced properties. Traditional nomadic and semi-nomadic livestock keeping in the arid west and south of the country is no longer prevalent, and almost all extensive livestock keeping on rangeland is sedentary around fixed water points. Relatively unimportant live-stock systems include intensive dairy, pig and ostrich production on commercial land.
Livestock stocking rates on rangeland are maintained by commercial farmers at around the most biologically productive carrying capacities (between 10 and 15 ha per large stock equivalent unit in the north and northeast, and between 15 and 25 ha per large stock equivalent unit in the south and extreme west). In communal common property systems, the stocking rates are closer to the biological limits, the ecological carrying capacity (between 5 and 7 ha per large stock equivalent unit in the north and northeast, and between 7 and 12 ha per large stock equivalent unit in the south and ex-treme west). Herd and flock productivities (calving/lambing rates, mortality rates and animal growth rates) tend to reflect the stocking rates, highest in commercial land and lowest in the communal open access systems. Cattle post systems tend be between the two in terms of stocking rates and productivity. The carrying capacities referred to here are derived from Mendelsohn et al. (2006), and reflect empirically established norms of the Ministry of Agriculture Water and Forestry.
purchases to fill the gap. Medium- to large-scale dryland crop production takes place on commercial land, mostly in the northeast, where maize is the primary crop.
Irrigated crop production takes place on commercial land in the south along the Orange and Fish rivers, in communal land in the northeast along the Okavango river, and to a lesser extent, in the northwest, associated with the Kunene river. A variety of crops is produced, including a mix of food crops and higher value cash crops. In the south, table grape production is very significant. Also grown there are fodder crops and maize, among numerous others. In the north and east, in mostly state-run schemes, the emphasis has been on food crops, but increasing amounts of higher value crops are being introduced. The Green Scheme is an ambitious state-driven initiative aimed at significantly boosting irrigated crop production in the country. A notable feature of irri-gated agriculture is that schemes in the south tend to be financially and economically viable, while those in the north tend to have poor or non-existent financial economic viability. This is largely due to the location, remote from markets for inputs and pro-ducts of the northern schemes (Barnes et al., unpublished work).
Tourism, wildlife production and natural resource uses
Tourism is a rapidly growing sector in Namibia, and the leisure tourism component of this, which makes up some 40%, is dominated by based pursuits. The nature-based component is attributable to a range of natural assets, including scenery and wildlife, which are the most important. Barnes et al. (2009) used data from the tourism survey of SIAPAC (2007) to estimate that wildlife contributed some 50% of the value of nature-based tourism. Approximately 80% of the value of nature-based tourism is non-consumptive, based in lodge or camp accommodation in the commercial land, state land (parks), and communal land. The other 20% consists of consumptive tourism, dominated by trophy hunting, which takes place mostly on commercial land but also on communal land and state land. Another, lesser, consumptive tourism component consists of marine shore angling.
Tourism on commercial land takes the form of landholder enterprises, while that on state and communal takes the form of leasehold enterprises in joint venture partner-ships with land holders - either government or local communities. The well-established community-based natural resource management (CBNRM) programme enables com-munities on communal land to form common property conservancies through which they can manage and utilise wildlife mostly for tourism. Tourism as described above holds significant comparative advantages for Namibia as it is not entirely dependent on scarce and erratic rainfall, but also makes use of the natural beauty inherent in the landscapes. Tourism potential tends to be localised around areas of high scenic value and high wildlife concentrations.
while that on communal land is generally unfenced. Although wildlife-based and livestock land uses commonly take place together at regional and landscape scale, they tend to be separated spatially at farm/conservancy and enterprise scale.
The use of wild plant resources takes place mostly on communal land and to a lesser extent on commercial land. Nearly all rural households harvest wood for fuel, poles for building, and non-timber wild plant products for food, medicines and as raw materials for crafts. A significant charcoal industry is developing on commercial land where bush encroachment has been a problem. Inland fishing is practised in the wetlands of the northeast and north. Here, households operate at a small scale to harvest fish from riv-ers and floodplains. The use of natural resources on communal land is generally under-taken by individual households in an open access setting. In a small number of areas, common property management is being applied through community-based organisa-tions such as conservancies and community forests.
Methodology
Review of climate change predictions
The evidence for anthropogenic climate change as it applies to Namibia was reviewed. Much of the work already done in this region is based on older generation climate sce-narios dating from the early 2000s, and the Third Assessment Report of the Intergov-ernmental Panel on Climate Change (IPCC TAR). Later generation climate change scenarios have been developed for the Fourth Assessment Report (IPCC AR4). Key references were GF Midgley and D Gou (unpublished work), Turpie et al. (2010), Midgley et al. (2005), who used these scenarios in the context of Namibia.
Development and analysis of land use enterprise models
The livestock systems and tourism wildlife viewing enterprises in Namibia were mod-elled to provide financial and economic measures of value. Standardised financial and economic, spreadsheet, enterprise appraisal models as developed in the economics unit of Ministry of Environment and Tourism (MET) were developed for each enterprise. These include annualised budgets and 10-year enterprise development streams valued in Namibia dollars (N$) at constant 2008 prices, where N$1:00 = US$0.13.
The financial analyses measured theprofitabilityfor investors or the financial incentive to engage in the activity. The economic analyses measured the value added by these activ-ities to the national income, measured as thedirectnet change ingross national income. No account was taken of the indirect value added associated with the activities, though backward and forward linkages. Nor was account taken of indirect use values (ecosystem service values), and non-use values (existence, bequest and option values).
These were then valued to estimate financial values for initial and ongoing capital requirements, recurrent variable and fixed operating expenses, and recurrent enterprise gross income. The annual net income (profit), income accruing to local communities, was determined. The overall financial return on investment was measured as the 10-year internal rate of return and the 10-10-year net present value. Tables 1, 2, 3 and 4 show some of the parameters used in the enterprise models.
The livestock systems modelled for the Woodland and Savanna biomes included un-fenced traditional small-scale livestock keeping on open access communal land, unun-fenced cattle posts, medium-scale ranching on partially exclusive communal land and fenced commercial medium- to large-scale ranching (breeding and rearing) on fully exclusive commercial land. All these were dominated by cattle and entailed some form of breeding and rearing. The traditional small-scale system is typical of the more densely settled areas of communal land where stocking rates are high and overall herd growth is slow, while the medium-scale cattle post system is expanding into open communal land where stock-ing rates are moderate and the overall herd growth is high. In the fenced commercial sys-tems, stocking rates are maintained at near optimal levels for biological productivity, allowing for highest herd productivity and moderate herd growth.
In the Karoo biome, the livestock systems, dominated by small stock, included unfenced traditional small-scale small stock production on communal land and fenced large-scale commercial small stock ranching on commercial land. These involved breeding of karakul sheep for pelts, and or breeding and rearing of sheep and goats for meat production.
The tourism systems modelled in all biomes involved exclusive unfenced commercial large-scale non-consumptive tourism with lodge development on communal land. The models involve a leasehold system where the tourism investors do not own the land or wildlife stock. Generally, lower livestock stocking rates, on commercial land and in the open parts of communal land, enable wildlife populations to survive and provide the
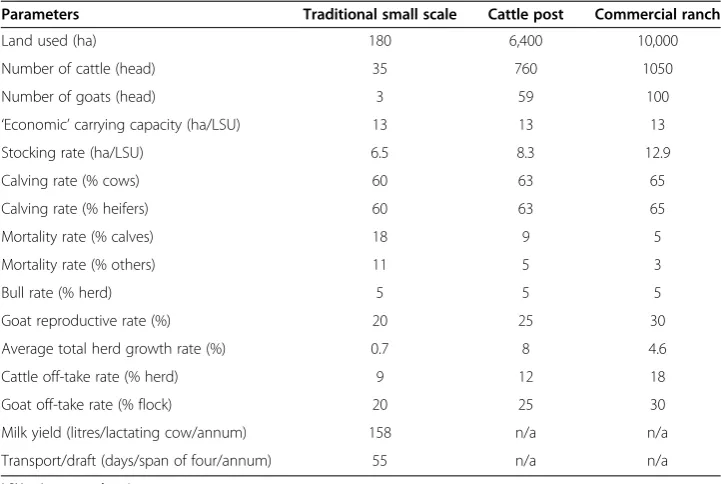
Table 1 Comparative key parameters used in base case models for the Woodland and Savanna biome livestock systems
Parameters Traditional small scale Cattle post Commercial ranch
Land used (ha) 180 6,400 10,000
Number of cattle (head) 35 760 1050
Number of goats (head) 3 59 100
‘Economic’carrying capacity (ha/LSU) 13 13 13
Stocking rate (ha/LSU) 6.5 8.3 12.9
Calving rate (% cows) 60 63 65
Calving rate (% heifers) 60 63 65
Mortality rate (% calves) 18 9 5
Mortality rate (% others) 11 5 3
Bull rate (% herd) 5 5 5
Goat reproductive rate (%) 20 25 30
Average total herd growth rate (%) 0.7 8 4.6
Cattle off-take rate (% herd) 9 12 18
Goat off-take rate (% flock) 20 25 30
Milk yield (litres/lactating cow/annum) 158 n/a n/a
Transport/draft (days/span of four/annum) 55 n/a n/a
basis for investment in wildlife conservation and use through tourism. As stated, finan-cial and economic comparative advantage has ensured a steady relative increase in wildlife-based land use in these areas (Barnes and Jones 2009).
The assumptions used in the livestock system models differed slightly between those for the Woodland and Savanna biomes. However, the differences were small, as the higher primary productivity in the wetter northeastern woodlands tends to be offset by less favourable vegetation structure for livestock grazing.
The use of enterprise models for sensitivity analysis was restricted to the livestock and tourism land uses described above. For other land and natural resource uses, enter-prise models were used subjectively to assess the likely impacts of climate change on their net incomes and economic contributions. Models for several land and natural resource Table 2 Comparative key parameters used in base case models for the Karoo biome livestock systems
Parameters Traditional small scale Commercial ranch
Land available (ha) 87,000 87,000
Land used (ha per enterprise) 2,330 52,200
No. livestock (head) 285 10,346
No. large stock units (LSU) 47 871
Stocking rate (ha/LSU) 50 60
‘Economic’carrying capacity (ha/LSU) 60 60
Lambing/kidding rate (% of ewes) 90 130
Lambing/kidding rate (% of young ewes) 98 130
Mortality rate (% of lambs) 40 28
Mortality rate (% of adults) 7 5
Ram rate (% of flock) 3 3
Stock off-take rate (% of stock numbers) 16 31
Biomass production (% of stock LSU) 14 24
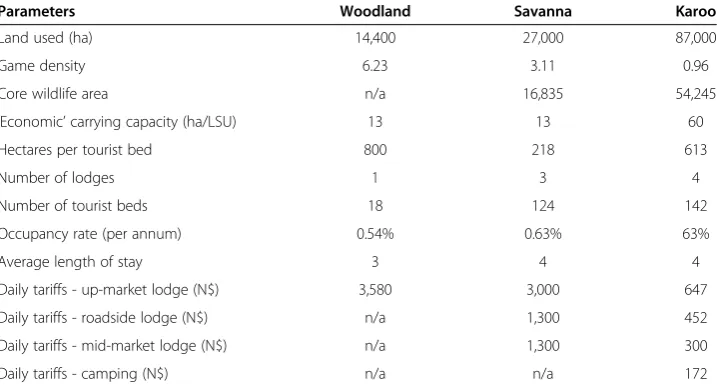
Table 3 Comparative key parameters used in base case models for tourism wildlife viewing enterprises in the Woodland, Savanna and Karoo biomes (2008)
Parameters Woodland Savanna Karoo
Land used (ha) 14,400 27,000 87,000
Game density 6.23 3.11 0.96
Core wildlife area n/a 16,835 54,245
‘Economic’carrying capacity (ha/LSU) 13 13 60
Hectares per tourist bed 800 218 613
Number of lodges 1 3 4
Number of tourist beds 18 124 142
Occupancy rate (per annum) 0.54% 0.63% 63%
Average length of stay 3 4 4
Daily tariffs - up-market lodge (N$) 3,580 3,000 647
Daily tariffs - roadside lodge (N$) n/a 1,300 452
Daily tariffs - mid-market lodge (N$) n/a 1,300 300
uses were derived from Barnes et al. (unpublished work). These included models for small- and medium-scale rainfed crop production, as it takes place in the north and north-east of the country, large-scale commercial irrigation along the perennial rivers and small-scale inland fishing enterprises. Models for wild plant use were derived from Barnes et al. (2005, 2010). The models developed of community-based natural resource management (CBNRM) initiatives by Barnes et al. (2002) were also used to examine the resilience of community conservancies to changes in rangeland productivity.
Aggregate economic value of agricultural production and natural resource use
The land uses described above have been valued in terms of their contribution to the gross national income. This is the baseline for measuring the likely economic impacts of climate change. The study focused on the land use activities. Only their direct impacts on the national economy were measured, and no account was taken of back-ward and forback-ward linkages associated with these land and natural resource uses. Thus, value added through enterprises, supplying inputs to the land and resource use activ-ities, or value added as a result of product processing such as meat processing, is excluded. The values are given in value added to the gross national income (GNI).
The basis for the agricultural values is the national accounts' GDP by activity data, presented by IPPR [Institute for Public Policy Research] (2009), which cover the period between 1990 and 2005, divided into commercial and communal agriculture. With the use of ratios from Sherbourne (2009) and Mendelsohn et al. (2006), the data were dis-aggregated into those attributable to commercial land livestock, communal land live-stock, commercial land crop production and communal land crop production. The commercial land livestock value was further disaggregated into cattle and small stock. These values were projected to 2009 using the averages of real annual growth rates recorded between 1995 and 2005 and then inflated as appropriate to reflect 2009 prices. The annual growth rate applied for the commercial sector was 3.4% and that for communal sector was 2.1%.
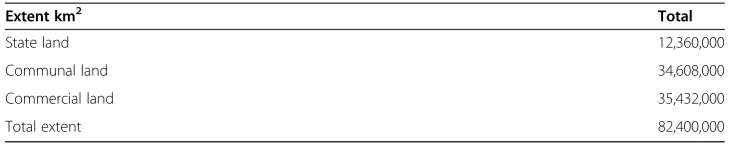
Natural resource values were derived from various sources. Values for nature-based tourism, including trophy hunting tourism, were derived from the wildlife accounts (Barnes et al. 2009) and verified through comparison with the studies by Turpie et al. (2010) in the value of parks, and the tourism satellite accounts WTTC/World Travel and Tourism Council (2006) and Barnes et al. (2010, 2008). These values were subjected to real growth of 5.5% per annum to 2009, reflecting growth rates recorded and predicted by WTTC (2006) and adjusted to take account of the 2008 economic downturn. They were then also inflated to reflect 2009 prices. Values for wildlife use other than tourism were derived from the wildlife accounts (Barnes et al. 2009). They were adjusted to 2009 values, through real growth at 7.2% per annum, based on average growth between 2004 Table 4 The estimated extent of land divided according to tenure in Namibia
Extent km2 Total
State land 12,360,000
Communal land 34,608,000
Commercial land 35,432,000
and 2007, recorded by T Uahengo,(personal communication), adjusted to take account of the 2008 economic downturn and thereafter inflated accordingly.
Values for the use of wild plants were derived from the forest accounts which include the use of non-timber wild plant products (Barnes et al. 2005). They were adjusted to 2009 figures using the expected real annual growth rate of 4.2% predicted in the accounts, adjusted to take into account the 2008 economic downturn and inflated ac-cordingly. Values for inland fish use were derived from the 2008 values estimated by Barnes et al. (unpublished work), extrapolated to all areas with inland fisheries and inflated accordingly. These values then disaggregated according to those attributable to state land (protected areas), communal land and commercial land. This was done using areas estimated using a dot counting technique and modified subjectively according to the knowledge regarding the distribution of resources and land uses.
Aggregate values were thus described according to the three integrated regions subdi-vided between state, communal and commercial lands. The extents of these different tenure types in the country were estimated, as shown in Table 1, and values were then expressed per square kilometre within each land tenure category, again divided between the three integrated regions.
Next, using the results from the sensitivity analysis of land use enterprise models, the impact of likely climate change on carrying capacities for livestock and wildlife and on tourist visitor numbers, as described in the analysis above, was assessed. Again, the measure of economic value is the direct contribution of land and resources to the GNI. The impact is assessed in terms of how much of the baseline direct GNI values, as measured above, will change by 2080 as a result of the climate change predictions. It is noteworthy that this analysis was done by superimposing the 2080 setting after climate change on current land use. It does not take into consideration autonomous adapta-tions that are expected to happen, or adaptaadapta-tions resulting from policy intervenadapta-tions, or changes in population growth, which will happen between the present and 2080.
The challenge was to convert the predicted changes in physical livestock, wildlife and tourist numbers, referred to above, into changes in GNI contribution. For this, we used detailed spreadsheet enterprise models for livestock, tourism and natural resource use activities. These empirically based budget and cost-benefit models measure, among other things, the annual direct contribution to GNI. With the use of sensitivity analysis, the impacts of changes on carrying capacity, tourism numbers and output on GNI con-tribution can be measured. Specifically, the models on land use developed in this study were used. The latter study used enterprise models for 11 different land uses, examin-ing communal and commercial land livestock systems and non-consumptive tourism systems. Results of the sensitivities on these models are shown in Additional file 1.
Results
Climate change predictions
similar level and spatial pattern of warming is consistent and that a comparable reduction in rainfall is projected. In the present study, we have used the findings of GF Midgley and D Gou (unpublished work) as the basis for our model projections.
The models used (IPCC TAR and AR4) are extremely complex global models which require very large numbers of runs to develop predictions. At the scale of southern Africa, they are thus coarse, and it is difficult to get the spatial downscaling needed to make accurate predictions at country level in Namibia. Nevertheless, averages of 21 IPCC AR4 models show a consistent trend to higher temperatures, with an increase in annual mean temperature between 3°C and 4°C expected by 2080. Regarding precipita-tion, the picture is less certain with the averages for 21 IPCC AR4 models showing decreases in mean annual rainfall between 5% and 20% by 2080. The most significant declines can be expected in the south and centre of the country. This is consistent with the continent-wide finding that it is the southwestern arid zone of southern Africa that will be likely to suffer high declines in rainfall compared to the wetter parts, to the east of Namibia. However, the dominant feature of the predicted changes, particularly as regards precipitation, is an increase in variability.
The effects of higher temperature will result in higher evaporation, and this, com-bined with expected lower rainfall, would cause significant reductions in rangeland car-rying capacity. In the analysis on impacts on ecosystems and biodiversity, GF Midgley and D Gou (unpublished work) suggest a reduction in ground cover and reduced net primary productivity throughout much of the country by 2080. They estimated changes in grass biomass ranging from around−10% in the Woodland of the northeast, around
−5% in the Savanna and around−10% in the southern Karoo areas. They estimated that primary productivity overall might have no change in the Woodland and might drop by some 5% in the Savanna and Karoo biomes. These indicated changes, by 2080, have been used in the interpretation of carrying capacity changes below.
It must be acknowledged that increased concentrations of CO2may result in a
fertil-isation effect as predicted by the dynamic global vegetation model described by Scheiter and Higgins (2009). This modelling approach uses climate and soils information to pre-dict the changing relative success of a few main plant functional types. The model has a strong physiological basis, including calculations of carbon uptake via photosynthesis (dependent on light, water, temperature and nutrient availability), respiration and growth, carbon allocation to above and below ground parts, decomposition and wild-fire. The model has been shown to simulate African savanna and grassland vegetation structure and function to a credible degree (Scheiter and Higgins 2009). As with all glo-bal climate change models, there are difficulties with the spatial downscaling to make clear predictions for Namibia, but the results indicate small expansion of the grass bio-mass conditions prevailing in the south into the central areas of the country by 2080. In the north central and northeast, they indicate possible increases in grass biomass. They also suggest a decrease in woody plants less than 2 m tall in most of the central and northern parts. For woody plants more than 2 m tall, little change or possibly an increase is suggested for the central and northern areas.
It is uncertain whether CO2 fertilisation will increase plant biomass. This effect, if
been estimated by Turpie et al. (2010) that these changes would likely be accompanied by losses in both grazer and browser carrying capacities of between 13% and 15%.
Surface water flows are predicted to decline by up to 15% in the Orange river system to the south and 10% in western ephemeral rivers. There is less certainty about flows in the north and northeast flowing out of Angola, but some predictions suggest de-cline, which will also affect the wetlands associated with these systems. Combined with significantly increasing demand, the pressure on Namibia's surface water resources will be dramatic.
Financial and economic analysis of land use enterprises
Tables 5, 6 and 7 show the base case financial and economic characteristics of the live-stock and tourism enterprises modelled. Generally, traditional small-scale cattle keep-ing, as practised in the Woodland and Savanna biomes, is shown to make efficient use of capital and to provide significant income for participating households. However, these returns tend to be dependent on the maintenance of reasonable levels of herd
Table 5 Financial and economic values associated with livestock systems and tourism
wildlife viewing enterprises–Woodland biome (N$, 2008, where N$1.00 = US$0.13)
Traditional Cattle post Commercial Tourism
Financial data
Initial capital 99,381 1,064,782 3,259,660 11,825,946
At stability
Gross turnover 35,225 380,143 937,506 15,076,056
Financial costs variable 8,050 241,301 418,605 7,701,617
Financial costs fixed 10,677 81,713 424,152 3,089,850
Entrepreneur net cash income 16,498 57,129 94,749 4,284,590
Community income 23,518 27,000 62,370 626,400
Overall return
Financial IRR (10 years) 19.99% 7.79% 7.09% 35.05%
Financial NPV (10 years at 10%) 48,792 (19,245) (570,856) 17,509,309
Wage bill 7,020 27,000 62,370 1,144,800
Economic data
Initial capital 86,756 958,603 2,979,933 10,814,706
Gross output 29,372 432,123 814,223 16,335,133
Economic costs 19,549 263,867 608,497 9,368,723
Incremental contribution to GNI 9,823 168,256 205,726 6,966,410
Incremental contribution to NNI 7,963 145,309 69,992 6,292,706
Economic IRR (10 years) 23.94% 11.53% 7.49% 70.29%
Economic NPV (10 years) at 10%) 56,184 99,006 (409,815) 34,391,437
Number of jobs 1.3 4 5 28
Incremental contribution to GNI per hectare 54.57 26.29 20.57 483.78
Incremental contribution to NNI per hectare 44.24 22.70 7.00 436.99
Community income per hectare 130.66 4.22 6.24 43.50
Entrepreneur net cash income per hectare 91.66 8.93 9.47 297.54
Initial economic capital per hectare 481.98 149.78 297.99 751.02
Economic gross output per hectare 163.18 67.52 81.42 1,134.38
productivity. Open access to grazing, which commonly prevails with this system, has the effect of driving down herd productivity and the net economic contribution (Barnes et al. 2008). The diversity of products lends stability to the system. In the Karoo biome, traditional small-scale small stock keeping, represents a small commercial operation. Here, diversity of products is low, and the system suffers from diseconomies of scale coupled with typically low incomes earned from open access grazing. Improvement of flock productivity while keeping capital inputs low would considerably enhance the value of this system.
Commercial cattle ranching, mainly in the commercial land of the Woodland and Savanna biomes, and commercial small stock ranching in the Karoo biome all represent relatively capital intensive systems, with fencing and water provision being important assets. They depend on gains in productivity resulting from relatively intensive infrastruc-ture and management inputs, and their net returns are sensitive to cost increases. Cattle post systems are less intensive with lower capital requirements and less dependence on Table 6 Financial and economic values associated with proposed livestock systems and tourism wildlife enterprises - Savanna biome (N$, 2008, where N$1.00 = US$0.13)
Traditional Cattle post Commercial Tourism
Financial data
Initial capital 87,345 1,019,233 3,316,252 34,902,460
At stability
Gross turnover 29,237 374,960 828,721 46,051,817
Variable financial costs 7,802 223,486 361,592 35,102,546
Fixed financial costs 10,017 80,864 425,608 7,434,437
Entrepreneur net income 10017 70,610 41,521 3,514,834
Community income 18,438 97,610 62,370 1,487,160
Overall return
Financial IRR (10 years) 15.49% 8.30% 6.59% 21.02%
Financial NPV (10 years at 10%) 24,733 (135,447) (637,192) 15,202,591
Wage bill 7,020 27,000 103,950 3,287,160
Economic data
Initial capital 75,501 894,863 3,068,388 30,307,333
Gross output 24,893 426,422 673,377 41,877,101
Economic costs 19,136 256,154 584,119 31,476,663
Incremental contribution to GNI 5,757 170,268 89,258 10,400,439
Incremental contribution to NNI 4,536 147,025 (47,474) 9,577,954
Economic IRR (10 years) 19.76% 10.86% 6.81% 63.09%
Economic NPV (10 years at 10%) 35,386 56,443 (501,139) 55,517,848
Number of jobs 1.3 4 7 135
Incremental contribution to GNI per hectare 31.99 24.05 8.93 385.20
Incremental contribution to NNI per hectare 25.20 20.42 (4.75) 354.74
Community income per hectare 102.43 8.12 6.24 55.08
Entrepreneur net cash income per hectare 63.43 7.03 4.15 130.18
Initial economic capital per hectare 419.45 140.25 306.84 1,122.49
Economic gross output per hectare 138.30 66.63 67.34 1,551.00
proximity to markets, and they benefit from only moderate gains in productivity that resulted from their partial exclusivity.
Additional file 1 shows the results of sensitivity analyses on the models aimed at examining the direct effects on net incomes, particularly GNI contributions, of the car-rying capacity changes expected by 2080.
As described above, the likely general effects of climate change in Namibia will be higher temperatures and likely lower mean annual rainfall. These will combine to in-crease evapotranspiration and reduce rainfall effectiveness. This should reduce primary productivity, but this reduction may be offset to some extent by CO2fertilisation. To
go with these changes, there is strong evidence that there will be greater variability in climate and thus in ecological systems, which are already highly variable.
The land uses described above will be affected by reductions in rangeland carrying capacities. Before systems adapt, there will likely be effects of livestock production parameters such as reduced calving rates and higher mortalities. The sensitivities for these parameters are thus highly significant. Lower production in the face of increasing Table 7 Financial and economic values associated with proposed livestock systems and tourism wildlife viewing enterprises–Karoo biome (N$, 2008, where N$1.00 = US$0.13)
Traditional Commercial Tourism
Financial data
Initial capital 139,384 7,481,255 6,527,865
At stability
Gross turnover 25,208 1,972,255 6,627,604
Financial costs variable 13,775 612,625 12,130,743
Financial costs fixed 8,095 1,102,375 9,056,362
Entrepreneur net income 3,338 257,255 5,440,499
Community income 6,578 219,024 2,577,744
Overall return
Financial IRR (10 years) 5.42% 13.42% 19.81%
Financial NPV (10 years at 10%) (29,844) 1,129,712 17,984,661
Wage bill 3,240 453,024 3,981,744
Economic data
Initial capital 119,933 7,386,407 30,350,760
Gross output 29,647 2,144,615 25,504,896
Economic costs 23,149 1,650,267 15,994,383
Incremental contribution to GNI 6,498 494,348 9,510,514
Incremental contribution to NNI 3,857 308,247 8,268,390
Economic IRR (10 years) 18.48% 27.24% 40.03%
Economic NPV (10 years at 10%) 42,544 4,190,185 44,289,321
Number of jobs 0.60 29 153
Incremental contribution to GNI per hectare 2.79 9.47 109.32
Incremental contribution to NNI per hectare 1.66 5.91 95.04
Community income per hectare 2.82 4.20 29.63
Entrepreneur net cash income per hectare 1.43 4.93 62.53
Initial economic capital per hectare 51.47 141.50 348.86
Economic gross output per hectare 12.72 41.08 293.16
demand for products may tend to increase meat prices, particularly locally in Namibia. The lower production per unit of land will also tend to increase capital costs relative to production capacity. It is noteworthy that these initial analyses disregard the fact that, by 2080, some 70 years into the future, there may be gradual adaptation to change, through the emergence of more extensive systems and lower production per hectare. Such adaptation is discussed below.
A study of the likely impact of climate change on the gross incomes of landholders prac-tising livestock production and trophy hunting in the commercial land was carried out by Brown (2009). She used regression analysis on questionnaire returns for a sample of 60 commercial farmers to get farmer perceptions on how their incomes would be affected in the face of climate change scenarios, similar to those identified in this study. For fenced commercial livestock production, it was estimated that gross incomes would decline to some 40% of current levels by 2080, and trophy hunting gross incomes would decline by more. Trophy hunting is more profitable, as an enterprise, than livestock ranching, and a drop in gross income means less in terms of a drop in net returns for trophy hunting than is the case with livestock. For the purposes of the sensitivity analyses on livestock systems, changes in gross output along these lines were examined.
As little is known of the likely impacts of climate change on tourism, the results of a specific survey among tourists using protected areas, described by Turpie et al. (2010), were used to predict the expected impacts of climate change on tourism visitation num-bers. A demand function, derived by Turpie et al. (2010) from their protected area tourism survey data, indicated that, nationwide, the numbers of tourist visits will be likely to drop to some 85% of the current numbers by 2080, as a result of climate change. A 15% loss in gross output was examined in the sensitivity analyses for tourism enterprises.
Some interesting findings emerge from the sensitivity analyses. The possible effect of increased meat product prices will tend to be offset by increased capital costs in all the livestock systems analysed. In all biomes, losses of 40% of gross incomes will make fenced commercial ranching nonviable both financially and economically. With cattle posts in the Woodland and Savanna biomes, the effect will not be as severe, but finan-cial and economical viability will be reduced significantly. In the case of traditional live-stock keeping, the effects of climate change on financial and economic viability will be least. This underlines the inherent efficiency of these systems, which is only negated by the problem of open access grazing, which, as expected from theory and as shown by Barnes et al. (2008), can drive down productivity. The viability of traditional small-scale livestock keeping in the Karoo biome is, on the other hand, relatively sensitive to cli-mate change effects, reflecting the nature of this system, which tends to resemble small-scale commercial ranching.
Baseline aggregate economic values of land and natural resource use
The estimated direct economic contributions in terms of value added to the national income by agricultural land use and natural resource uses in Namibia are documented in Table 8. Table 9 shows these values expressed per square kilometre.
In terms of tourism, wildlife and natural resource uses, some N$3.8 billion (US$ 490 million) was generated in 2009. This is dominated by two main components - tourism (47%) and natural plant use (44%). Currently, 70% of tourism value is generated in the commercial land, where property rights have allowed a rapid expansion of nature- and wildlife-based land uses. There remains significant potential for tourism development within parks and communal areas. Some 79% of natural plant use takes place in the communal areas, mostly in the north central part of the country (North West broad integrated region) where almost all rural households make use of wood and other nat-ural products of plant origin. There is only localised overuse of these resources, and overall, they are relatively abundant, making for high value added and rent generation, despite the fact that use of the resources is effectively open access in nature.
It can be seen that agricultural production land uses generated some N$3.23 billion (US$ 420 million) in terms of gross national income value added to national income. Some 77% of this is attributable to livestock. Commercial land contributes some 74% to total agricultural land use production value and 79% of livestock production value.
Expected changes in aggregate economic value
The findings above combined with the findings of Turpie et al. (2010) were used to predict losses in livestock and wildlife numbers in Namibia, resulting from climate change. Reduced carrying capacity and shifts in land suitability mean that large stock numbers will be particularly hard hit by climate change. The analysis indicates that, na-tionwide, numbers of cattle in fenced ranches can be expected to decrease to as low as 40% of the current levels by 2080. Numbers of communal livestock (small-scale and cattle post systems) can be expected to decrease to as low as 70% of the current num-bers by 2080. Small stock, mostly in commercial areas, will tend to expand to the north, and numbers of small stock can be expected to remain around 100% of the present numbers.
Table 8 Estimated direct gross national income contributed by agricultural production and natural resource uses in 2009
Sector and tenure GNI contribution (N$'000, where N$1.00 = US$13)
Agriculture
Livestock
State land
-Communal land 521,000
Commercial land 1,965,000
Total 2,486,000
Crops
State land
-Communal land 317,000
Commercial land 431,000
Total 748,000
Total agriculture
State land
-Communal land 837,000
Commercial land 2,397,000
Total agriculture 3,234,000
Natural resources
Tourism
State land 433,000
Communal land 101,000
Commercial land 1,266,000
Total 1,800,000
Wildlife (other)
State land 72,000
Communal land 15,000
Commercial land 140,000
Total 226,000
Wild plants
State land
-Communal land 1,334,000
Commercial land 352,000
Total 1,686,000
Fish (inland)
State land
-Communal land 95,000
Commercial land
-Total 95,000
Total natural resources
State land 505,000
Communal land 1,545,000
Commercial land 1,758,000
Table 9 Estimated direct gross national income contributed per square kilometre by agricultural production and natural resource uses in 2009
Sector and tenure GNI contribution (N$/km2, where N$1.00 = US$0.13)
Agriculture
Livestock
State land
-Communal land 15.04
Commercial land 55.47
Total 30.17
Crops
State land
-Communal land 9.16
Commercial land 12.18
Total 9.08
Total agriculture
State land
-Communal land 24.20
Commercial land 67.64
Total agriculture 39.25
Natural resources
Tourism
State land 35.06
Communal land 2.92
Commercial land 35.72
Total 21.85
Wildlife (other)
State land 5.79
Communal land 0.44
Commercial land 3.95
Total 2.75
Wild plants
State land
-Communal land 38.54
Commercial land 9.94
Total 20.46
Fish (inland)
State land
-Communal land 2.75
Commercial land
-Total 1.15
Total natural resources
State land 40.86
Communal land 44.64
Commercial land 49.61
Dryland crop production is expected to decline significantly by 2080 with production being restricted to Caprivi in the north alone, and that will be on the very margins of viability. Thus, it can be assumed that dryland crop gross output will decline to some 25% of the current levels. Irrigated production will attain more importance, and indeed, it is currently part of an ambitious expansion programme. However, increasing demand for decreasing surface flows particularly in Orange and Fish river systems in the south central broad integrated region will constrain development. These southern irrigation schemes are most viable, and expansion related to the Kavango, Zambezi and Kunene river systems in the northeast and northwest broad integrated regions will tend to be constrained by financial and economic viability problems. It is therefore assumed that despite increasing demand for irrigation development, the value added to GNI by irri-gated agriculture will not grow but will remain at 100% of the current levels by 2080.
Before any consideration of adaptation, conditions expected to prevail by 2080 as a result of climate change may result in losses in the direct economic contribution of primary land uses amounting to N$2.5 billion or some 4% of the GNI. The losses are clearly highest with the agricultural sector. It is noteworthy that the estimated losses do not include indirect impacts on the economy that resulted from backward and for-ward linkages.
Discussion, conclusions and interventions
The predicted losses in tourism and livestock income described above will result from gradual change in climate over the next 70 years. This means that, on average, tourism value might decline at 0.4% per annum, and livestock income might decline at 1% per annum over that period. Land use systems will adapt autonomously at the same time, and extraneous economic factors will play an important part. Given autonomous adap-tation, losses in production will tend to be reflected in loss of growth that would take place in the absence of climate change.
In Table 10, it can be seen that losses are clearly highest with the livestock sector and, in particular, with commercial fenced ranching. This is a result of the fragile finan-cial and economic viability of this system, where a small drop in income results in a devastating loss in net income. Table 11 shows these losses per square kilometre.
From an economic perspective, pastoralism and wildlife-based tourism, combined at landscape scale and involving common property management, can be sound invest-ments across Namibia's communal lands. Furthermore, as climate changes, the existing economic benefits to the Namibian economy associated with pastoralism and wildlife-based tourism will likely be magnified, as capital-intensive commercial fenced ranching systems become less economic. The inherent flexibility of small-scale livestock keeping, if it can be combined with enhanced community rangeland management, has signifi-cant potential. Without adaptation, fenced commercial ranching will likely increasingly fail and will tend to be replaced by less capital-intensive herding systems. In terms of long-term adaptation, it suggests that medium- to large-scale livestock farming systems will tend to become lower input in nature, with systems resembling the cattle posts of the communal lands rather than ranches. Cattle over much of the drier savanna areas may tend to be replaced by small stock.
Table 10 Estimated losses in direct gross national income contributed by agricultural production and natural resource uses in 2009
Sector and tenure Losses to GNI (N$'000, where
N$1:00 = US$0.13)
Agriculture
Livestock
State land 0
Communal land 70,000
Commercial land 1,965,000
Total 2,035,000
Crops
State land 0
Communal land 118,000
Commercial land 19,000
Total 137,000
Total agriculture
State land 0
Communal land 188,000
Commercial land 1,985,000
Total 2,172,000
Natural resources
Tourism
State land 65,000
Communal land 15,000
Commercial land 190,000
Total 270,000
Wildlife (other)
State land 18,000
Communal land 4,000
Commercial land 35,000
Total 57,000
Wild plants
State land 0
Communal land 0
Commercial land 0
Total 0
Fish (inland)
State land 0
Communal land 0
Commercial land 0
Total 0
Total natural resources
State land 83,000
Communal land 19,000
Commercial land 225,000
Table 11 Estimated losses in direct gross national income contributed per square kilometre by agricultural production and natural resource uses in 2009
Sector and tenure Losses to GNI (N$/km2^, where
N$1:00 = US$0.13)
Agriculture
Livestock
State land
-Communal land 2.02
Commercial land 55.47
Total 24.70
Crops
State land
-Communal land 3.41
Commercial land 0.55
Total 1.67
Total agriculture
State land
-Communal land 5.43
Commercial land 56.01
Total agriculture 26.36
Natural resources
Tourism
State land 5.26
Communal land 0.44
Commercial land 5.36
Total 3.28
Wildlife (other)
State land 1.45
Communal land 0.11
Commercial land 0.99
Total 0.69
Wild plants
State land
-Communal land
-Commercial land
-Total
-Fish (inland)
State land
-Communal land
-Commercial land
-Total
-Total natural resources
State land 6.71
Communal land 0.55
Commercial land 6.35
respond to economic forces. Active interventions should include shifts in livestock and rangeland policy, encouraging the adoption of more resilient systems, which are less rigid and more able to change and adapt. Recent research and analysis in Namibia (Humavindu et al. 2011) has found that adoption of good rangeland management practices, involving flexible herding, economies of scale and commercially viable utilisation of invasive bush, can significantly enhance private profitability and the economic contribution of livestock production. These inherent incentives are constrained by the fact that sound management requires significant skill. Policy as espoused in the new national rangeland management policy (MAWF 2012) recognises this and contains measures to enhance the necessary skills and promote good rangeland management. The community-based rangeland man-agement initiative currently being promoted by the Millennium Challenge Corporation is showing signs of success and is relevant here.
Rainfed cropping, already marginal in terms of viability, will likely become nonviable and will be almost eliminated. Current national policy is ambitious regarding irrigation development, and this drive will likely be strengthened by losses in rainfed cropping. However, expansion of irrigation will likely be curtailed by increasing scarcity of water, particularly in the south, and problems with financial and economic viability, particu-larly in the north (Turpie et al. 2010). Active intervention should be focused on expan-sion of irrigation, based on sound development planning, to ensure the development is environmentally and economically efficient.
One example of adaptation already taking place is that, for largely economic reasons, wildlife stocks are currently in the process of increasing, and in certain parts of the country, they are displacing livestock herds. The climate-induced losses in demand for tourism will tend to be offset by natural growth in overall international demand for tourism and the potential for expansion of tourism in underutilised areas, particularly in state-protected areas and communal land. Climate-induced losses in grazing wildlife numbers should be offset to some extent by increases in wildlife on understocked land as well as the taking up of unused capacity for wildlife use in state-protected areas and communal lands. Wild plant use is generally well under the national potential for use of these resources (Barnes et al. 2010), and it is generally likely to increase as other live-lihood options through agriculture are curtailed.
Table 10 indicates that income from natural resource use will be more resilient in the face of climate change. This is to be expected, given the generally lower reliance of these activities on primary production and rangeland carrying capacity. It suggests that adaptation to climate change should include strong promotion of natural resource-based land uses. This is something that is already taking place, as a result of economic forces and financial incentives. The CBNRM programme has been very successful in in-tegrating and mainstreaming natural resource use in communal land use (NACSO 2004, 2006, 2008). It has been shown to be economically viable (Barnes 2008), has economies of scale and facilitates integrating land uses in a flexible manner under com-mon property management. The commercial land conservancy programme has also introduced economies of scale and spatial flexibility to land use there.
biodiversity are conserved. It should also be carefully planned to maximise its impact on rural livelihoods.
At a national level, implementation of the NRMP will promote improved management of national rangelands, which has been shown to be economically efficient. Humavindu et al. (2011),show the benefits of ‘pincer movement’focused on fewer national level sub-sidies coupled with both direct incentives to allow stocking and destocking and open ac-cess to all markets, and indirect incentives focused on community mobilisation and institution building in communal areas. Together, these measures harbour the potential to deliver economic benefits of rangeland management at the landscape and community levels at the same time as climate-proofing natural resource land use.
Additional file
Additional file 1:Appendix 1.Woodlands biome - commercial livestock.
Competing interests
We declare that the authors have no competing interests.
Authors’contributions
JIB conducted research, developed models, conducted analysis, and contributed to first drafting of the manuscript. JM coordinated and supervised the work and drafted the final manuscript. MA conducted research, updated models, conducted analysis and drafted the initial manuscript. All authors read and approved the final manuscript.
Author details
1Design & Development Services cc, PO Box 25942, Windhoek, Namibia.2Department of Economics, Gothenburg University, Gothenburg, Sweden.3Independent consultant, PO Box 350, Riebeek-Kasteel 7307Western Cape, South Africa.
Received: 11 June 2012 Accepted: 28 August 2012 Published: 28 September 2012
References
Alberts, M. 2007.Financial management analysis of park tourism in Namibia. MBA Thesis. Durban, South Africa: Department of Business Studies, Management College of Southern Africa.
Barnes, J.I. 2008. Community-based tourism and natural resource management in Namibia: local and national economic impacts. InResponsible tourism: critical issues for conservation and development, ed. A. Spenceley, 343–357. London: Earthscan.
Barnes, J., and B. Jones. 2009. Game ranching in Namibia. InEvolution and innovation in wildlife conservation: from parks and game ranches to transfrontier conservation areas, ed. H. Suich, B. Child, and A. Spenceley, 113–126. London: Earthscan.
Barnes, J.I., J. MacGregor, and L.C. Weaver. 2002. Economic efficiency and incentives for change within Namibia's community wildlife use initiatives.World Dev30(4): 667–681.
Barnes, J.I., O. Nhuleipo, P.I. Muteyauli, and J. MacGregor. 2005.Preliminary economic asset and flow accounts for forest resources in Namibia. DEA Research Discussion Paper No 70, Directorate of Environmental Affairs. Windhoek, Namibia: Ministry of Environment and Tourism.
Barnes, J.I., J. Cannon, and J. MacGregor. 2008. Livestock production economics on communal land in Botswana: effects of tenure, scale and subsidies.Development Southern Africa25(3): 327–345.
Barnes, J.I., O. Nhuleipo, A.C. Baker, P.I. Muteyauli, and V. Shigwedha. 2009.Wildlife resource accounts for Namibia, 2004. DEA Research Discussion Paper No 79, Directorate of Environmental Affairs. Windhoek Namibia: Ministry of Environment and Tourism.
Barnes, J.I., J. MacGregor, O. Nhuleipo, and P.I. Muteyauli. 2010. The value of Namibia's forest resources: preliminary economic asset and flow accounts.Development Southern Africa27(2): 159–176.
Brown, L.H. 2009.The effects of climate change on revenues to commercial agriculture and tourism enterprises in Namibia. York, UK: MSc Environmental Economics Thesis, University of York.
Humavindu, M., J. Barnes, C. Nott, N. de Klerk, and B. Kruger. 2011.Economic valuation of good rangeland management and incentives for efficient implementation for the National Rangeland Strategy. Report to the GEF. Namibia: Ministry of Environment and Tourism.
IPPR [Institute for Public Policy Research]. 2009.National accounts 1990–2006 data base. http://www.ippr.org.na (accessed November 2009).
Massyn, P.J., E. Humphrey, D. Grossmann, and J. Barnes. 2008.Tourism scoping report: Kunene People's Park. Directorate of Parks and Wildlife Management. Windhoek, Namibia: Ministry of Environment and Tourism.
Mendelsohn, J., S. el Obeid, N. de Klerk, and P. Vigne. 2006.Farming systems in Namibia. Windhoek, Namibia: Namibia National Farmers Union (NNFU).
Midgley, G.F., G.O. Hughes, W. Thuiller, G. Drew, and W. Foden. 2005.Assessment of potential climate change impacts on Namibia's floristic diversity, ecosystem structure and function. Namibian National Biodiversity Programme. Windhoek, Namibia: Directorate of Environmental Affairs.
NACSO. 2004.Namibia's communal conservancies: a review of progress and challenges. Windhoek, Namibia: Namibian Association of CBNRM Support Organisations.
NACSO. 2006.Namibia's communal conservancies: a review of progress and challenges in 2005. Windhoek, Namibia: Namibian Association of CBNRM Support Organisations.
NACSO. 2008.Namibia's communal conservancies: a review of progress and challenges in 2007. Windhoek, Namibia: Namibian Association of CBNRM Support Organisations (NACSO).
NTB. 2008.Namibia Tourism Satellite Account -, 2nd ed. Windhoek, Namibia: Namibia Tourism Board.
Reid, H., L. Sahlén, J. Stage, and J. MacGregor. 2007.The economic impact of climate change in Namibia: how climate change will affect the contribution of Namibia's natural resources to its economy. London: Environmental Economics Programme Discussion Paper 07–02. International Institute for Environment and Development (IIED).
Scheiter, S., and S.I. Higgins. 2009. Impacts of climate change on the vegetation of Africa: an adaptive dynamic vegetation modelling approach.Glob Chang Biol15: 2224–2246.
Sherbourne, R. 2009.Guide to the Namibian economy 2009. Windhoek, Namibia: Institute for Public Policy Research (IPPR). SIAPAC. 2007.Study on characteristics of demand of tourists and use patterns of protected areas in Namibia. Windhoek,
Namibia: Ministry of Environment and Tourism.
Turpie, J., G. Midgley, C. Brown, J. Barnes, J. Pallett, P. Desmet, J. Tarr, and P. Tarr. 2010.Climate change vulnerability and adaptation assessment for Namibia's biodiversity and protected area system. Strengthening the Protected Area Network (SPAN) Project.Windhoek, Namibia: Ministry of Environment and Tourism.
WTTC. 2006.Namibia: the impact of travel and tourism on jobs and the economy.Windhoek, Namibia: Namibia Tourism Board and Ministry of Environment and Tourism.
doi:10.1186/2041-7136-2-22
Cite this article as:Barneset al.:Expected climate change impacts on land and natural resource use in Namibia: exploring economically efficient responses.Pastoralism: Research, Policy and Practice20122:22.
Submit your manuscript to a
journal and benefi t from:
7Convenient online submission
7Rigorous peer review
7Immediate publication on acceptance
7Open access: articles freely available online
7High visibility within the fi eld
7Retaining the copyright to your article