A Monthly Double-Blind Peer Reviewed (Refereed/Juried) Open Access International e-Journal - Included in the International Serial Directories
Indexed & Listed at:
Ulrich's Periodicals Directory ©, ProQuest, U.S.A., EBSCO Publishing, U.S.A., Cabell’s Directories of Publishing Opportunities, U.S.A., Google Scholar, Open J-Gage, India [link of the same is duly available at Inflibnet of University Grants Commission (U.G.C.)],
Index Copernicus Publishers Panel, Poland with IC Value of 5.09 & number of libraries all around the world.
VOLUME NO. 6 (2016), ISSUE NO. 11 (NOVEMBER) ISSN2231-5756
CONTENTS
Sr.
No.
TITLE & NAME OF THE AUTHOR (S)
Page
No.
1.
PREPARATION AND ANALYSIS OF VALUE ADDED STATEMENT OF VISAKHAPATNAM PORT TRUST
ARUNA POLISETTY & SHEELA.P
1
2.
A STUDY ON CONSUMER PREFERENCE TOWARDS SAKTHI MILK WITH SPECIAL REFERENCE TO
COIMBATORE CITY
M. DEVARAJAN & S. KIRTHIKA
8
3.
EMPOWERING HEALTH SECTOR THROUGH DIGITAL INDIA INITIATIVES
CHINNASAMY. V
10
4.
COACHING: TRY FEEDFORWARD INSTEAD FEEDBACK FOR LEADERSHIP PERFORMANCE
C. NIKHILA REDDY, JYOTI ADHIKARI & DR. RAVINDER KAUR
14
5.
ROLE OF LOGISTICS IN BUILDING CUSTOMER SATISFACTION
DR. S. SUDHA
17
6.
INFORMATION TECHNOLOGY ENABLED SERVICES IN PROMOTING SERVICES MARKETING
GUDDATI ARCHANA
20
7.
INTEGRATED MARKETING COMMUNICATION IN HEALTHCARE & BRAND BUILDING
K. SRIKANTH & DR. SAPNA SINGH
22
8.
A REVIEW OF LITERATURE ON EMOTIONAL STABILITY AND WORK LIFE BALANCE OF EMPLOYEES OF
TEXTILE INDUSTRY IN MADHYA PRADESH
NEHA SOMANI & DR. SANDEEP MALU
26
9.
A STUDY ON CUSTOMER SATISFACTION ON INTERNET BANKING SERVICES: AN EVALUATION
DR. J. RAMOLA PREMALATHA & V. BHARATHKUMAR
29
10.
THE ROLE OF FOREIGN DIRECT INVESTMENT IN THE IRAQI ECONOMY
HIKMAT SALMAN KHUDHAIR
33
11.
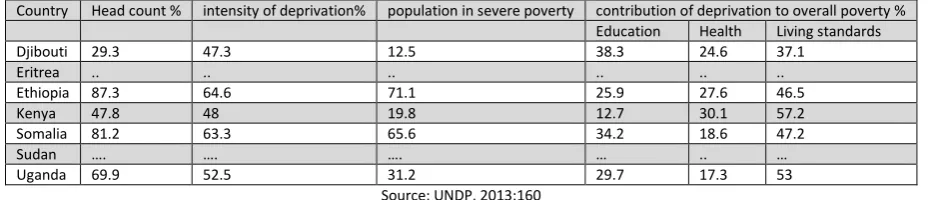
FOOD SECURITY IN IGAD COUNTRIES: UNFINISHED AGENDA OR UNATTAINABLE GOAL?
MELAKE TEWOLDE
39
12.
CASH CONVERSION CYCLE AND FIRM PROFITABILITY IN CEMENT MANUFACTURING SECTOR IN
TELANGANA STATE-INDIA
P LAKSHMI NARASA REDDY
47
13.
THEORIES AND PRACTICES OF CORPORATE GOVERNANCE
SREEJA NAIR
50
14.
PROBLEMS ASSOCIATED WITH STUDENTS’ PERSISTENCE IN BUSINESS APPRENTICESHIP TRAINING
CENTRES (BATCs): IMPLICATIONS FOR VOCATIONAL TRADE DEVELOPMENT IN KADUNA STATE,
NIGERIA
IBRAHIM SHITTU KAILANI
53
15.
THE CAUSES OF PRIMARY AGRICULTURAL CREDIT SOCIETIES’ OVERDUES IN ANDHRA PRADESH: A
STUDY OF WEST GODAVARI DISTRICT
DR. K. SUDHAKARA RAO
63
16.
U-COMMERCE OPPORTUNITIES & CHALLENGES
SREEJA.E.S
68
17.
ORGANIZATION AND MANAGEMENT OF OLD AGE HOMES IN INDIA, WITH SPECIAL REFERENCE TO
MYSURU CITY IN KARNATAKA
DIVYA M & VIDYA D AVADHANI
71
18.
A STUDY ON CONSUMER’S PERCEPTION ON MOBILE BANKING IN INDIA
AMALKUMAR.P
76
19.
A CASE STUDY REGARDING NOT USING CREDIT CARD BY PEOPLE OF TINSUKIA DISTRICT
DR. NARENDRA KUMAR
79
CHIEF PATRON
PROF. K. K. AGGARWAL
Chairman, Malaviya National Institute of Technology, Jaipur
(An institute of National Importance & fully funded by Ministry of Human Resource Development, Government of India)
Chancellor, K. R. Mangalam University, Gurgaon
Chancellor, Lingaya’s University, Faridabad
Founder Vice-Chancellor (1998-2008), Guru Gobind Singh Indraprastha University, Delhi
Ex. Pro Vice-Chancellor, Guru Jambheshwar University, Hisar
FOUNDER PATRON
LATE SH. RAM BHAJAN AGGARWAL
Former State Minister for Home & Tourism, Government of Haryana
Former Vice-President, Dadri Education Society, Charkhi Dadri
Former President, Chinar Syntex Ltd. (Textile Mills), Bhiwani
FORMER CO-ORDINATOR
DR. S. GARG
Faculty, Shree Ram Institute of Business & Management, Urjani
ADVISORS
PROF. M. S. SENAM RAJU
Director A. C. D., School of Management Studies, I.G.N.O.U., New Delhi
PROF. M. N. SHARMA
Chairman, M.B.A., Haryana College of Technology & Management, Kaithal
PROF. S. L. MAHANDRU
Principal (Retd.), Maharaja Agrasen College, Jagadhri
EDITOR
PROF. R. K. SHARMA
Professor, Bharti Vidyapeeth University Institute of Management & Research, New Delhi
CO-EDITOR
DR. BHAVET
Faculty, Shree Ram Institute of Engineering & Technology, Urjani
EDITORIAL ADVISORY BOARD
DR. RAJESH MODI
Faculty, Yanbu Industrial College, Kingdom of Saudi Arabia
PROF. SANJIV MITTAL
University School of Management Studies, Guru Gobind Singh I. P. University, Delhi
PROF. ANIL K. SAINI
Chairperson (CRC), Guru Gobind Singh I. P. University, Delhi
DR. SAMBHAVNA
VOLUME NO. 6 (2016), ISSUE NO. 11 (NOVEMBER) ISSN2231-5756
DR. MOHENDER KUMAR GUPTA
Associate Professor, P. J. L. N. Government College, Faridabad
DR. SHIVAKUMAR DEENE
Asst. Professor, Dept. of Commerce, School of Business Studies, Central University of Karnataka, Gulbarga
ASSOCIATE EDITORS
PROF. NAWAB ALI KHAN
Department of Commerce, Aligarh Muslim University, Aligarh, U.P.
PROF. ABHAY BANSAL
Head, Department of I.T., Amity School of Engineering & Technology, Amity University, Noida
PROF. A. SURYANARAYANA
Department of Business Management, Osmania University, Hyderabad
PROF. V. SELVAM
SSL, VIT University, Vellore
DR. PARDEEP AHLAWAT
Associate Professor, Institute of Management Studies & Research, Maharshi Dayanand University, Rohtak
DR. S. TABASSUM SULTANA
Associate Professor, Department of Business Management, Matrusri Institute of P.G. Studies, Hyderabad
SURJEET SINGH
Asst. Professor, Department of Computer Science, G. M. N. (P.G.) College, Ambala Cantt.
FORMER TECHNICAL ADVISOR
AMITA
Faculty, Government M. S., Mohali
FINANCIAL ADVISORS
DICKIN GOYAL
Advocate & Tax Adviser, Panchkula
NEENA
Investment Consultant, Chambaghat, Solan, Himachal Pradesh
LEGAL ADVISORS
JITENDER S. CHAHAL
Advocate, Punjab & Haryana High Court, Chandigarh U.T.
CHANDER BHUSHAN SHARMA
Advocate & Consultant, District Courts, Yamunanagar at Jagadhri
CALL FOR MANUSCRIPTS
We invite unpublished novel, original, empirical and high quality research work pertaining to the recent developments & practices in the areas of Com-puter Science & Applications; Commerce; Business; Finance; Marketing; Human Resource Management; General Management; Banking; Economics; Tourism Administration & Management; Education; Law; Library & Information Science; Defence & Strategic Studies; Electronic Science; Corporate Gov-ernance; Industrial Relations; and emerging paradigms in allied subjects like Accounting; Accounting Information Systems; Accounting Theory & Practice; Auditing; Behavioral Accounting; Behavioral Economics; Corporate Finance; Cost Accounting; Econometrics; Economic Development; Economic History; Financial Institutions & Markets; Financial Services; Fiscal Policy; Government & Non Profit Accounting; Industrial Organization; International Economics & Trade; International Finance; Macro Economics; Micro Economics; Rural Economics; Co-operation; Demography: Development Planning; Development Studies; Applied Economics; Development Economics; Business Economics; Monetary Policy; Public Policy Economics; Real Estate; Regional Economics; Political Science; Continuing Education; Labour Welfare; Philosophy; Psychology; Sociology; Tax Accounting; Advertising & Promotion Management; Management Information Systems (MIS); Business Law; Public Responsibility & Ethics; Communication; Direct Marketing; E-Commerce; Global Business; Health Care Administration; Labour Relations & Human Resource Management; Marketing Research; Marketing Theory & Applications; Non-Profit Or-ganizations; Office Administration/Management; Operations Research/Statistics; Organizational Behavior & Theory; Organizational Development; Pro-duction/Operations; International Relations; Human Rights & Duties; Public Administration; Population Studies; Purchasing/Materials Management; Re-tailing; Sales/Selling; Services; Small Business Entrepreneurship; Strategic Management Policy; Technology/Innovation; Tourism & Hospitality; Transpor-tation Distribution; Algorithms; Artificial Intelligence; Compilers & Translation; Computer Aided Design (CAD); Computer Aided Manufacturing; Computer Graphics; Computer Organization & Architecture; Database Structures & Systems; Discrete Structures; Internet; Management Information Systems; Mod-eling & Simulation; Neural Systems/Neural Networks; Numerical Analysis/Scientific Computing; Object Oriented Programming; Operating Systems; Pro-gramming Languages; Robotics; Symbolic & Formal Logic; Web Design and emerging paradigms in allied subjects.
Anybody can submit the soft copy of unpublished novel; original; empirical and high quality research work/manuscript anytime in M.S. Word format after preparing the same as per our GUIDELINES FOR SUBMISSION; at our email address i.e. [email protected] or online by clicking the link online
submission as given on our website (FOR ONLINE SUBMISSION, CLICK HERE).
GUIDELINES FOR SUBMISSION OF MANUSCRIPT
1. COVERING LETTER FOR SUBMISSION:
DATED: _____________
THE EDITOR
IJRCM
Subject: SUBMISSION OF MANUSCRIPT IN THE AREA OF .
(e.g. Finance/Mkt./HRM/General Mgt./Engineering/Economics/Computer/IT/ Education/Psychology/Law/Math/other, please specify)
DEAR SIR/MADAM
Please find my submission of manuscript titled ‘___________________________________________’ for likely publication in one of your journals.
I hereby affirm that the contents of this manuscript are original. Furthermore, it has neither been published anywhere in any language fully or partly, nor it is under review for publication elsewhere.
I affirm that all the co-authors of this manuscript have seen the submitted version of the manuscript and have agreed to inclusion of their names as co-authors.
Also, if my/our manuscript is accepted, I agree to comply with the formalities as given on the website of the journal. The Journal has discretion to publish our contribution in any of its journals.
NAME OF CORRESPONDING AUTHOR : Designation/Post* : Institution/College/University with full address & Pin Code : Residential address with Pin Code : Mobile Number (s) with country ISD code : Is WhatsApp or Viber active on your above noted Mobile Number (Yes/No) : Landline Number (s) with country ISD code :
E-mail Address :
Alternate E-mail Address :
Nationality :
* i.e. Alumnus (Male Alumni), Alumna (Female Alumni), Student, Research Scholar (M. Phil), Research Scholar (Ph. D.), JRF, Research Assistant, Assistant Lecturer, Lecturer, Senior Lecturer, Junior Assistant Professor, Assistant Professor, Senior Assistant Professor, Co-ordinator, Reader, Associate Profes-sor, ProfesProfes-sor, Head, Vice-Principal, Dy. Director, Principal, Director, Dean, President, Vice Chancellor, Industry Designation etc. The qualification of
VOLUME NO. 6 (2016), ISSUE NO. 11 (NOVEMBER) ISSN2231-5756
NOTES:
a) The whole manuscript has to be in ONE MS WORD FILE only, which will start from the covering letter, inside the manuscript. pdf.
version is liable to be rejected without any consideration.
b) The sender is required to mention the following in the SUBJECT COLUMN of the mail:
New Manuscript for Review in the area of (e.g. Finance/Marketing/HRM/General Mgt./Engineering/Economics/Computer/IT/
Education/Psychology/Law/Math/other, please specify)
c) There is no need to give any text in the body of the mail, except the cases where the author wishes to give any specific message w.r.t. to the manuscript.
d) The total size of the file containing the manuscript is expected to be below 1000 KB.
e) Only the Abstract will not be considered for review and the author is required to submit the complete manuscript in the first instance.
f) The journal gives acknowledgement w.r.t. the receipt of every email within twenty-four hours and in case of non-receipt of
acknowledgment from the journal, w.r.t. the submission of the manuscript, within two days of its submission, the corresponding author is required to demand for the same by sending a separate mail to the journal.
g) The author (s) name or details should not appear anywhere on the body of the manuscript, except on the covering letter and the cover page of the manuscript, in the manner as mentioned in the guidelines.
2. MANUSCRIPT TITLE: The title of the paper should be typed in bold letters, centeredand fully capitalised.
3. AUTHOR NAME (S) & AFFILIATIONS: Author (s) name, designation, affiliation (s), address, mobile/landline number (s), and email/al-ternate email address should be given underneath the title.
4. ACKNOWLEDGMENTS: Acknowledgements can be given to reviewers, guides, funding institutions, etc., if any.
5. ABSTRACT: Abstract should be in fully Italic printing, ranging between 150 to 300 words. The abstract must be informative and
eluci-dating the background, aims, methods, results & conclusion in a SINGLE PARA. Abbreviations must be mentioned in full.
6. KEYWORDS: Abstract must be followed by a list of keywords, subject to the maximum of five. These should be arranged in alphabetic
order separated by commas and full stop at the end. All words of the keywords, including the first one should be in small letters, except special words e.g. name of the Countries, abbreviations etc.
7. JEL CODE: Provide the appropriate Journal of Economic Literature Classification System code (s). JEL codes are available at
www.aea-web.org/econlit/jelCodes.php. However, mentioning of JEL Code is not mandatory.
8. MANUSCRIPT: Manuscript must be in BRITISH ENGLISH prepared on a standard A4 size PORTRAIT SETTING PAPER. It should be free
from any errors i.e. grammatical, spelling or punctuation. It must be thoroughly edited at your end.
9. HEADINGS: All the headings must be bold-faced, aligned left and fully capitalised. Leave a blank line before each heading.
10. SUB-HEADINGS: All the sub-headings must be bold-faced, aligned left and fully capitalised.
11. MAIN TEXT:
THE MAIN TEXT SHOULD FOLLOW THE FOLLOWING SEQUENCE:
INTRODUCTION REVIEW OF LITERATURE
NEED/IMPORTANCE OF THE STUDY STATEMENT OF THE PROBLEM OBJECTIVES
HYPOTHESIS (ES)
RESEARCH METHODOLOGY RESULTS & DISCUSSION FINDINGS
RECOMMENDATIONS/SUGGESTIONS CONCLUSIONS
LIMITATIONS
12. FIGURES & TABLES: These should be simple, crystal CLEAR, centered, separately numbered & self-explained, and the titles must be above the table/figure. Sources of data should be mentioned below the table/figure. It should be ensured that the tables/figures are
referred to from the main text.
13. EQUATIONS/FORMULAE: These should be consecutively numbered in parenthesis, left aligned with equation/formulae number placed
at the right. The equation editor provided with standard versions of Microsoft Word may be utilised. If any other equation editor is utilised, author must confirm that these equations may be viewed and edited in versions of Microsoft Office that does not have the editor.
14. ACRONYMS: These should not be used in the abstract. The use of acronyms is elsewhere is acceptable. Acronyms should be defined
on its first use in each section e.g. Reserve Bank of India (RBI). Acronyms should be redefined on first use in subsequent sections. 15. REFERENCES: The list of all references should be alphabetically arranged. The author (s) should mention only the actually utilised
references in the preparation of manuscript and they may follow Harvard Style of Referencing. Also check to ensure that everything
that you are including in the reference section is duly cited in the paper. The author (s) are supposed to follow the references as per
the following:
All works cited in the text (including sources for tables and figures) should be listed alphabetically. Use (ed.) for one editor, and (ed.s) for multiple editors.
When listing two or more works by one author, use --- (20xx), such as after Kohl (1997), use --- (2001), etc., in chronologically ascending order.
Indicate (opening and closing) page numbers for articles in journals and for chapters in books.
The title of books and journals should be in italic printing. Double quotation marks are used for titles of journal articles, book chapters, dissertations, reports, working papers, unpublished material, etc.
For titles in a language other than English, provide an English translation in parenthesis.
Headers, footers, endnotes and footnotes should not be used in the document. However, you can mention short notes to elucidate
some specific point, which may be placed in number orders before the references.
PLEASE USE THE FOLLOWING FOR STYLE AND PUNCTUATION IN REFERENCES: BOOKS
Bowersox, Donald J., Closs, David J., (1996), "Logistical Management." Tata McGraw, Hill, New Delhi. Hunker, H.L. and A.J. Wright (1963), "Factors of Industrial Location in Ohio" Ohio State University, Nigeria.
CONTRIBUTIONS TO BOOKS
Sharma T., Kwatra, G. (2008) Effectiveness of Social Advertising: A Study of Selected Campaigns, Corporate Social Responsibility, Edited by David Crowther & Nicholas Capaldi, Ashgate Research Companion to Corporate Social Responsibility, Chapter 15, pp 287-303.
JOURNAL AND OTHER ARTICLES
Schemenner, R.W., Huber, J.C. and Cook, R.L. (1987), "Geographic Differences and the Location of New Manufacturing Facilities," Jour-nal of Urban Economics, Vol. 21, No. 1, pp. 83-104.
CONFERENCE PAPERS
Garg, Sambhav (2011): "Business Ethics" Paper presented at the Annual International Conference for the All India Management Asso-ciation, New Delhi, India, 19–23
UNPUBLISHED DISSERTATIONS
Kumar S. (2011): "Customer Value: A Comparative Study of Rural and Urban Customers," Thesis, Kurukshetra University, Kurukshetra.
ONLINE RESOURCES
Always indicate the date that the source was accessed, as online resources are frequently updated or removed.
WEBSITES
VOLUME NO. 6 (2016), ISSUE NO. 11 (NOVEMBER) ISSN2231-5756
PREPARATION AND ANALYSIS OF VALUE ADDED STATEMENT OF VISAKHAPATNAM PORT TRUST
ARUNA POLISETTY
ASST. PROFESSOR
KLUBS
K L UNIVERSITY
VADDESWARAM
SHEELA.P
PRINCIPAL
GITAM INSTITUTE OF MANAGEMENT
GITAM
ABSTRACT
In India, over the past there are several changes that had occurred in the presentation of corporate reporting, in terms of presentation of its financial reports. Presentation of ‘Value Added Statement’ along with the common financial reports has become a common practice. The research indicates that social accounting theories can best be used to motivate the organizations in the publication of the value added statement. ‘Value Added Statement’ shows the wealth created and its allocation to the key productive resources and it provides a mode of understanding the responsibility of different stakeholders of an organization in creating and maintaining ‘Value Addition’. Presentation of Value Added Statement, as well with the regular financial statements will assist the management in making economic decisions, used as a performance indicator. it is also used to increase the accurate and fair examination of their financial position during a specific period. This fact is to include the value added statement in a separate social reporting. The value added statement might provide an informative advantage with limited marginal costs because the performance report can be disclosed with figures already recognized in the income statement.
KEYWORDS
social reporting, value added statement.
INTRODUCTION
n organisation, which operates in a society, affects the socio and economic welfare of the entire community. Organizational activities are very conscious, in satisfying the needs of their stakeholders. Value Added is a concept, which helps to appraise the performance of an organization in terms of wealth created for a specific period by the combined efforts of the organization’s stake holders, i.e. employees/human resources, creditors/ providers of capital, government. Each stakeholder contributes to the generation of value added and at the same time gets a proportionate share in value added.
R. R. Gillchrist (1970), North American Census of Production was a place where the value added concept was used initially in the year 1790. W.W. Suojanen was the first person, who used the value added concept in terms of accounting, under his research work on “Accounting theory and the large corporation- An Account-ant’s role”, value added is a concept of income measurement, with the help of income statement and balance sheet. Value Added Statement is used to report the results to various interested parties W.W. Suojanen (1954).
According to ICAI (1985) Value added is the improvement in market value brought about by an alteration in the form, location or availability of a product or service excluding the cost of bought-in-materials and services, this can be expressed in the following equation:
Value added = Value after alteration – Value before alteration.
The word value added may be defined as the value of sales less the bought-in-goods and services expenditure used in producing that sales value J.L. Brown & L.R.Howard (1992)
According to C.J. Van Staden (2000) Value added is the value created by the activities of an organization and its employees, i.e., sales revenue less the cost of bought in goods and services, the calculation of value added and its application among the stakeholders of the organization was done with the help of Value Added Statement (VAS) reports. VAS reports presents the information in a more theoretical, logical and understandable way.
INTRODUCTION TO VALUE ADDED STATEMENT (VAS)
Value Added Statement functioned as a part of workers participation orientation towards the management’s economic performance of an organization in the United Kingdom. S.Burchell, C. Clubb & A.G. Hopwood (1985)
According to The Corporate Report, Value Added Statement represents how the value or worth created or generated by an entity is shared or distributed among different stakeholders. Thus, the concept of Value Added Statement represents a shift in a new route for financial reporting ASSC (1975)
Value Added Statement is a statement, which shows the size of ‘value added cake’ and how the ‘cake’ has been divided amongst the various stakeholders J.Sizer (1979)
Value Added Statement (VAS) reveals the value added by an organization with which, it has been able to produce and its allocation among those contributing to its generation known as stakeholders ICAI (1985)
Value Added Statement (VAS) is in fact designed as a supplementary to the financial reports, as a new dimension to the existing corporate financial accounting system and which is reporting through the disclosure of additional information regarding the amount of wealth created by an organization for a financial accounting period P.M.Rao (1999)
The official acknowledgment of the Value Added Statement (VAS) was primarily made in a discussion, article entitled “The Corporate Report” which was published by the Accounting Standards Steering Committee of the UK in 1975 A.K.Basu (1992)
Value Added Statement (VAS) is defined as the performance of an organization during a specific period of time, and to what extent the organization has added value to its capital providers, who have contributed towards the generation of value added R.S.Agarwal (1993)
A business venture especially a company is conscious, purposeful in its creation for satisfying the requirements of the society at large, as it is a sovereign and a separate legal entity. The joint efforts of the stakeholders namely- employees, government, shareholders, creditors, plays vital role for survival and growth of an organization as well as wealth created by the organization. All these stakeholders are the parties to whom the result of operations of business is communicated P.M.Rao (2001)
REASONS FOR THE PUBLICATION OF THE VALUE ADDED STATEMENT
According to M.F.Morley (1978) Profit-based reporting is likely to be more subjective in nature ; on the other hand, product-based reports are more objective in nature. Preparation of Value added statement puts the profit in a different way and focuses attention on the success of an organization, in creating and increasing its wealth. Which is used in computing the national income. There is an ease of understanding and creating a greater awareness to the general public in knowing the role of an organization and society at a large by their capacity in the production of goods and services.
According to M.F.Morley (1978) for the Employees or the workforce, the value added statement is very much useful since the draw backs of the conventional reporting of Profit and Loss accounting.
The income statement, apart from being more complex than a value added statement, is not of particular relevance to the employees. The optimize value added is more meaningful than optimize profit because added value determiners reward for employees as well as providers of organizational capital C.J.Van Staden & Q.Vorster (1998)
R.Gray et.al(1996) Value Added Statement, is much more useful in improving the morale and the attitudes of the employees towards their services to the organi-zation, who gave them employment. Human behavioural patterns are very complex and changes according to the situation and moreover, influenced by several factors. Simply presenting the Value Added Statement as a supplementary statement, does not guide human attitude and behavior.
ASSUMPTIONS IN PREPARATION OF VALUE ADDED STATEMENT
According N.Mandal & S.Goswami (2008) assumptions be made to compute the value added during the preparation of Value Added Statement (VAS) 1. Value Added Statement is not a replacement but a supplement to the regular Profit and Loss Account.
2. The preparation of Value Added Statement is based on the data presented in the traditional accounting system.
3. The Principles, concepts and conventions of traditional accounting system remains the same, in the preparation of Value Added Statement
4. It is easy to prepare the Value Added Statement from the traditional profit and loss account, but in practical, there is huge difference between these state-ments. Only because profit and loss account contains only non-value added items, but in case of Value Added Statement preparation only value added items will be considered.
CALCULATION AND CLASSIFICATION OF VALUE ADDED
Value Added may be classified into two categories: Gross Value Added (GVA) which refers to sales plus income from other services less bought in materials and services purchased from outsiders; and
Net Value Added (NVA), which refers to the difference between GVA and Depreciation. In other words, NVA is the sum of the value added to employees, to providers of loan capital, to Government and to owners. C.J.Van Staden(1999b)
1. Bernard Cox suggested the following two methods for computing Gross Value Added (GVA) B.Cox (1979) i) Additive method: under this method gross value added is computed by using the n
following equation –
GVA= PBT+ EC + D + I ……….(1)
Where, PBT= Profit Before Taxes, D = Depreciation EC = Employee Cost and I = Interest
ii) Subtracting method: under this method Gross Value Added (GVA) is calculated by using the following equation:
GVA= S + IS – CBGS ……… (2) Where, S = Sales
IS = Income from Services
CBGS = Cost of Bought–in-goods and services
2. According N.Mandal & S. Goswami (2008) Studneski Paul suggested following two methods for calculating Net Value Added: i) Income Distribution Method: In this method Net Value Added (NVA) is determined
by the following equation:
NVA= VAW+ VAG + VAF + VAE ……….. (3)
Where, VAW = Value added to workers/employees, VAG = Value added to Government, VAF = Value Added to Financer, VAE = Value Added to Entity.
ii) Net output method: under this Net Value Added is determined by the following equation NVA= GVA– D
= (S+IS) – CBGS – D ……… (4)
where, S = Sales, IS = Income from other services, CBGS = Cost of bought-in-goods ad services and D = Depreciation. 3. Accounting Standard Steering Committee (ASSC) suggests a formula for computing Value Added (VA), which is as follows: VA= a – b = c + d + e + f ………(5)
Where, VA= Value Added, a = Turnover, b = Bought-in-materials and services, c = employees wages and other benefits, d = Dividend and Interest payable, e = Tax payable and f = Retained profit.
THE IMPORTANT ELEMENTS OF VALUE-ADDED ANALYSIS
According to S.Aravanan (2005), the important elements of value added analysis are as follows:
Value added is a concept, which is based on a self-sustaining economic activity;
Value added uses basis of remuneration to staff;
Value added is used as a basis for financing the budget;
VOLUME NO. 6 (2016), ISSUE NO. 11 (NOVEMBER) ISSN2231-5756
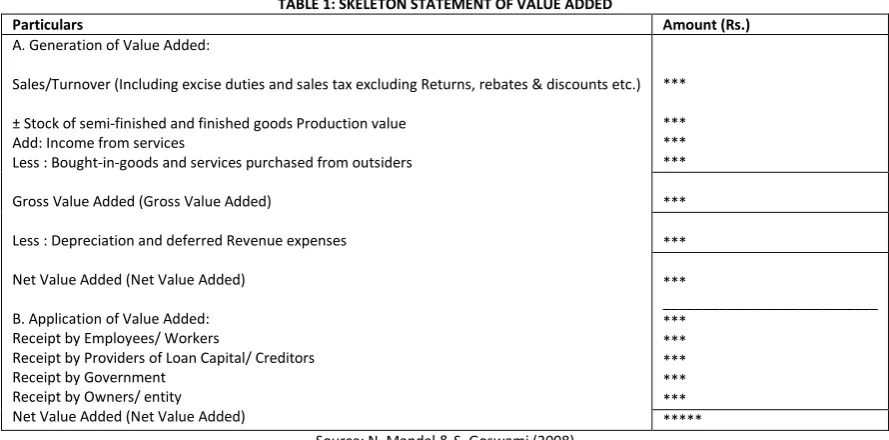
TABLE 1: SKELETON STATEMENT OF VALUE ADDED
Particulars Amount (Rs.)
A. Generation of Value Added:
Sales/Turnover (Including excise duties and sales tax excluding Returns, rebates & discounts etc.)
± Stock of semi-finished and finished goods Production value Add: Income from services
Less : Bought-in-goods and services purchased from outsiders
Gross Value Added (Gross Value Added)
Less : Depreciation and deferred Revenue expenses
Net Value Added (Net Value Added)
B. Application of Value Added: Receipt by Employees/ Workers
Receipt by Providers of Loan Capital/ Creditors Receipt by Government
Receipt by Owners/ entity Net Value Added (Net Value Added)
***
*** *** ***
***
***
***
___________________________ ***
*** *** *** *** ***** Source: N. Mandal & S. Goswami (2008)
USES OF VALUE ADDED STATEMENTS
In order to evaluate the performance of an organization or a corporate sector, the value added reporting is a new method which can be beneficial in many ways to the same. In India value added concept is still in infant stage, but even companies have started introducing the concept of value added in their books of accounts as an important tool. Inclusion of value added concept in organizations is useful not only for the internal users but also for the external users. According to K. C. Nandi (2005), there are many benefits of using value added concept; a few benefits of using value added in an organization are as follows:
1. Value Added Statement provides a better system of describing the performance of business undertakings in terms of capital productivity and labour produc-tivity. Labour productivity can be used to measure in terms of value added per employee in order to help in wage settlement and the capital productivity can be measured in terms of value added per rupee of capital employed to find out the effective utilization of capital employed in the business S.Evraert & A. Riahi-Belkaoui (1998)
2. From a Nation’s point of view, the preparation of Value Added Statement is most important, the contribution made by respective organization, towards the overall value added or wealth created of that particular nation S.J.Gray & K.T. Maunder (1980)
3. As explained in the above uses of value added concept, an organization can survive without earning profits, but cannot survive without adding value. The optimized profit is less important than the optimized added value of an organization. This value added is reward for employees and as well as the creditors (providers of capital) of an organization. Therefore, Value Added Statement is very much useful for the company to introduce “productivity incentive schemes based on value added” M.F.Morley(1978)
4. With introduction of value added, it can be observed in terms of team spirit in the organizational environment K.C.Nandi (2005) 5. At present, tax authorities are also using value added statements of respective organizations in making decisions P.M.Rao (2001)
IMPORTANCE OF HUMAN RESOURCES UNDER VALUE ADDED STATEMENT
In literature, Human Resources are often treated as the user group, who uses financial information that should get the most use from the value added statement. (For example M.F.Morley (1978), C.J.Van Staden (2000) To encourage employee group organizations should present value added statements in their financial statement IAS1 (1997) Gray et al. (1995) describes the VAS as an allegedly employee-related development. D.S.Joubert(1991) some surveys are conducted among organizations, who publish value added statement, and found that these statements are mainly used for employee communication and wage negotiations. Human Resources and their representative groups are interested in information about the stability and profitability of their employer. They are also interested in information which enables them to assess the ability of the enterprise to provide remuneration, retirement benefits and employment opportunities D.E.Purdy (1981). During wage negotiations they are interested in information that demonstrates the employer's ability to afford higher wages. Many companies also publish an employee report internally. The aim of the employee report is to meet the needs of the Human Resources and as such it should be accessible to them in terms of the language used and the financial information given. Value added statements are often included in the employee report. It was established that the employee reports of individual companies are also available to the unions representing the company's Human Resources P.Karpik & A. Belkaoui (1990)
LIMITATIONS OF VALUE ADDED STATEMENTS
There are a few draw backs according to Chitta ranjan sarkar &Kartik Chandra Nandi (2011) with the value added reporting system
1. One of the important limitations of Value Added Statement is that, if the value added statements presents along with the organizational annual reports, it may lead to overload information to various parties and may lead to confusion. An ordinary employee of an organization cannot understand the organiza-tional annual reports and the value added statements, and how these two can be matched. Similarly, a non accountant employee or a shareholder reading the annual report of his company, may get confused by observing a fall in the value added and increase in profits and as well as if he would observe and confused, why the value added is rising while earnings are falling, N.Mandal & S.Goswami (2008)
2. Even though, profit is a part of value added, the maximization of value added does not necessarily lead to maximization of profit. A business organization can maximize its value added by introducing a number of inefficient policies (which cannot lead to increase in profit) but it cannot maximize profits in the similar way R.S.Agarwal (1993)
3. Value Added Statements can be used as a supplementary account to general financial statements. Value added statements does not have place in conven-tional financial statements. Value added statements are not published in a standard format. Sometimes in the calculation of value added statements, it takes in to consideration of the historical values, and therefore, it may lead to confusion, and misleads the user of the users P.M.Rao (2001)
4. The inclusion of Value Added Statement in the Annual Report of an organization, incurred extra cost and time. So it may create delay in publishing annual reports.
The accounting procedure of Value Added reporting divides the statement into two parts (1) Generation of Value Added
(2) Application of Value Added A.K.Basu (1992)
Generation of Value Added
The generation of value added may be regarded as the Revenue generated from Sales which referred to as Sales Revenue (SR) plus Income from other Services (IS) over the cost of bought-in-goods & services (CBGS) from outsiders. It may be shown in equation form
VA = (SR + IS) – CBGS) G.Sinha (1983)
Sales Revenue (SR): Sales Value of Visakhapatnam port trust comes from Cargo Handling & Storage, Port & Dock Facilities, Railway Working and Rentable lands &
Buildings. Sales revenue means net sales value minus sales returns, rebates, trade discount, commission and brokerage etc. but excise duty and sale tax are included because excise duty and sales tax are to be recovered from customers. Major portion, nearly 60% of sales revenue for Visakhapatnam Port Trust comes from Cargo Handling, storage and Port & Dock facilities.
Income from other services (IS): It represents the services rendered by the organization, which consists of interest on Government securities, interest on long term
fixed deposits, dividend from subsidiary company, rent, compensation, royalty, interest, interest on revenue account, miscellaneous income, sundry receipts, profit on disposal of capital assets, cent age charges, sale of tender documents, stores adjustments, items relates to the previous year.
Bought-in-goods or materials and services(CBGS) : Bought –in-goods include consumption of stores on spare parts, consumption of raw materials, repairs to plant
and machinery and buildings and civil structures, general stores, electric power, damages and deficiencies payable railways, hire charges for floating crafts, hire charges for vehicles, safety, freight and handling charges, security charges, dredging charges etc., whereas bought in services includes repairs and maintenance, power and fuel, bank commission, insurance charges, advertising and publicity, postage, telephone & telegram, printing & stationery, audit fees, rent & rates, travelling expenses, legal charges, carriage outwards, entertainment expenses etc.
Application of Value Added
The application of value added is the summation of the amount distributed to the stakeholders of the organization i.e.
i) Application towards Employees or Workers (RE/ RW): Remuneration to Employees (RE) or Remuneration to Workers (RW) includes the amounts of salaries and
wages, payment of bonus, contribution to provident fund, ESI and other benefits, staff welfare expenses, payment of gratuity, director’s remuneration etc.,
ii) Application towards Providers of Capital Loan Interest (RCP): Remuneration to Capital Providers (RCP) includes the parties from whom the firm borrows money
in the form of debentures or in the form of equity share capital and preference share capital. Interest is being paid to debenture holders while dividends are paid to shareholders. Interest is paid before the taxes levied on profits, whereas, dividends are paid after levied taxes paid to respective government.
iii) Application towards Government (RG): Remuneration to government (RG) includes the amount of excise duty, customs duty, local taxes, sales tax, octroi duty,
rates and taxes, other direct taxes (e.g. income tax, wealth tax) etc. In some cases, amount of export incentives, subsidies received, refund of any duty or taxes like duty draw backs, excess of provision of taxes are granted by the government and are deducted from Government’s share.
iv) Application towards Owners (RIB): Remuneration to owners of the organization is also referred to as Amount Re-invested In the Business (RIB); it includes the
amount transferred to various types of reserves, statutory or non-statutory including retention, and depreciation. It can be understood by the following Value Added Statement.
Finally, from the above explanation it can be understood that the Value Added is the summation of the four groups, and it can be written as VA= (RE+RG+RCP+RIB)
Depreciation
In respect to depreciation the following three alternative treatments are possible:
1. To show it in the application of value added under the head either 'retained profit' or 'growth and expansion'; 2. To include it under the Bought-in-services and ascertaining directly the net value added;
3. Reducing from the gross value added separately.
In the present study depreciation is treated by using the 3rd alternative treatments mentioned above i.e. reduction of depreciation value from gross value added
separately.
TABLE 2: VALUE ADDED STATEMENT OF VISAKHAPATNAM PORT TRUST FOR THE PERIOD 2002-2003 TO 2011-2012 (Rs. In Crores) Particulars 2002 -03 2003 -04 2004 -05 2005 -06 2006 -07 2007 -08 2008 -09 2009 -10 2010 -11 2011 -12
Generation of value added
Sales Revenue 427.56 454.28 501.87 528.45 533.74 564.42 599.72 660.80 738.64 726.42
Total Sales value indices 100 6.25 17.38 23.59 24.83 32.24 40.26 54.55 72.75 469.89
Other income 14.04 11.12 14.64 14.43 20.92 25.48 51.14 56.86 77.66 450.91
Gross output 441.60 465.40 516.51 542.88 554.66 590.90 650.86 717.66 816.30 1177.33
(-) Bought in materials and Services: Materials used (stores)
Repairs
Power and fuel lubricants Dredging
Other operational expenses General expenses 25.47 11.28 17.72 9.28 25.72 10.18 13.77 18.90 27.70 7.31 19.46 9.90 13.59 19.26 32.27 6.90 82.99 12.00 21.77 18.22 35.05 6.95 25.14 9.56 14.57 21.77 34.12 1.47 21.67 12.86 14.75 24.01 38.64 8.40 23.42 12.96 19.90 31.09 41.36 2.86 35.28 16.21 28.65 39.06 37.00 34.39 156.38 14.32 18.67 35.68 46.46 34.11 134.44 10.81 18.12 31.07 50.59 34.52 155.85 17.02
Gross Value Added 341.92 368.33 349.46 426.17 448.18 467.23 504.16 407.84 536.05 758.08
Gross Value Added Indices 100 7.72 2.21 24.64 31.07 36.64 56.54 2.65 34.07 154.48
Depreciation charged 25.72 26.86 28.37 31.24 30.99 32.42 31.74 00.00 00.00 00.00
Net Value Added 316.62 341.47 321.08 394.93 417.18 434.80 472.42 407.84 536.05 758.08
Net Value Added Indices 100 2.08 1.87 25.35 32.41 38.00 59.96 11.40 45.49 161.58
Distribution of Net Value Added
To workers/Human Resources (Staff Cost) 235.66 (74.42) 223.11 (65.33) 288.89 (89.97) 210.67 (53.34) 205.83 (49.33) 298.18 (68.57) 279.74 (59.21) 375.01 (91.95) 388.08 (72.39) 667.33 (88.02) To providers of capital loan interest 6.66
(2.08) 1.35 (0.39) 1.22 (0.37) 1.07 (0.27) 1.33 (0.32) 0.68 (0.15) 1.83 (0.39) 0.93 (0.23) 0.75 (0.14) 0.45 (0.059)
To Government (Tax) 13.44
(4.24) 32.27 (9.45) 19.90 (6.19) 20.97 (5.31) 86.85 (20.81) 22.38 (5.15) 95.97 (20.31) 26.50 (6.49) 29.34 (5.47) 29.01 (3.82) To owners (Div.+ Retained earnings) 65.05
VOLUME NO. 6 (2016), ISSUE NO. 11 (NOVEMBER) ISSN2231-5756
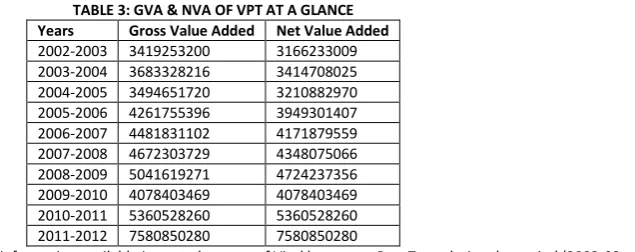
TABLE 3: GVA & NVA OF VPT AT A GLANCE Years Gross Value Added Net Value Added
2002-2003 3419253200 3166233009 2003-2004 3683328216 3414708025 2004-2005 3494651720 3210882970 2005-2006 4261755396 3949301407 2006-2007 4481831102 4171879559 2007-2008 4672303729 4348075066 2008-2009 5041619271 4724237356 2009-2010 4078403469 4078403469 2010-2011 5360528260 5360528260 2011-2012 7580850280 7580850280
Source: Data are compiled on the basis of information available in annual reports of Visakhapatnam Port Trust during the period (2002-03 to 2011-12)
ANALYSIS
Value added statements is very much useful to judge the performance and productivity of an organization both in public and private sector organizations in managerial decision making, as of now the usage of Value added Statement is still at the infancy stage in the arena of financial management. The main reason behind this fact is very difficult to unseat any age old idea deeply entrenched not only in practice but also in allied usages and also in legal set up. That is why, in spite of some obvious limitations the traditional financial statements are still in use.
Table shows Gross Value Added and Net Value Added figures of Visakhaptnam Port Trust, it is found that both Gross Value Added and Net Value Added figures has been on an increasing trend over the study period except in the years 2004—2005 and 2009-2010. The distribution of Net Value Added is also clearly shown in the table over the period of ten years. The Gross Value Added and Net Value Added indices (taking 100 in the year 2002-2003 as base) reveal a continuous increasing trend (except in 2004-2005 and in 2009-2010) in Visakhaptnam Port Trust.
In absolute term, Gross Value Added(GVA) and Net Value Added (NVA) of Visakhaptnam Port Trust in the year 2002-2003 was Rs. 341.92 crores and Rs. 316.62 crores whereas in 2011-2012 the GVA and NVA was Rs.758.08 and Rs.758.08 crores. This increase in the value added (both Gross Value Added and Net Value Added) was mainly due to the increase in the value of services over the years. Value added indices also show that in 2011-2012 the Gross Value Added and Net Value Added have increased to about 154.48 and 161.58 from the base year 2002-2003 (taken as 100). The value of services (sales revenue) is noted to be on an increasing trend during the study period of 10 years, except in the year 2011-2012, even though the gross output was high in this year due to greater increase in other income from finance and other miscellaneous services the gross output is continuously on an increasing trend, noticeable increase in gross output is identi-fied in the year 2011-2012. It is also observed from the above table no. 5.2; Visakhapatnam Port Trust has not charged depreciation to their assets for the last three years of the study period i.e. 2009-2012.
While examining the distribution of Net Value Added, it was noticed that Visakhapatnam Port Trust had made greater contribution of its value towards Human Resources of the organization. It is evident from the above table no 4.3 in the study period. More than 50% of net value added is shared to Human Resources of Visakhapatnam Port Trust during the study period, except in the year 2006-2007 where 49.33% of the net value added was only distributed. The highest distribution of net value added with the Human Resources is identified in the year 2009-2010 of 91.95% total share. The second important stake holder to whom the net value added was distributed was to the owners ie, the organization, was in increasing trend during the study period, it is observed to be very high in the year 2005-2006 with 41.07 %. The third stake holder who received the third highest net value added is the Government; it is observed throughout the study that a noticeable share was distributed to government in the years 2006-2007 and 2008-2009 with 20.81% and 20.31% share respectively. The last stakeholder who received the fourth highest share of the net valued added was the creditors (providers of capital), and it was observed the share distributed was very negligible.
CONCLUSION
Based on the above analysis it may be concluded that the generation of value addition made by Visakhapatnam Port Trust has been increasing continuously with slight fluctuation during the study period only due to sales revenue and operational efficiency. So far as the disposal of value added is concerned it was found that the payment to the Human Resources has been increased significantly that indicates social contribution by the company. Retained earnings and depreciation was sufficient over the study period. On the basis of above interpretation, it can be concluded that the management of Visakhapatnam Port Trust has contributed to the society about 71.25% of total value added was distributed among the Human Resources. Government, financial institutions, banker share stands as 7.53% and the remaining 21.21% of the total value added is re-invested in the form of retained earnings and that is an appropriate amount of investment for the development, growth and expansion of the business. The analysis clearly signifies that the management of the company has not only improved its profitability but has also fulfilled its responsibility towards the society at large and emphasised that human capital was given utmost importance for their contribution towards the success performance of organization.
The result of the study highlights the fact that all the contributors of Value Addition have significant impact on the profits of the company. However, major share contributor’s i.e. human resources have huge impact on the profits of the Visakhapatnam Port Trust, and followed by the retained earnings. It indicates that greater ‘Value Addition’ can be possible by plough back of retained earnings. Comparatively Share of ‘debt capital contributors’ has insignificant impact on the profits of the company.
TABLE 4: VALUE ADDED RATIOS FOR MEASURING PERFORMANCE AND JUDGING PRODUCTIVITY OF VPT
PARTICULARS SET OF RATIOS
2002
-03
2003
-04
2004
-05
2005
-06
2006
-07
2007
-08
2008
-09
2009
-10
2010
-11
2011
-12
ANALYSIS ON VALUE ADDED RATIOS
The computed ratios are shown in above table no 4.4 depicts the information about the computed ratios of Visakhapatnam Port Trust for the period under study (i.e. from 2002-2003 to 2011-2012).
1. Value added to Net Worth Ratio indicates the amount of wealth (i.e. value added) Created per rupee of Net Worth. Greater the Ratio, higher will be the safety to the providers of capital. Value added to Net Worth ratio of the company has more or less an increasing trend over the period under study, a proportionate decrease observed in the years 2010-2011 and 2011-2012. In spite of the decrease, it indicates a good sign for the contributors as regard the safety of their funds.
2. Value added to Capital Employed Ratio reflects the efficiency of capital utilization in generating the quantum of value added. The main purpose of computing this ratio is to find out how much value is added per unit of capital investment. This ratio is recognized as more significant than traditional ratio of 'Net Profit to Capital Employed' as an index of managerial efficiency. Value added to Capital Employed Ratio of the company has almost had a decreasing trend over the periods of ten years. Though the actual values seen to be in increasing trend but the real value of capital employed has decreased, because of inflation and increasing interest rates etc.,
3. Value added to Sales Ratio reveals the contribution of Company's sales revenue towards the value addition. An effective sales promotion policy would enable a company to enhance the performance of the company in this regard. Value added to Sales Ratio generally describes whether the company has an effective sales promotion policy to enhance the performance. Visakhapatnam Port Trust (VPT) had this ratio in increasing trend; it was observed very high in the year 2009-10 again it was noticed that the ratio had decline trend due rough weather and the ongoing global downturn. A significant decline in overall cargo handling at VPT is on a steep decline in handling of its main commodities -- iron ore and petroleum, oil and lubricants (POL) handling, according to sources. 4. Net Profit to Value added Ratio expresses the owner share in the pool. Higher the ratio, higher will be the concentration of income in few hands and vice-versa. Net Profit to value added ratio of VPT was found very less in the year 2004-05 and immediately for the two consecutive years had increased. Again there was a decline in the year 2007-08 due to increase in operating expenditure, stores expenditure, and Increase in salaries and wages due to normal increase in wage bill, provision made for full years impact of wage revision due from 1-1-2007.
5. Value added to Employee cost Ratio reveals the labour productivity of the enterprise. A high ratio indicates that the enterprise is highly efficient in terms of labour productivity. Value added to employee cost ratio has a proportion of fluctuations over the study period and it was observed to be high in the year 2009-10 due provision made for pension arrears payable consequent on pension revision, by normal increase in wage bill, increase in payments by Rs.712.95 lakhs balance payment for arrears as per 6th pay commission recommendation.
6. Value Added to Total Cost Ratio reveals the expenses incurred by the enterprise for a specified period of time; less the ratio higher the efficiency in terms of cost control. Value Added to total cost ratio, the less the ratio indicates, efficiency of the organization in terms of cost control during the study period, it was observed to be in fluctuating trend, whereas this ratio was observed to be less in the year 2005-06.
7. Value added to Material Cost Ratio focuses the material productivity of the enterprise. Higher the ratio greater will be the efficiency of the enterprise in terms of utilization of materials.
It is observed from the table that the Value added to material cost ratio shows fluctuations over time. It ranges from 0.02 to 0.07 (for GVA to material cost) / from 0.02 to 0.08 (in case of NVA to material cost). The fluctuations of the ratio are also observed over the period under study. This ratio indicates that VPT is highly efficient in terms of utilization of materials. Thus it is clear that the financial ratios using Value Added figure can be regarded as the index of managerial performance and they would be more sensitive to display the vivid picture about the efficiency of management of a firm in a highly complex and competitive business environ-ment.
FINDINGS
i. The distribution towards human resources was high with 71.25% and followed by 21.21% towards entity in the form of reserves and surpluses, which can be used for re-investment in the business.
ii. VPT had very less long term debt from outsiders, it had funds from government with less cost of capital. This can be clearly understood with the help of contribution towards bankers share, financial institutions and government with 7.53%.
iii. In spite of a few decreases was observed in the value added to net worth ratio, it indicates a good sign for the providers of capital as regard the safety of their funds
iv. Value added to sales ratio was observed to be in increasing trend during the study period, in the year 2009-10 was noticed a decline due to global downturn. v. Value added to employee cost ratio was observed to be high during the study period and it shows the labour productivity.
IMPLICATIONS OF THE STUDY TO MANAGERS AND ORGANIZATIONS
The following are the most important implications of our study:1. The performance analysis of the company on the basis of Value Added figure reveals the distributive judgment in respect of all the participants of the company. This is not possible through the performance analysis on the basis of Net Profit figure only.
2. Value Added Statement of the company provides the means to satisfy all the stakeholders and as a result, the analysis creates feelings in the minds of all the participants that the company is able to create wealth for the society and ultimately it favours a strong basis for the society at large.
3. Our analysis also gives us an impression about the future contribution by the business unit towards different stakeholders of the company and also the targeted profit of the company in future.
4. There is a high degree of association between GVA and NVA. Unlike traditional financial ratios, value added ratios are equally important and useful to judge the efficiency and effectiveness of the enterprise as regards sales promotion, utilization of fund, capital productivity, labour productivity, etc.
CONCLUSION
In India, over the past there are several changes that had occurred in the presentation of corporate reporting, in terms of presentation of its financial reports. Presentation of ‘Value Added Statement’ along with the common financial reports has become a common practice. The research indicates that social accounting theories can best be used to motivate the organizations in the publication of the value added statement. ‘Value Added Statement’ shows the wealth created and its allocation to the key productive resources and it provides a mode of understanding the responsibility of different stakeholders of an organization in creating and maintaining ‘Value Addition’.
Presentation of Value Added Statement, as well with the regular financial statements will assist the management in making economic decisions, used as a perfor-mance indicator. it is also used to increase the accurate and fair examination of their financial position during a specific period. This fact is to include the value added statement in a separate social reporting.
The value added statement might provide an informative advantage with limited marginal costs because the performance report can be disclosed with figures already recognized in the income statement.
VOLUME NO. 6 (2016), ISSUE NO. 11 (NOVEMBER) ISSN2231-5756
REFERENCES
1. BGK Murthy, Dr. A. Satish Babu & Dr. B. Nagaraju, ‘A cross sectional study on impact of demographic variables in consumer perception towards mobile value added services: A holistic perceptive’, International Journal of Research In Commerce, IT & Management, Volume No. 5 (2015), Issue No. 9 (September), ISSN
2231-5756, pp. 24-26.
2. K. Nagarajan, ‘Economic Value Added (EVA): A performance measure of strategic finance’, International Journal of Research In Commerce & Management, Volume No. 6 (2015), Issue No. 11 (November), ISSN 0976 - 2183, pp. 89-91.
A STUDY ON CONSUMER PREFERENCE TOWARDS SAKTHI MILK WITH SPECIAL REFERENCE TO
COIMBATORE CITY
M. DEVARAJAN
HEAD
PG & RESEARCH DEPARTMENT OF COMMERCE
HINDUSTHAN COLLEGE OF ARTS & SCIENCE
COIMBATORE
S. KIRTHIKA
RESEARCH SCHOLAR
PG & RESEARCH DEPARTMENT OF COMMERCE
HINDUSTHAN COLLEGE OF ARTS & SCIENCE
COIMBATORE
ABSTRACT
India was the second largest producer of milk after the per capital availability of milk has improved over the year from 107 gm. /day in 1970 to 190 gm. /day in 1994. The recommendation is how ever 220 gm. /day. However, the estimated output will be around two million tones. The country’s milk production in 1994-1995 was 63.5 million tones. The processing and marketing of dairy products because milk is an excellent source of proteins, carbohydrates, calcium phosphates. Vitamins and other important ingredients which are essential for physical and mental have assured market for milk.
KEYWORDS
milk production, dairy products, market, recommendation.
INTRODUCTION
n spite of the fact that the Indian cattle in an inevitable element in the agricultural sector as well as in supplying milk it did not receive due recognition till recent years. Though infrastructural facilities are promoted in a large scale still dairying faces many problems which make the progress of the same. Till recent years dairying was not considered as a business and there was no adoption of sciences and technology in either production (or) distribution today science in applied to every aspect of dairying namely in the areas of better production, procuring, storing and distribution without causing any damage (or) spoilage to the quality of milk.
OBJECTIVES
1. To study the consumer opinion and preference for Sakthi milk. 2. To study the consumer satisfaction towards use of Sakthi milk.
SCOPE OF THE STUDY
The study mainly has elicited views from consumers about price, quality, package, availability, sales promotion and encourages of Sakthi milk and enables to ascertain the respondent’s level regarding the product; the study has been conducted among consumers at different place of Coimbatore city where Sakthi milk is marketed.
METHODOLOGY
The collected data have been categorized and processed manually as well as through computer. The important tools used for analysis are as follows.
Percentage wise analysis
LIMITATIONS OF THE STUDY
The study was limited to in Coimbatore city only.
Due to time and distance constraints an extensive study was not possible.
The researcher found that many of the respondents were busy in their work. So, it was difficult to interact with them further.
REVIEW OF LITERATURE
There is hardly any study available on consumers purchase behavior that deals exclusively with milk products. So in reviewing the literature, interest is focused on studies conducted, in India and abroad, delaying not only with milk products but also on such investigations as offers findings related to milk products.
1. Shiralashetti and Hugar (2007) in his article titled "Consumer Satisfaction with Special Reference to Milk Consumers in Gadag City" points out that more number of unpasteurized milk consumers' satisfaction level is high compared to pasteurized milk consumers towards quality, price and taste whereas it is the reverse towards supply of milk in the study area.
2. Akbay and Tiryaki (2008) in their study entitled "Unpacked and packed fluid milk consumption patterns" suggest that unpacked fluid milk preference is related positively to household size, income and age of the household head, and negatively to education level of the household head and status of the household wife. Similarly, pasteurized and sterilized fluid milk preferences are related positively to income and the education level of the household head, and negatively to household size and age of the household head. Results from these analyses are used to suggest techniques for marketing fluid milk products to specific segments of the consumer population
3. D. Kalaivani (2015) in her study focused to know the problems of milk producers towards supply of milk to Coimbatore district milk product union ltd. The study revealed that for milk union often delayed the payment for milk supplied. They also expressed that all the quality of milk obtained was not purchased by the milk union.
VOLUME NO. 6 (2016), ISSUE NO. 11 (NOVEMBER) ISSN2231-5756
DATA ANALYSIS AND INTERPRETATION
PERCENTAGE WISE ANALYSIS
TABLE 1: AGE WISE GROUP OF THE RESPONDENTS
S. No Particulars Number of respondents Percentage of Respondents
1 15-20 21 19.09
2 20-30 51 46.36
3 30-40 17 15.46
4 ABOVE 40 21 19.09
Total 110 100
The above table shows that out of the total respondents taken for the study 46.36% respondents belongs to the age wise group of 20 to 30, 19.09% of them belong to 15-20 years and above 40 years remaining 15.46% of them belong to 30-40 years old.
Inference
The majority (50%) of the respondents are having age group between 20-30 year of their age category.
TABLE 2: OCCUPATIONAL STATUS OF THE RESPONDENTS
S. No Particular Number of Respondents Percentage of Respondents
1 Business 11 10
2 Government employee 12 10.90
3 Private employee 27 24.55
4 Others 60 54.55
Total 110 100
It is observed from the above table that total respondents taken for the study out of 54.55% of the respondents are others, 24.55% of the respondents are Private Employee, 10.90% of the respondents are Government Employee and 10% of the respondents are Business.
Inference
The above table reveals that among 110 respondents, majority of them are in other (54.55%).
TABLE 3: LEVEL OF SATISFACTION OF SAKTHI MILK
S.no Particular Number of respondents Percentage of Respondents
1 Hygienic 23 21
2 Balanced nutritive value 17 15.4
3 Price 30 27.2
4 Capacity 13 11.8
5 Availability 27 24.5
Total 110 100
It is observed from the above table that total respondents taken for the study out of 24.5% of the respondents are falls under the category of availability, 11.8% of the respondents are falls under capacity, 27.2% of the respondents are falls under price, 15.4% of the respondents are falls under the category of balanced nutritive value and 21% of the respondents are falls under hygienic category.
Inference
Therefore, it is concluded that, the majority of the respondents (i.e., 27.2%) are in the satisfaction level of price.
TABLE 4: HOW MANY PERSONS ARE IN YOUR FAMILY
S. No Particular Number of Respondents Percentage of Respondents
1 2 8 14.04
2 3 12 21.05
3 4 30 52.63
4 5 7 12.28
Total 57 100
The above table reveals that out of 57 number of married respondents, 27.27% of the respondents are having 4 members, 10.91% of the respondents are having 3 members, 6.36% of the respondents are having 5 members and 7.27% of the respondents are having 2 members.
Inference
The table 4.6 indices that out of 110 respondents, the majority of 4 number of persons in family.
SUGGESTIONS
1. Most of the consumers suggested that price and quality are the main factor for purchasing milk. 2. They feel that Sakthi price is high. Steps should be taken to reduce it, society price
3. It should adopt aggressive marketing strategies to expand its market size particularly in rural areas and micro towns.
CONCLUSION
A consumer is not someone to argue or match with the needs and satisfaction level differ from individual to individual and no company can satisfy the needs of consumers. Consumer oriented thinking helps the marketer to define consumer needs from the consumer’s point of view. The present study attempts to bring out the factors leading to the purchase behaviour and perception of consumers in buying Sakthi milk.
REFERENCES
1. Chauhan. A.K., Raj Vir Singh and Raina. B.B. (2014), “A study on the Economics of Milk Processing in a Dairy Plant in Haryana”, Agricultural Economics Research Review, Vol.19, Issue 2, P. 25.
2. Ganesh D., A survey on the consumer satisfaction towards Sakthi milk, 2000. 3. Kalsi (2012), “Let’s All Do It- Market More Milk”, Indian Dairyman, 44(8), pp. 393- 400. 4. Saravanan S “A study on the promotional tools used by branded milks, 2000.
EMPOWERING HEALTH SECTOR THROUGH DIGITAL INDIA INITIATIVES
CHINNASAMY. V
SCIENTIST D
MINISTRY OF ELECTRONICS & INFORMATION TECHNOLOGY (GOVERNMENT OF INDIA)
NEW DELHI
ABSTRACT
Digital India is strengthening the Information and Communication technology (ICT) Infrastructures across India. This is more helpful in extending urban health care services into rural, unreachable and remote parts of India. Health MMP has become more digitally innovative by implementing e-Kranti principles. Mother and Child Tracking System (MCTS), Kilkari & Mobile Academy schemes have exploited USSD and IVRS services to check and combat Infant Mortality Rate (IMR) and Maternal Mortality Rate (MMR) etc across nook and corner of India. The common Services Centre (CSCs) platform has been utilised to extend the telemedicine services along with other services. Web based e-Hospital Application has created innovations in Public Hospital Management eco system.
KEYWORDS
digital India, e-healthcare, common service centers, telemedicine, e-hospital.
INTRODUCTION
ndia has around 70% of the population resides in rural area. Rural India’s economy is still largely agricultural based economy. Hence, prosperous and healthy lives of rural citizens are assets of India economy. Availability of various urban health facilities needs to be extended to the rural citizens with the help of ICT facilities. Every Government hospital serves approximately 61011 people across India. India has a doctor to patient ratio of 1:1700. In this juncture Digital India has taken various measures on utilising the ICT benefits to extend the urban Health services into rural India. Digital India empowers technology and the technology has power to improve access to healthcare services especially for people residing in rural, remote and far-flung areas
Recent developments in the ICT sector are revolutionising health care system by transforming health care administration, in public health care service delivery and management system. In Modern society, Internet is transforming the healthcare industry. Telecommunication networks and internet are best utilised to extend the health care services to the remotest corner of India. Government of India focuses on maximising the use of digital technologies for public wellbeing through Digital India Initiatives. National e-Governance Programme 2.0 (e-Kranti) has brought out various principles such as Mandatory Government Process Reengineering (GPR), Infrastructure on demand, Integrated services, Infusing Transformation, Cloud by default and Mobile first across all Mission Mode Pro-jects(MMPs). Health MMP is one of the projects which are being rejuvenated by NeGP 2.0 Principles.
“e-Health is professional Application of Information and communication technological developments for the welfare of the healthcare of all living organism”. It initiates the healthy interaction between patient and doctor irrespective of distance. The increasing number of tools of ICT provides opportunity for extending efficient healthcare services to Rural India. Under Digital India, various healthcare initiatives have been taken to strengthen the public health care eco system in India. Government of India aims to access Universal health coverage (UHC) by 2022.
1)
NETWORK FOR RURAL e-HEALTH SERVICES
Internet is becoming significant sources of public health initiatives and it provides increasingly accessible communication channels for growing segment of health conscious population. It provides an increasingly accessible communication channels for a growing segment of the population. Internet offers greater interactivity and better tailoring of information to all sectors including health sector. It also provides enough space for preventive care by providing better online clinical information. Robust Network connectivity can take Internet to nook and corner of our country.
Network connectivity is the major component in providing rural e-health services. Connectivity will extend health related activities in rural areas. The rural tele-density is just above 50%. The mobile Network across the country has to be used effectively for delivering services including health related services. Setting up of Network connectivity and its maintenance is a challenging one in the thinly and sparely populated rural areas. In India, almost 75% of the qualified medical professionals are working in urban areas. A robust Network connectivity to rural, inaccessible and difficult terrain would help to extend the services of health professionals to those areas. The connectivity helps the health care eco system to reach out to individuals and it is the back bone of the electronic service delivery mechanisms for any scheme. Digital India has provided various initiatives for strengthening rural networks. The programme altogether focuses on improving network penetration across India and envisages filling up the gaps in connectivity across the country.
a) 2,50,000 village panchayats would be covered under NOFN (National optical Fiber Network). This would be providing High speed connectivity across rural areas. Out of 2,50,000 gram panchayats so far, more than 48,199 connectivity have been established. Health eco system across rural India is envisaged to leverage NoFN high speed bandwidth Connectivity from Block to panchayat level for extending healthcare services.
b) Around more than 2.2 lakh Common Service Centers (CSC) have been established to provide e-services in rural regions to bridge digital divide. The CSC platform is also being used for extending telemedicine services across India.
c) A comprehensive plan has been launched for providing Mobile coverage to all uncovered villages. Hitherto unconnected 55,619 villages in the country will be extended with mobile coverage in a phased manner including connectivity for North eastern areas.
d) DoT has initiated process to install around 4000 tel