AbstrAct
Introduction We compared the predictive value of prebronchodilator and postbronchodilator spirometry for chronic obstructive pulmonary disease (COPD) features and outcomes.
Methods We analysed COPDGene data of 10 192 subjects with smoking history. We created regressions models with the following dependent variables: clinical, functional and radiographic features, and the following independent variables: prebronchodilator airflow obstruction (PREO) and postbronchodilator airflow obstruction (POSTO), prebronchodilator and postbronchodilator FEV1% predicted. We compared the model performance using the Akaike information criterion (AIC).
results The COPD prevalence was higher using PREO. About 8.5% had PREO but no airflow obstruction in postbronchodilator spirometry (POSTN) (PREO-POSTN) and 3% of all subjects had no aiflow obstruction in prebronchodilator spirometry (PREN) but POSTO (PREN-POSTO). We found no difference in COPD features and outcomes between PREO-POSTN and PREN-POSTO subjects. Although, both prebronchodilator and postbronchodilator spirometries are both associated with chronic bronchitis, dyspnoea, exercise capacity and COPD radiographic findings, models that included postbronchodilator spirometric measures performed better than models with prebronchodilator measures to predict these COPD features. The predictive value of prebronchodilator and postbronchodilator spirometries for respiratory exacerbations, change in forced expiratory volume in 1 s, dyspnoea and exercise capacity during a 5-year period is relatively similar, but postbronchodilator spirometric measures are better predictors of mortality based on AIC.
conclusions Postbronchodilator spirometry may be a more accurate predictor of COPD features and outcomes.
IntroductIon
Chronic obstructive pulmonary disease (COPD) diagnosis is based on a spirometric definition according to Global Initiative for Chronic Obstructive Lung Diseases guide-lines.1 This diagnosis requires the presence of airflow obstruction (AFO) defined as forced expiratory volume in 1 s (FEV1)/ forced vital capacity (FVC) below the lower limit of normal (LLN) or 0.7.1 Several studies
have compared FEV1/FVC<LLN with FEV1/ FVC <0.7 as a diagnostic criterion for AFO.2–4 GOLD recommends a postbronchodilator FEV1/FVC <0.7. The rationale is based on its simplicity, independence of reference values and the fact that it is used in numerous clin-ical trials.1 However, to our knowledge, there is little evidence to support the use of postbro-nchodilator spirometry for COPD diagnosis over prebronchodilator spirometry. A single study with 300 subjects showed that postbron-chodilator spirometry is a better predictor of mortality than prebronchodilator spirometry in COPD.5 Mannino et al6 showed that both prebronchodilator and postbronchodilator lung function predict mortality with a similar accuracy.
COPD prevalence is lower when postbron-chodilator spirometry is used compared with when prebronchodilator spirometry is used.7 In the absence of a true ‘gold standard’ for COPD diagnosis, the utility of a diagnostic test depends on whether it can predict outcomes or change disease management. Previous studies showed conflicting results regarding the ability of prebronchodilator and post-bronchodilator spirometry in predicting mortality.5 6 Whether postbronchodilator spirometry is superior to prebronchodilator spirometry to predict outcomes other than To cite: Fortis S, Eberlein M,
Georgopoulos D, et al. Predictive value of prebronchodilator and postbronchodilator spirometry for COPD features and outcomes. BMJ Open Resp Res 2017;4:e000213. doi:10.1136/ bmjresp-2017-000213 Received 11 May 2017 Revised 17 October 2017 Accepted 7 November 2017
1Division of Pulmonary,
Critical Care and Occupational Medicine, University of Iowa Hospitals and Clinics, Iowa City, Iowa, USA
2Medical School, University of
Crete, Heraklion, Greece
3Departments of Pulmonary
Medicine and Intensive Care Medicine, University Hospital of Heraklion, Heraklion, Greece
Correspondence to Dr Spyridon Fortis; spyridon- fortis@ uiowa. edu
Predictive value of prebronchodilator
and postbronchodilator spirometry for
COPD features and outcomes
Spyridon Fortis,1,2 Michael Eberlein,1 Dimitris Georgopoulos,2,3 Alejandro P Comellas1
Key messages
► The chronic obstructive pulmonary disease (COPD) prevalence was higher using prebronchodilator spirometry.
► We found no difference in COPD features and outcomes between subjects with discordance in prebronchodilator and postbronchodilator spirometry.
► Although both prebronchodilator and
postbronchodilator spirometries are associated with COPD features and outcomes, postbronchodilator spirometry may be a more accurate predictor.
by copyright.
on September 18, 2020 by guest. Protected
mortality has not been studied. We hypothesised that prebronchodilator and postbronchodilator spirometries are associated with COPD features and predict outcomes with the same accuracy.
Subjects with significant hyperinflation, and therefore with more dyspnoea,8 may have a reduced prebroncho-dilator FVC and a normal FEV1/FVC ratio.9 Because FVC increase is more common than FEV1 increase after bronchodilator,10 postbronchodilator FEV
1/FVC <0.7 (POSTO) may be more sensitive to diagnose symptom-atic patients with clinically significant hyperinflation than prebronchodilator FEV1/FVC <0.7 (PREO).11 Therefore, it is critical to examine whether subjects with PREO and no AFO in postbronchodilator spirometry (POSTN) would have more clinical, functional and radiographic COPD features than subjects with POSTO and no AFO in prebronchodilator spirometry (PREN). Do clinical, func-tional and radiographic features differ between subjects with PREO and POSTN and subjects with PREN and POSTO?
We compared the predictive value of prebroncho-dilator and postbronchoprebroncho-dilator FEV1/FVC <0.7 and FEV1% predicted for chronic bronchitis, dyspnoea, exercise capacity and COPD radiographic findings at phase 1 (baseline); respiratory exacerbations, change in dyspnoea, FEV1 and exercise capacity from phase 1 to phase 2 visit (about 5 years apart); and mortality. We also examined whether subjects with discordance in prebron-chodilator and postbronprebron-chodilator spirometry have different clinical, functional and radiographic features.
Methods data collection
We conducted the study using data from the COPDGene database. GOPDGene is an ongoing study that enrolled subjects in several clinical centres through the USA (http://www. copdgene. org/). The institutional review boards at each participating centre approved the study protocol. Details of the study protocol have been published previously.12 Briefly, all subjects provided informed consent before participation in the study. Subjects are self-identified non-Hispanic whites or Afri-can-Americans between the ages of 45 and 80 years. They completed a modified American Thoracic Society Respiratory Epidemiology Questionnaire, St. George’s Respiratory Questionnaire (SGRQ) and 6 min walk test at phase 1 visit (baseline). Subjects performed prebron-chodilator and postbronprebron-chodilator spirometry according to American Thoracic Society–European Respiratory Society (ATS-ERS) guidelines.13 After prebronchodilator spirometric manoeuvres, two puffs of albuterol metered-dose inhaler were administered using a spacer. Post-bronchodilator manoeuvres were performed between 15 and 40 min after albuterol administration and pref-erably between 15 and 20 min. Subjects performed inspiratory and expiratory chest CT scans using multi-detector CT scanners as per protocol.12 Volumetric CT
scans were obtained at maximal inspiration (total lung capacity (TLC)) and end-tidal expiration (functional residual capacity (FRC)). Emphysema and gas trapping were quantitated using 3D Slicer software (www. airway-inspector. org), and airway dimensions were measured using Pulmonary Workstation 2 (VIDA Diagnostics, Coralville, Iowa, USA).12
We included all subjects who participated in COPD-Gene study with at least 10 or more pack-years of smoking and who completed a phase 1 visit (n=10 192). Subjects were contacted every 6 months and completed a vali-dated questionnaire regarding respiratory exacerba-tions. About 5 years after the phase 1 visit, a portion of subjects had a phase 2 visit that included questionnaire as in phase 1, a prebronchodilator and postbronchodi-lator spirometry and 6 min walk test. We also collected all-cause mortality data. We excluded those with incom-plete prebronchodilator and postbronchodilator spiro-metric data.
definitions and outcomes
Prebronchodilator AFO (PREO) was defined as prebron-chodilator FEV1/FVC <0.7. Postbronchodilator AFO (POSTO) was defined as postbronchodilator FEV1/FVC <0.7. Prebronhodilator FEV1% predicted (Pre-FEV1%) and postbronchodilator FEV1% predicted (post-FEV1%) were calculated using predicted equations by Hankinson et al.14 Bronchodilator response was defined as an increase in FEV1 or FVC equal to or greater than 0.2 L and 12% according to ATS-ERS guidelines.9
Emphysema was defined by using the percentage of lung volume at TLC with attenuation less than −950 Hounsfield units (HU).12 15 Expiratory CT scans were performed at FRC. Gas trapping was quantified as the percentage of lung volume at FRC with attenuation less than −856 HU.12 15
Exacerbations were defined as episodes of worsening respiratory symptoms requiring use of antibiotics and systemic steroids since the phase 1 visit. Severe exac-erbations were defined as those requiring hospitalisa-tions. Other variables definitions have been previously described.12 15
statistical analysis
We performed a McNemar test for paired binary data to compare the prevalence rate of AFO using PREO and POSTO as diagnostic criteria.
We stratified the subjects by prebronchodilator and postbronchodilator FEV1/FVC to:
► Prebronchodilator FEV1/FVC ≥0.7 (PREN) and post-bronchodilator FEV1/FVC ≥ 0.7 (POSTN) = (PREN-POSTN).
► Prebronchodilator FEV1/FVC <0.7 (PREO) and postbronchodilator FEV1/FVC <0.7 (POSTO) =(PREO-POSTO).
by copyright.
on September 18, 2020 by guest. Protected
► Prebronchodilator FEV1/FVC <0.7 (PREO) and post-bronchodilator FEV1/FVC ≥ 0.7 (POSTN) = (PREO-POSTN).
► Prebronchodilator FEV1/FVC ≥ 0.7 (PREN) and postbronchodilator FEV1/FVC <0.7 (POSTO) = (PREN-POSTO).
We compared characteristics at the phase 1 visit, number of exacerbations per year, changes in FEV1, dysp-noea score and distance covered in 6 min walk from the phase 1 to the phase 2 visit between PREO-POSTN and PREN-POSTO using Fischer’s exact or χ2 test for categor-ical variables and Student’s t-test or Wilcoxon rank sum test for normal and non-normal continuous variables, respectively. When we found a significant difference in the above measures between PREO-POSTN and PREN-POSTO in unadjusted analysis, we created multivariable regression models with PREO-POSTN versus PREN-POSTO as an independent variable.
We performed multivariable logistic regression models with chronic bronchitis at baseline as the dependent variable (outcome) and PREO, POSTO, pre-FEV1% and post-FEV1% as the independent variables. Similarly, we performed multivariable linear regression models with the following dependent variables: (1) dyspnoea scores, emphysema%, gas trapping% and distance covered in 6 min walk at phase 1; (2) number of respiratory exac-erbations and severe exacexac-erbations per year; and (3) changes in FEV1, dyspnoea and distance covered in 6 min walk between phase 1 and phase 2 visit, and prebroncho-dilator and postbronchoprebroncho-dilator measures as the indepen-dent variables.
We used a Cox proportional hazard regression analysis to examine the association of spirometric measures and patterns with mortality.
All regression models included the following covari-ates: age, sex, race, smoking status, pack-years, history of asthma (per questionnaire), diabetes, high blood pres-sure, stroke and sleep apnoea. We used the Akaike infor-mation criterion (AIC) to compare the performance of the various models.16 17 Lower AIC by 7 indicates better model performance.16 We used R software package (http://www. r- project. org/) for all statistical analysis.
results
Of 10 192 subjects with at least 10 or more pack-years of smoking, we excluded 192 with incomplete prebroncho-dilator and postbronchoprebroncho-dilator spirometric data. Ten thousand subjects were included in in the analysis. We had available data regarding respiratory exacerbations for 8479 subjects. Of the 10 000 subjects, 4857 completed a phase 2 visit that included respiratory questionnaires, spirometry and 6 min walk test. We also had available mortality data for 8221 subjects.
Using PREO, the AFO prevalence was 50.2% (5016 of 10 000), whereas using POSTO, the prevalence was 44.5% (4451 of 10 000; P<0.001). There were 1167 subjects with discordant spirometry: 866 (8.7%) with PREO-POSTN
and 301 (3%) with PREN-POSTO (supplementary table 1).
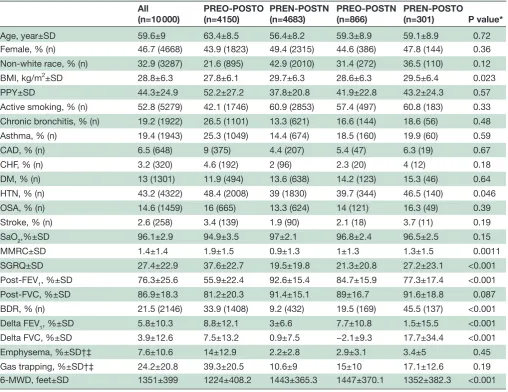
baseline characteristics at phase 1 (n=10 000)
Table 1 shows the characteristics of subjects with PREO-POSTO, POSTN, PREO-POSTN and POSTO. Compared with PREO-POSTN subjects, PREN-POSTO subjects had higher body mass index, higher prevalence of hypertension, higher dyspnoea scores, lower post-FEV1% and shorter distance covered in 6 min walk. Bronchodilator response was more common in PREN-POSTO subjects than in PREN-POSTN subjects. Change in FEV1% predicted after bronchodilator was smaller, but change FVC% predicted after bronchodi-lator was larger in PREN-POSTO subjects compared with subjects with PREO-POSTN.
To investigate further the higher dyspnoea scores and shorter distance covered in 6 min walk in PREO-POSTN subjects compared with PREN-POSTO subjects, we performed multilinear regression analysis and found that PREN-POSTO is associated with increased dyspnoea and reduced exercise capacity. (supplementary table 2). However, when we added post-FEV1% in the models, this association disappeared.
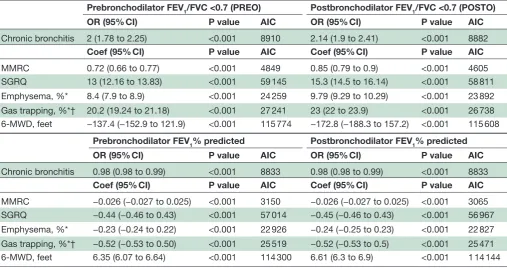
In the adjusted analysis, both PREO and POSTO were associated with chronic bronchitis, dyspnoea scores, radiographic percent emphysema and gas trapping and distanced covered in 6 min walk at the phase 1 visit, but based on the AIC, models that included POSTO performed better than models that included PREO to predict those outcomes (table 2). We found similar results for pre-FEV1% and post-FEV1%.
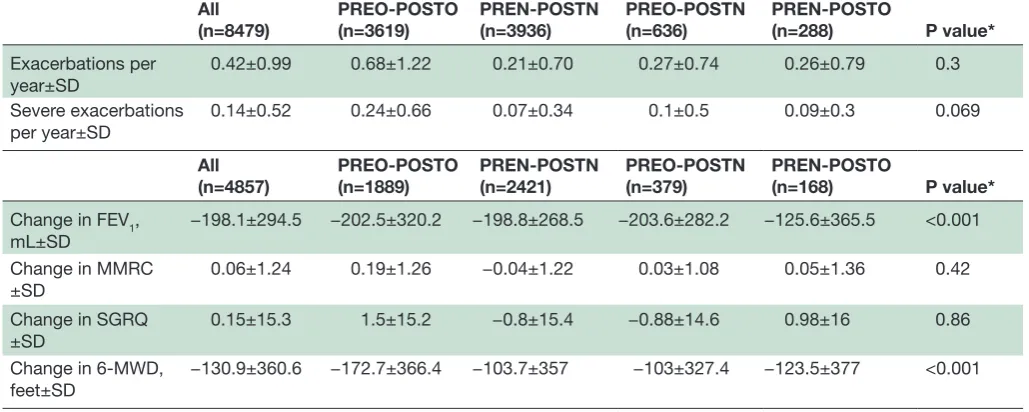
respiratory exacerbations (n=8479) and changes in clinical and functional features at phase 2 (n=4857)
We found no difference in the number of exacerba-tions and severe exacerbaexacerba-tions per year between PREO-POSTO and PREN-PREO-POSTO subjects followed in average for 4.5±1.8 years (table 3). The drop in FEV1 between the phase 1 and 2 visits was greater in PREO-POSTN compared with the change in PREN-POSTO subjects, whereas the change in distance covered in 6 min walk was smaller in the PREO-POSTN compared with PREN-POSTO group. In adjusted analysis, PREN-POSTO subjects had a smaller reduction in FEV1 compared with PREO-POSTN subjects, but when we adjusted for postbronchodilator FEV1% that association disappeared (supplementary table 3).
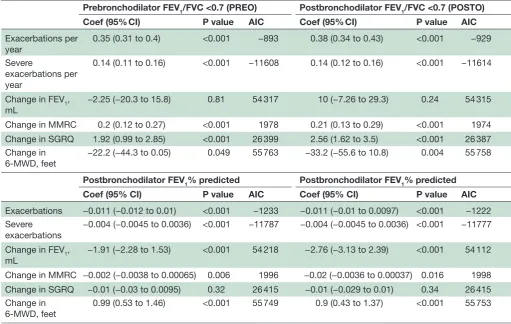
In multilinear regression analysis, both PREO and POSTO correlated significantly with number of exacerba-tions and severe exacerbaexacerba-tions per year, dyspnoea scores and distance covered in 6 min walk between phase 1 and 2 visits (table 4). Based on AIC, models showed similar performance to predict those outcomes regardless whether PREO or POSTO was included, except models for number of exacerbations and change in SGRQ score, where those models that included POSTO performed better compared with those that included PREO.
by copyright.
on September 18, 2020 by guest. Protected
Table 1 Baseline characteristics
All
(n=10 000) PREO-POSTO(n=4150) PREN-POSTN(n=4683) PREO-POSTN(n=866) PREN-POSTO(n=301) P value*
Age, year±SD 59.6±9 63.4±8.5 56.4±8.2 59.3±8.9 59.1±8.9 0.72
Female, % (n) 46.7 (4668) 43.9 (1823) 49.4 (2315) 44.6 (386) 47.8 (144) 0.36 Non-white race, % (n) 32.9 (3287) 21.6 (895) 42.9 (2010) 31.4 (272) 36.5 (110) 0.12 BMI, kg/m2±SD 28.8±6.3 27.8±6.1 29.7±6.3 28.6±6.3 29.5±6.4 0.023
PPY±SD 44.3±24.9 52.2±27.2 37.8±20.8 41.9±22.8 43.2±24.3 0.57
Active smoking, % (n) 52.8 (5279) 42.1 (1746) 60.9 (2853) 57.4 (497) 60.8 (183) 0.33 Chronic bronchitis, % (n) 19.2 (1922) 26.5 (1101) 13.3 (621) 16.6 (144) 18.6 (56) 0.48 Asthma, % (n) 19.4 (1943) 25.3 (1049) 14.4 (674) 18.5 (160) 19.9 (60) 0.59
CAD, % (n) 6.5 (648) 9 (375) 4.4 (207) 5.4 (47) 6.3 (19) 0.67
CHF, % (n) 3.2 (320) 4.6 (192) 2 (96) 2.3 (20) 4 (12) 0.18
DM, % (n) 13 (1301) 11.9 (494) 13.6 (638) 14.2 (123) 15.3 (46) 0.64 HTN, % (n) 43.2 (4322) 48.4 (2008) 39 (1830) 39.7 (344) 46.5 (140) 0.046 OSA, % (n) 14.6 (1459) 16 (665) 13.3 (624) 14 (121) 16.3 (49) 0.39 Stroke, % (n) 2.6 (258) 3.4 (139) 1.9 (90) 2.1 (18) 3.7 (11) 0.19
SaO2,%±SD 96.1±2.9 94.9±3.5 97±2.1 96.8±2.4 96.5±2.5 0.15
MMRC±SD 1.4±1.4 1.9±1.5 0.9±1.3 1±1.3 1.3±1.5 0.0011
SGRQ±SD 27.4±22.9 37.6±22.7 19.5±19.8 21.3±20.8 27.2±23.1 <0.001 Post-FEV1, %±SD 76.3±25.6 55.9±22.4 92.6±15.4 84.7±15.9 77.3±17.4 <0.001 Post-FVC, %±SD 86.9±18.3 81.2±20.3 91.4±15.1 89±16.7 91.6±18.8 0.087 BDR, % (n) 21.5 (2146) 33.9 (1408) 9.2 (432) 19.5 (169) 45.5 (137) <0.001 Delta FEV1, %±SD 5.8±10.3 8.8±12.1 3±6.6 7.7±10.8 1.5±15.5 <0.001 Delta FVC, %±SD 3.9±12.6 7.5±13.2 0.9±7.5 −2.1±9.3 17.7±34.4 <0.001 Emphysema, %±SD†‡ 7.6±10.6 14±12.9 2.2±2.8 2.9±3.1 3.4±5 0.45 Gas trapping, %±SD†‡ 24.2±20.8 39.3±20.5 10.6±9 15±10 17.1±12.6 0.19 6-MWD, feet±SD 1351±399 1224±408.2 1443±365.3 1447±370.1 1352±382.3 <0.001
*Comparison between PREO-POSTN and PREN-POSTO using χ2 and Student’s t-test or Wilcoxon rank sum test.
†For emphysema and gas trapping analysis, data were available for 5553 and 4945 subjects, respectively. ‡Gas trapping was measured at functional residual capacity.
6-MWD, 6 min walk distance; BDR, bronchodilator response; BMI, body mass index; CAD, coronary artery disease; CHF, congestive heart failure; Delta FEV1%, % change in FEV1 after bronnchodilator; Delta FVC%, % change in FVC after bronchodilator; DM, diabetes mellitus; FEV1, forced expiratory volume in 1 s; FVC, forced vital capacity; HTN, hypertension; MMRC, modified Medical Research Council dyspnoea score; OSA, obstructive sleep apnoea; pre-FEV1%, prebronchodilator FEV1% predicted; post-FEV1%, postbronchodilator FEV1% predicted; PPY, pack per year; SaO2, arterial oxygen saturation; SGRQ, St. George’s Respiratory Questionnaire score;6-MWD = 6-min walk distance. PREN-POSTN: prebronchodilator FEV1/FVC >0.7 and postbronchodilator FEV1/FVC >0.7.
PREN-POSTO: prebronchodilator FEV1/FVC >0.7 and postbronchodilator FEV1/FVC <0.7. PREO-POSTNO: prebronchodilator FEV1/FVC <0.7 and postbronchodilator FEV1/FVC <0.7. PREO-POSTN: prebronchodilator FEV1/FVC <0.7 and postbronchodilator FEV1/FVC >0.7.
Similarly, both prebronchodilator and postbronchodi-lator FEV1% correlated significantly with the number of exacerbations and severe exacerbations per year, change in FEV1, dyspnoea scores and distance covered in 6 min walk between phase 1 and 2 visits (table 4). Models showed similar performance except models for number of exac-erbations (pre-FEV1% models performed better) and for change in FEV1 (pre-FEV1% models performed better).
spirometric pattern at phase 2
Of 377 subjects with PREO-POSTN at phase 1 who had both prebronchodilator and postbronchodilator spirom-etry at the phase 2 visit, the phase 2 spiromspirom-etry showed
PREO-POSTO in 167 (44.3%), PREN-POSTN in 120 (31.8%), PREO-POSTN in 72 (19.1%) and PREN-POSTO in 18 (4.8%) (supplementary table 4). Of those subjects who progressed to PREO-POSTO, 52.1% were active smokers; only 39.2% of those who progressed to PREN-POSTN were active smokers at the phase 2 visit (P=0.03).
Of 166 PREN-POSTO at phase 1 who had both prebronchodilator and postbronchodilator spirometry at the phase 2 visit, the phase 2 spirometry showed PREO-POSTO in 82 (49.4%), PREN-POSTN in 51 (30.7%), PREO-POSTN in 24 (14.5%) and PREN-POSTO in 9 (5.4%) (supplementary table 4). Of those subjects who progressed to PREO-POSTO, 50% were active smokers,
by copyright.
on September 18, 2020 by guest. Protected
Table 2 Association of prebronchodilator and postbronchodilator spirometric measures with chronic bronchitis, dyspnoea scores, chest CT emphysema and air trapping and distance covered in 6 min walk test
Prebronchodilator FEV1/FVC <0.7 (PREO) Postbronchodilator FEV1/FVC <0.7 (POSTO)
OR (95% CI) P value AIC OR (95% CI) P value AIC
Chronic bronchitis 2 (1.78 to 2.25) <0.001 8910 2.14 (1.9 to 2.41) <0.001 8882
Coef (95% CI) P value AIC Coef (95% CI) P value AIC
MMRC 0.72 (0.66 to 0.77) <0.001 4849 0.85 (0.79 to 0.9) <0.001 4605 SGRQ 13 (12.16 to 13.83) <0.001 59 145 15.3 (14.5 to 16.14) <0.001 58 811 Emphysema, %* 8.4 (7.9 to 8.9) <0.001 24 259 9.79 (9.29 to 10.29) <0.001 23 892 Gas trapping, %*† 20.2 (19.24 to 21.18) <0.001 27 241 23 (22 to 23.9) <0.001 26 738 6-MWD, feet −137.4 (−152.9 to 121.9) <0.001 115 774 −172.8 (−188.3 to 157.2) <0.001 115 608
Prebronchodilator FEV1% predicted Postbronchodilator FEV1% predicted
OR (95% CI) P value AIC OR (95% CI) P value AIC
Chronic bronchitis 0.98 (0.98 to 0.99) <0.001 8833 0.98 (0.98 to 0.99) <0.001 8833
Coef (95% CI) P value AIC Coef (95% CI) P value AIC
MMRC −0.026 (−0.027 to 0.025) <0.001 3150 −0.026 (−0.027 to 0.025) <0.001 3065 SGRQ −0.44 (−0.46 to 0.43) <0.001 57 014 −0.45 (−0.46 to 0.43) <0.001 56 967 Emphysema, %* −0.23 (−0.24 to 0.22) <0.001 22 926 −0.24 (−0.25 to 0.23) <0.001 22 827 Gas trapping, %*† −0.52 (−0.53 to 0.50) <0.001 25 519 −0.52 (−0.53 to 0.5) <0.001 25 471 6-MWD, feet 6.35 (6.07 to 6.64) <0.001 114 300 6.61 (6.3 to 6.9) <0.001 1 14 144
All regression models included the following covariates: age, sex, race, smoking status, pack per years, history (per questionnaire) of asthma, diabetes, high blood pressure, stroke and sleep apnoea.
*For emphysema and gas trapping analysis, data were available for 5553 and 4945 subjects, respectively.
†Gas trapping was measured at functional residual capacity.
6-MWD, 6 min walk distance; AIC, Akaike information criterion; FEV1, forced expiratory volume in 1 s; FVC, forced vital capacity; MMRC,
modified Medical Research Council dyspnoea score; SGRQ, St. George’s Respiratory Questionnaire score.
while 52.3% of those who progressed to PREN-POSTN were active smokers at the phase 2 visit (P=0.74).
Mortality (n=8221)
Subjects were followed in average for 1956±407 days, and there were 830 deaths (10.1%). All PREO, POSTO, pre-FEV1%, and post-FEV1% were associated with mortality (table 5). Based on AIC, models that included post-FEV1% performed better at predicting mortality than the rest. Furthermore, PREO-POSTO was associated with increased mortality, while PREO-POSTN and PREN-POSTO were not (supplementary table 5).
dIscussIon
In this report, AFO prevalence is higher when the PREO criterion is applied. About 8.5% of all subjects had PREO-POSTN, whereas 3% had a PREN-POSTO spiro-metric pattern. In adjusted analysis, we found no differ-ence in COPD features and outcomes between PREO-POSTN and PREN-POSTO subjects. Although both prebronchodilator and postbronchodilator spirometry are associated with chronic bronchitis, dyspnoea, exer-cise capacity and COPD radiographic findings, models that include postbronchodilator spirometric measures perform better than those with prebronchodilator
measures to predict those outcomes. The predictive value of prebronchodilator and postbronchodilator spirometries are relatively similar for respiratory exac-erbations, change in FEV1 and dyspnoea from phase 1 to phase 2 visits. Both prebronchodilator and postbron-chodilator spirometry are associated with mortality, but models that include postbronchodilator spirometric measures perform better than models with prebron-chodilator spirometry. About half of PREO-POSTN and PREN-POSTN become POSTO at Phase 2. PREO-POSTO is associated with higher mortality compared with the other patterns.
The prevalence of AFO and therefore COPD is higher using prebronchodilator spirometry in our cohort, although previous studies have shown mixed results.7 18 Is this clinically significant? In the absence of a ‘gold standard’, a diagnostic test is good when it can predict outcomes and change management of a disease or condition. Both prebronchodilator and postbronchodi-lator spirometry were associated with chronic bronchitis, dyspnoea, radiographic emphysema and gas trapping and exercise capacity. Nevertheless, models that included postbronchodilator spirometric measures performed better compared with those that included postbroncho-dilator measures, indicating that postbronchopostbroncho-dilator spirometry correlates better with those outcomes.
by copyright.
on September 18, 2020 by guest. Protected
Table 3 Number of exacerbations and severe exacerbations per year, change in FEV1, dyspnoea scores and distance covered in 6 min walk test from phase 1 to phase 2 visit (5-year interval)
All
(n=8479) PREO-POSTO(n=3619) PREN-POSTN(n=3936) PREO-POSTN(n=636) PREN-POSTO(n=288) P value*
Exacerbations per
year±SD 0.42±0.99 0.68±1.22 0.21±0.70 0.27±0.74 0.26±0.79 0.3 Severe exacerbations
per year±SD
0.14±0.52 0.24±0.66 0.07±0.34 0.1±0.5 0.09±0.3 0.069
All
(n=4857) PREO-POSTO(n=1889) PREN-POSTN(n=2421) PREO-POSTN(n=379) PREN-POSTO(n=168) P value*
Change in FEV1, mL±SD
−198.1±294.5 −202.5±320.2 −198.8±268.5 −203.6±282.2 −125.6±365.5 <0.001
Change in MMRC
±SD 0.06±1.24 0.19±1.26 −0.04±1.22 0.03±1.08 0.05±1.36 0.42
Change in SGRQ
±SD 0.15±15.3 1.5±15.2 −0.8±15.4 −0.88±14.6 0.98±16 0.86
Change in 6-MWD, feet±SD
−130.9±360.6 −172.7±366.4 −103.7±357 −103±327.4 −123.5±377 <0.001
*Comparison between PREO-POSTN and PREN-POSTO using χ2 and Student’s t-test or Wilcoxon rank sum test.
6-6-MWD = 6-min walk distance; MMRC, modified Medical Research Council dyspnoea score; SGRQ, St. George’s Respiratory Questionnaire score.
PREN-POSTN: prebronchodilator FEV1/FVC >0.7 and postbronchodilator FEV1/FVC >0.7.
PREO-POSTNO: prebronchodilator FEV1/FVC <0.7 and postbronchodilator FEV1/FVC <0.7.
PREO-POSTN: prebronchodilator FEV1/FVC <0.7 and postbronchodilator FEV1/FVC >0.7.
PREN-POSTO: prebronchodilator FEV1/FVC >0.7 and postbronchodilator FEV1/FVC <0.7.
When we examined the subjects with AFO discordance in prebronchodilator and postbronchodilator spirom-etry, which comprised 11.7% of our total cohort, PREN-POSTO subjects have a remarkable increase in FVC after bronchodilator spirometry compared with PREO-POSTN subjects, although they have similar postbronchodilator FVC%. PREN-POSTO subjects have likely more prebron-chodilator air trapping than PREO-POSTN, which can be present in mild disease19 20 and result in exertional dyspnoea and lower exercise capacity.8 19 21 We did not observe higher radiographic air trapping in the PREN-POSTO than in the PREO-POSTN group, likely because CTs were performed after bronchodilator spirometry. When we adjusted for post-FEV1%, PREN-POSTO was not associated with worse dyspnoea or exercise capacity compared with PREO-POSTN, which means that PREN-POSTO does not represent a different phenotype with increased air trapping but rather a group with more severe disease and lower post-FEV1%.22
Prebronchodilator and postbronchodilator measures showed relatively similarly predictive value for long-term outcomes such as respiratory exacerbations, change of FEV1, dyspnoea score and exercise capacity. Previous studies have shown that bronchodilator response is associ-ated with clinical outcomes,23 24 but this association could be confounded by lung function.22 25 For that reason, we adjusted for post-FEV1% at baseline, and we found that the discordance groups had no difference in change of FEV1, dyspnoea score and exercise capacity.
Postbronchodilator spirometry models perform better than prebronchodilator spirometry models to predict
mortality, although both are strongly associated with mortality. This is in disagreement with a previous study by Mannino et al6 that showed that both prebronchodilator and postbronchodilator spirometry can predict mortality with the same accuracy in a similar population to ours. Although subjects were followed for 15 years in their study instead of about 5 years in our study, their study was performed almost 20 years earlier than COPDGene, and they did not also include comorbidities in their analysis as we did. In AFO discordance groups, we did not find any difference in mortality between the two groups. PREO-POSTO subjects had increased mortality compared with the other groups, which may again reflect more advanced disease with lower post-FEV1%.22 Although postbronchodilator may be superior to prebronchodi-lator spirometric measures to predict outcome, there are no available postbronchodilator spirometric reference values for a US population. Previous reports in Northern Europe26 and South America27 have provided postbron-chodilator spirometric reference values, but their predic-tive value for obstrucpredic-tive lung disease outcomes has not been compared with that of prebronchodilator reference values.
In addition, we showed that about 50% of the subjects with AFO discordance between prebronchodilator and postbronchodilator spirometry progress to PREO-POSTO, which is a pattern with higher mortality than the rest of the groups. Interestingly, subjects with PREO-POSTN that progressed to PREO-POSTO had higher smoking rates than those that progressed to PREN-POSTN in the follow-up visit; this raises the question
by copyright.
on September 18, 2020 by guest. Protected
Table 4 Association of prebronchodilator and postbronchodilator spirometric measures with number of exacerbations and severe exacerbations per year, change in FEV1, dyspnoea scores and distance covered in 6 min walk test from phase 1 to phase 2 visit (5-year interval)
Prebronchodilator FEV1/FVC <0.7 (PREO) Postbronchodilator FEV1/FVC <0.7 (POSTO)
Coef (95% CI) P value AIC Coef (95% CI) P value AIC
Exacerbations per
year 0.35 (0.31 to 0.4) <0.001 −893 0.38 (0.34 to 0.43) <0.001 −929 Severe
exacerbations per year
0.14 (0.11 to 0.16) <0.001 −11608 0.14 (0.12 to 0.16) <0.001 −11614
Change in FEV1, mL
−2.25 (−20.3 to 15.8) 0.81 54 317 10 (−7.26 to 29.3) 0.24 54 315
Change in MMRC 0.2 (0.12 to 0.27) <0.001 1978 0.21 (0.13 to 0.29) <0.001 1974 Change in SGRQ 1.92 (0.99 to 2.85) <0.001 26 399 2.56 (1.62 to 3.5) <0.001 26 387 Change in
6-MWD, feet
−22.2 (−44.3 to 0.05) 0.049 55 763 −33.2 (−55.6 to 10.8) 0.004 55 758
Postbronchodilator FEV1% predicted Postbronchodilator FEV1% predicted
Coef (95% CI) P value AIC Coef (95% CI) P value AIC
Exacerbations −0.011 (−0.012 to 0.01) <0.001 −1233 −0.011 (−0.01 to 0.0097) <0.001 −1222 Severe
exacerbations −0.004 (−0.0045 to 0.0036) <0.001 −11787 −0.004 (−0.0045 to 0.0036) <0.001 −11777 Change in FEV1,
mL −1.91 (−2.28 to 1.53) <0.001 54 218 −2.76 (−3.13 to 2.39) <0.001 54 112 Change in MMRC −0.002 (−0.0038 to 0.00065) 0.006 1996 −0.02 (−0.0036 to 0.00037) 0.016 1998 Change in SGRQ −0.01 (−0.03 to 0.0095) 0.32 26 415 −0.01 (−0.029 to 0.01) 0.34 26 415 Change in
6-MWD, feet 0.99 (0.53 to 1.46) <0.001 55 749 0.9 (0.43 to 1.37) <0.001 55 753
All regression models included the following covariates: age, sex, race, smoking status, pack per years, history (per questionnaire) of asthma, diabetes, high blood pressure, stroke and sleep apnoea.
6-MWD, 6 min walk distance; AIC, Akaike information criterion; FEV1, forced expiratory volume in 1 s; FVC, forced vital capacity; MMRC, modified Medical Research Council dyspnoea score; SGRQ, St. George’s Respiratory Questionnaire score.
Table 5 Mortality models
HR (95% CI) P value AIC
PREO 2.46 (2.07 to 2.92) <0.001 14 194 POSTO 2.54 (2.15 to 3) <0.001 14 181 Pre-FEV1% 0.97 (0.96 to 0.97) <0.001 13 837 Post-FEV1% 0.97 (0.96 to 0.97) <0.001 13 806
All regression models included the following covariates: age, sex, race, smoking status, pack per years, history (per questionnaire) of asthma, diabetes, high blood pressure, stroke and sleep apnoea. AIC , Akaike information criterion; POSTO, postbronchodilator FEV1/FVC <0.7; pre-FEV1%, prebronchodilator FEV1% predicted; post-FEV1%, postbronchodilator FEV1% predicted; PREO, prebronchodilator FEV1/FVC <0.7.
whether this group represents patients with early disease to whom we need to target interventions like smoking cessation. This finding suggest that using prebronchodi-lator spirometry may be a better diagnostic test for early (or future) disease although postbronchodilator spirom-etry correlates better with current symptoms, functional and radiographic measures and 5-year mortality.
Apart from the fact that chest CTs were performed after bronchodilator and gas trapping was measured at FRC our study is limited by the large variability of bronchodi-lator response. Although, we used albuterol and the same protocol for all the bronchodilations, greater bronchodi-lator response may occur when spirometric manoeuvres were performed >20 min after bronchodilator administra-tion instead of 15–20 min.22 28 Subjects older than 80 years were not included. We only have phase 2 spirometries for half of the subjects. The follow-up period may not be long enough to detect some outcome differences, espe-cially mortality, between the AFO discordance groups. We do not have data on the specific cause of death. We did not also detect any robust outcome differences, as both prebronchodilator and postbronchodilator spirometries were associated strongly with outcomes. Postbroncho-dilator spirometry superiority is based on better model performance using the AIC.16 17 These limitations do not undermine the strengths of our study, which include the large sample size and the wealth of epidemiological data.
In conclusion, PREO was more sensitive to diagnose AFO compared with POSTO. About half of the subjects
by copyright.
on September 18, 2020 by guest. Protected
with AFO discordance in their prebronchodilator and postbronchodilator spirometry, which compromise 11% of all subjects, progress to PREO-POSTO, which is a pattern with higher mortality compared with the other patterns. Although both prebronchodilator and post-bronchodilator spirometries are associated with clin-ical, functional and radiographic features of COPD, and mortality, our findings suggest that postbronchodilator spirometry may be a more accurate measure of COPD burden and should be used for COPD diagnosis and classification. This raises the question of whether post-bronchodilator spirometric reference values for the US population are needed.
Acknowledgements We thank Paul Casella, MFA for editorial assistance and PatrickTen Eyck, PhD for statistical consult.
collaborators COPDgene investigators
contributors All authors made substantial contributions to the study. SF participated in study conception and design, data analysis and interpretation and drafting of the manuscript. ME participated in study design, data interpretation and drafting of the manuscript. DG participated in data interpretation. AC participated in study conception and design, data interpretation and drafting of the manuscript. Funding The project described was supported by Award Number R01 HL089897 and Award Number R01 HL089856 from the National Heart, Lung, and Blood Institute. The COPDGene project is also supported by the COPD Foundation through contributions made to an Industry Advisory Board comprised of AstraZeneca, Boehringer Ingelheim, GlaxoSmithKline, Novartis, Pfizer, Siemens and Sunovion. competing interests None declared.
ethics approval The institutional review boards at each participating center outlined below approved the study protocol. Details of the study protocol have been published previously.12
Provenance and peer review Not commissioned; externally peer reviewed. data sharing statement Please contact COPD gene investigators for additional data request.
open Access This is an Open Access article distributed in accordance with the Creative Commons Attribution Non Commercial (CC BY-NC 4.0) license, which permits others to distribute, remix, adapt, build upon this work non-commercially, and license their derivative works on different terms, provided the original work is properly cited and the use is non-commercial. See: http:// creativecommons. org/ licenses/ by- nc/ 4. 0/
© Article author(s) (or their employer(s) unless otherwise stated in the text of the article) 2017. All rights reserved. No commercial use is permitted unless otherwise expressly granted.
RefeRenCes
1. Global initiative for chronic obstructive lung disease. Guide to copd diagnosis, management, and prevention. http:// goldcopd. org/ gold- 2017- global- strategy- diagnosis- management- prevention- copd/ 2. Vaz Fragoso CA, Concato J, McAvay G, et al. Chronic obstructive
pulmonary disease in older persons: A comparison of two spirometric definitions. Respir Med 2010;104:1189–96.
3. Mannino DM, Diaz-Guzman E. Interpreting lung function data using 80% predicted and fixed thresholds identifies patients at increased risk of mortality. Chest 2012;141:73–80.
4. Vaz Fragoso CA, Concato J, McAvay G, et al. The ratio of FEV1 to FVC as a basis for establishing chronic obstructive pulmonary disease. Am J Respir Crit Care Med 2010;181:446–51.
5. Chen CZ, Ou CY, Wang WL, et al. Using post-bronchodilator FEV1is better than pre-bronchodilator FEV1 in evaluation of COPD severity. COPD 2012;9:276–80.
6. Mannino DM, Diaz-Guzman E, Buist S. Pre- and post-bronchodilator lung function as predictors of mortality in the Lung Health Study. Respir Res 2011;12:136.
7. Tilert T, Dillon C, Paulose-Ram R, et al. Estimating the U.S. prevalence of chronic obstructive pulmonary disease using pre- and post-bronchodilator spirometry: the National Health and Nutrition Examination Survey (NHANES) 2007-2010. Respir Res 2013;14:103. 8. O'Donnell DE. Hyperinflation, dyspnea, and exercise intolerance
in chronic obstructive pulmonary disease. Proc Am Thorac Soc 2006;3:180–4.
9. Pellegrino R, Viegi G, Brusasco V, et al. Interpretative strategies for lung function tests. Eur Respir J 2005;26:948–68.
10. Newton MF, O'Donnell DE, Forkert L. Response of lung volumes to inhaled salbutamol in a large population of patients with severe hyperinflation. Chest 2002;121:1042–50.
11. Fortis S. Lost in interpretation: should the highest VC value be used to calculate the FEV1/VC ratio? Int J Chron Obstruct Pulmon Dis 2016;11:2167–70.
12. Regan EA, Hokanson JE, Murphy JR, et al. Genetic epidemiology of COPD (COPDGene) study design. COPD 2010;7:32–43.
13. Miller MR, Hankinson J, Brusasco V, et al. Standardisation of spirometry. Eur Respir J 2005;26:319–38.
14. Hankinson JL, Odencrantz JR, Fedan KB. Spirometric reference values from a sample of the general U.S. population. Am J Respir Crit Care Med 1999;159:179–87.
15. Wan ES, Hokanson JE, Murphy JR, et al. Clinical and radiographic predictors of gold-unclassified smokers in the COPDgene study. Am J Respir Crit Care Med 2011;184:57–63.
16. Burns RJ, Deschênes SS, Schmitz N. Associations between depressive symptoms and social support in adults with diabetes: Comparing directionality hypotheses with a longitudinal cohort. Ann Behav Med 2016;50:348–57.
17. Spolverato G, Ejaz A, Kim Y, et al. Prognostic performance of different lymph node staging systems after curative intent resection for gastric adenocarcinoma. Ann Surg 2015;262:991–8.
18. Pérez-Padilla R, Hallal PC, Vázquez-García JC, et al. Impact of bronchodilator use on the prevalence of COPD in population-based samples. COPD 2007;4:113–20.
19. Fortis S, Corazalla EO, Kim HJ. Does normal spirometry rule out an obstructive or restrictive ventilatory defect? Respir Investig 2017;55:55–7.
20. O'Donnell DE, Deesomchok A, Lam YM, et al. Effects of BMI on static lung volumes in patients with airway obstruction. Chest 2011;140:461–8.
21. Foglio K, Carone M, Pagani M, et al. Physiological and symptom determinants of exercise performance in patients with chronic airway obstruction. Respir Med 2000;94:256–63.
22. Calverley PM, Albert P, Walker PP. Bronchodilator reversibility in chronic obstructive pulmonary disease: use and limitations. Lancet Respir Med 2013;1:564–73.
23. Scanlon PD, Connett JE, Waller LA, et al. Smoking cessation and lung function in mild-to-moderate chronic obstructive pulmonary disease. The Lung Health Study. Am J Respir Crit Care Med 2000;161:381–90.
24. Vestbo J, Edwards LD, Scanlon PD, et al. Changes in forced expiratory volume in 1 second over time in COPD. N Engl J Med 2011;365:1184–92.
25. Albert P, Agusti A, Edwards L, et al. Bronchodilator responsiveness as a phenotypic characteristic of established chronic obstructive pulmonary disease. Thorax 2012;67:701–8.
26. Johannessen A, Lehmann S, Omenaas ER, et al. Post-bronchodilator spirometry reference values in adults and implications for disease management. Am J Respir Crit Care Med 2006;173:1316–25. 27. Pérez-Padilla R, Torre Bouscoulet L, Vázquez-García JC, et al.
Spirometry reference values after inhalation of 200 microg of salbutamol. Arch Bronconeumol 2007;43:530–4.
28. Campbell S. For COPD a combination of ipratropium bromide and albuterol sulfate is more effective than albuterol base. Arch Intern Med 1999;159:156–60.
by copyright.
on September 18, 2020 by guest. Protected