In New South Wales (NSW), the lack of representative clin-ical data on the oral health of adults has curtailed a compre-hensive and co-ordinated approach to planning for oral health services, policy and program development. Although
Abstract: Objectives: The 2004–06 National Survey of Adult Oral Health was Australia’s second oral examination survey of a nationally representa-tive sample of adults. The aim of this paper is to provide a brief overview of oral health in the NSW adult population from the findings of the survey. Methods: A three-stage, stratified, clustered sam-pling design was used to select NSW residents aged 15 years and over. Self-reported information about oral health was obtained through telephone inter-views. People with natural teeth were offered clinical examinations. Results: 3630 people were inter-viewed and 1099 underwent a clinical examination. Only 5.5% of the study population were edentulous (all natural teeth missing) compared with the national estimate of 6.4%. The Decayed, Missing, Filled Teeth (DMFT) caries severity index was 12.8, equal to that of the Australian population; prevalence of untreated decay was 27.1%, which was not signif-icantly different to the national estimate of 25.5%. Some 60.3% of the NSW survey sample had visited a dentist within the last 12 months (nationally 59.4%) and 56.8% visited for a check-up (56.2% nationally). Oral health, use of dental services and perceptions of need varied significantly by geo-graphic location, private insurance patronage and eligibility for public dental care. Conclusions: The oral health of the NSW adult population and patterns of dental care are similar to that estimated nationally. The prevalence and severity of dental diseases and oral health behaviours are influenced by social and geographic factors.
Shanti Sivaneswaran
Centre for Oral Health Strategy, NSW Department of Health Email: shanti_sivaneswaran@wsahs.nsw.gov.au
clinical data have been collected on the oral health of patients who attended public dental care in 1995–96 and 2001–02, the 1987–88 National Oral Health Survey remained the only survey that had collected oral examination data on a repre-sentative sample of NSW residents.1–4
In 2004, the Centre for Oral Health Strategy was responsi-ble for conducting the NSW component of the National Survey of Adult Oral Health 2004–06 in accordance with methods developed by the Australian Research Centre for Population Oral Health (ARCPOH) at the University of Adelaide, South Australia. The survey was a cross-sectional study of a representative sample of people aged 15 years and over across each state and territory, and described levels of oral disease, perceptions of oral health and patterns of dental care. Detailed methodology of the survey, national findings and NSW findings have been reported elsewhere.5,6The aim of this paper is to provide an overview from the findings of the survey of oral health in the NSW adult population, by using key indicators to compare NSW data between population subgroups and with national estimates. Data presented here were drawn from the national report and the NSW publication.5,6
Methods
A three-stage, stratified, clustered sampling design was used to select people from the target population of NSW residents aged 15 years and over. The sampling frame was households with telephone numbers listed in the electronic white pages database. Self-reported information about oral health and characteristics associated with it were obtained through telephone interviews. People with natural teeth were invited to attend a dental clinic for a clinical examination. Standardised clinical oral examination was carried out by 11 dentists trained and calibrated in the survey procedures by ARCPOH. Reliability testing was carried out against an ARCPOH principal survey exam-iner. Inter-examiner reliability was similar to benchmarks reported in the United States and United Kingdom national oral health surveys.
The oral health of adults in NSW, 2004–06
the alternative method of calculating P-values because 95% CIs that overlap to a small degree could be found to differ to a statistically significant degree (at P⬍0.05) using a hypothesis test. Data analysis was carried out by ARCPOH and, at the time of writing, no secondary analy-sis of the NSW unit record files made available to the Centre for Oral Health Strategy has been carried out.
Results
Socio-demographic characteristics of NSW participants
Out of 3630 NSW adults interviewed, 1099 underwent a clinical examination. One-half of the survey sample was female (49.8%), two-thirds lived in the capital city (64.1%), one-half had dental insurance (48.6%) and a quarter were government Health Care Card holders (26.4%).
Oral health status of NSW adults
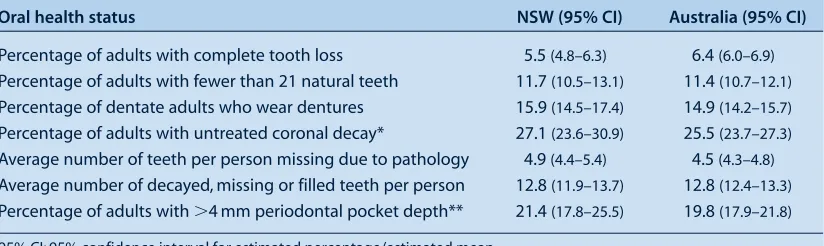
Complete loss of teeth (edentulism) is a marker of dental mortality. It is a consequence of both extensive dental disease and a surgical approach to its treatment. In NSW, only 5.5% of the population were edentulous compared with the national estimate of 6.4%. In the National Survey of Adult Oral Health, a threshold of 21 teeth was used as an indicator of professionally defined inadequacy of the natural dentition. The percentage of NSW adults who had fewer than 21 teeth (11.7%) was similar to the national figure of 11.4%. There was no statistically significant dif-ference between NSW dentate (people with teeth) adults who wear dentures in the upper or lower jaws (15.9%) compared with the national estimate of 14.9%. The preva-lence of untreated coronal decay was reported as the per-centage of dentate people who had at least one or more decayed surfaces on the crowns of their teeth. In NSW the prevalence of untreated coronal decay was 27.1% com-pared with the national estimate of 25.5%. There was no significant difference in the number of teeth missing due to pathology between dentate persons in NSW and those in the whole of Australia. The DMFT index reflects a person’s lifetime experience of dental caries. The DMFT
for NSW (12.8) is the same as that for the Australian population. An indicator for the severity of periodontal disease is a measurement of periodontal pocket depths more than 4 mm. The percentage of NSW adults who had at least one site with a periodontal pocket depth of 4 mm or more (21.4%) was not significantly different to the national estimate of 19.8% (Table 1).
Utilisation patterns of dental services by NSW adults
Time since last visiting a dentist is a key indicator of access to dental care. In NSW, 60.3% of adults visited a dentist within the last 12 months, which was not significantly dif-ferent from the national estimate of 59.4%. The majority of adults visited a private dental practice (80.8%), which was not significantly different to the whole Australian population (83.1%). The visiting behaviours of NSW adults was not different from that of all Australian adults with 54.9% of NSW adults visiting at least once a year compared with the national estimate of 53.1%. Usual attendance at the same dentist implies continuity of care and again there are no sig-nificant differences between NSW and all Australian adults. Approximately half of NSW adults visited a dentist for a check-up, which was similar to the figure for all Australian adults (Table 2).
Oral health perceptions of NSW adults
In addition to clinical examination, self-reported oral health, rates of pain and perceived needs for the most common dental treatments were collected to provide addi-tional indicators of subjective oral health. There was no significant difference between NSW and all Australian adults in self-reporting of oral health, experiencing toothache and orofacial pain. Similarly, there was no dif-ference in rates of the perceived need for extraction or filling. Those who perceived a need for extraction or filling were asked about the urgency of needed dental treatment. There was no difference in perceived urgency for treatment, with 71.6% of NSW adults reporting a need for treatment within 3 months, which is not significantly different to the national estimate of 69.3% (Table 3). Table 1. Key indicators of oral health status of NSW adults and comparison with national estimates
Oral health status NSW (95% CI) Australia (95% CI)
Percentage of adults with complete tooth loss 5.5 (4.8–6.3) 6.4 (6.0–6.9) Percentage of adults with fewer than 21 natural teeth 11.7 (10.5–13.1) 11.4 (10.7–12.1) Percentage of dentate adults who wear dentures 15.9 (14.5–17.4) 14.9 (14.2–15.7) Percentage of adults with untreated coronal decay* 27.1 (23.6–30.9) 25.5 (23.7–27.3) Average number of teeth per person missing due to pathology 4.9 (4.4–5.4) 4.5 (4.3–4.8) Average number of decayed, missing or filled teeth per person 12.8 (11.9–13.7) 12.8 (12.4–13.3) Percentage of adults with ⬎4 mm periodontal pocket depth** 21.4 (17.8–25.5) 19.8 (17.9–21.8)
95% CI: 95% confidence interval for estimated percentage/estimated mean.
*Percentage of people who have at least one or more decayed surface on the crowns of their teeth.
Health Care Card holders and those without insurance also have significantly less favourable patterns of utilisation on all indicators of dental care (Table 5). All three aspects of usual dental attendance patterns (attending at least once a year, usually attend the same dentist and attending for a check-up) were also significantly lower among residents outside of the capital city.
It was therefore not surprising that significantly more Health Care Card holders rated their oral health as fair-to-poor, reported experiencing more toothache and perceived a need for treatment. Significantly more uninsured adults also reported their oral health as poor and perceived a need for treatment (Table 6).
Discussion
The major findings from this study indicate that generally, the oral health of the NSW adult population is similar to the whole of the adult population in Australia. Since the 1987–88 survey, the proportion of NSW adults who had no natural teeth more than halved to 5.5%, which is consistent with the figure of 5.1% reported in the 2007 NSW Adult Health Survey.7In dentate adults, there were similar reduc-tions in the percentage with an inadequate natural dentition. Improvements were also reported in the decay experience since the last survey, with a fluoride generation (those born since the 1950s and 1960s) of NSW residents who have now
Utilisation patterns NSW (%) (95% CI) Australia (%) (95% CI)
Adults visiting dentist within last 12 months 60.3 (58.3–62.2) 59.4 (58.2–60.5) Adults who attended a private dental practice at last dental visit 80.8 (78.6–82.7) 83.1 (82.0–84.2) Adults who visit a dental professional at least once a year 54.9 (52.5–57.2) 53.1 (51.8–54.5) Adults who have a dentist they usually attend 81.4 (79.3–83.3) 78.6 (77.3–79.8) Adults who usually visit a dentist for a check-up 56.8 (54.4–59.2) 56.2 (54.8–57.5)
95% CI⫽95% confidence interval for estimated percentage.
Source: The National Survey of Adult Oral Health 2004–06. New South Wales.6
Table 3. Key indicators of oral health perceptions of NSW adults and comparisons with national estimates
Oral health perceptions NSW (%) (95% CI) Australia (%) (95% CI)
Adults rating their oral health as fair-to-poor 16.9 (15.1–18.8) 16.4 (15.5–17.4) Adults experiencing toothache 16.2 (14.5–18.2) 15.1 (14.2–16.1) Adults experiencing orofacial pain* 23.3 (21.5–25.1) 22.6 (21.6–23.6) Adults perceiving a need for an extraction or filling 31.1 (29.3–32.9) 32.9 (31.7–34.0) Adults perceiving urgency for treatment (within 3 months) 71.6 (67.7–75.2) 69.3 (67.4–71.3)
95% CI⫽95% confidence interval for estimated percentage.
*Percentage of participants who reported pain in the face, jaw, temple, in front of the ear or in the ear during the last month. Source: The National Survey of Adult Oral Health 2004–06. New South Wales.6
Oral health of NSW adults by population subgroup
The oral health of NSW adults by major socio-demographic subgroup were defined according to residential location, dental insurance status and by government Health Care Card status. A government Health Care Card is a conces-sion card issued by the Australian Government that entitles the holder to services, including public dental care. Eligibility for a Health Care Card is determined by a means test based primarily on income, assets and family composition.
The oral health of adults in NSW, 2004–06
Table 4. Oral health status of NSW adults by population subgroup
Oral health status All NSW adults Capital city/other Non Health Care Insured/uninsured (95% CI) locations Card holders/Health (95% CI)
(95% CI) Care Card holders*** (95% CI)
Percentage of adults with complete 5.5 (4.8–6.3) 4.0 (3.3–4.8) 2.0 (1.6–2.5) 2.3 (1.7–3.0)
tooth loss 8.1 (6.6 –9.8) 15.4 (13.3–17.8) 8.4 (7.2–9.8)
Percentage of adults with fewer than 11.7 (10.5–13.1) 10.3 (8.7–12.1) 6.0 (5.1–7.1) 7.3 (6.0–8.8)
21 natural teeth 14.3 (12.4–16.4) 31.3 (27.9–34.8) 16.2 (14.2–18.4)
Percentage of adults with untreated 27.1 (23.6–30.9) 21.4 (17.6–25.6) 23.8 (19.8–28.3) 20.7 (15.6–26.8)
coronal decay* 37.4 (30.7–44.6) 36.9 (30.0–44.3) 33.2 (28.6–38.2)
Average number of decayed, missing or 12.8 (11.9–13.7) 12.2 (11.1–13.3) 11.5 (10.6–12.5) 12.8 (11.5–14.1) filled teeth per person 13.9 (12.3–15.5) 16.6 (14.9–18.3) 13.1 (11.9–14.2) Average number of teeth per person 4.9 (4.4–5.4) 4.4 (3.7–5.0) 3.7 (3.2–4.2) 4.1 (3.4–4.8)
missing due to pathology 5.9 (4.9–6.8) 8.4 (7.2–9.7) 5.7 (5.0–6.5)
Percentage of adults with ⬎4 mm 21.4 (17.8–25.5) 25.1 (20.2–30.7) 21.0 (17.0–25.5) 21.7 (16.8–27.6) periodontal pocket depth** 14.5 (9.8–21.0) 35.5 (23.4–49.7) 21.6 (17.1– 27.0)
95% CI⫽95% confidence interval for estimated percentage/estimated mean.
*Percentage of participants who have at least one or more decayed surfaces on the crowns of their teeth.
**An indicator for the severity of periodontal disease is measurement of periodontal pocket depths more than 4 mm.
***A Health Care Card is a concession card issued by the Australian Government that entitles the holder to services including public dental care. Source: The National Survey of Adult Oral Health 2004–06. New South Wales.6
Table 5. Utilisation patterns of dental health services by NSW adults by population subgroup
Utilisation patterns All NSW adults Capital city/other Non Health Care Insured/uninsured (%) (95% CI) locations Card holders/Health (%) (95% CI)
(%) (95% CI) Care Card holders (%) (95% CI)
Adults visiting dentist within last 60.3 (58.3–62.2) 63.3 (60.9–65.7) 63.5 (61.3–65.7) 74.2 (71.8–76.6)
12 months 55 (51.7–58.2) 51.4 (47.9–54.8) 48.3 (46.0–50.7)
Adults who attended a private dental 80.8 (78.6–82.7) 82.0 (79.3–84.5) 86.3 (84.2–88.1) 88.0 (85.7–90.0) practice at last dental visit 78.6 (74.9–81.8) 65 (61.2–68.7) 74.4 (71.3–77.2) Adults who visit a dental professional 54.9 (52.5–57.2) 58.8 (55.6–62.0) 58.1 (55.4–60.7) 69.3 (66.2–72.3) at least once a year 47.8 (44.7–50.9) 44.4 (40.3–48.5) 41.1 (38.4–43.8) Adults who have a dentist they usually 81.4 (79.3–83.3) 82.9 (80.5–85.0) 83.4 (81.1–85.5) 90.2 (88.3–91.8)
attend 78.8 (74.8–82.2) 74.8 (71.1–78.2) 72.3 (69.1–75.2)
Adults who usually visit a dentist for a 56.8 (54.4–59.2) 61.1 (57.9–64.3) 61.6 (59.1–64.1) 71.3 (68.3–74.1)
check-up 49.2 (45.6–52.7) 40.4 (36.7–44.1) 42.6 (39.7–45.6)
95% CI⫽95% confidence interval for estimated percentage.
Source: The National Survey of Adult Oral Health 2004–06. New South Wales.6
reached adulthood and who have been exposed to fluori-dated water and fluoride in toothpaste since childhood.
Despite marked reductions in tooth loss and dental decay experience, the burden of oral disease persists with one in four NSW adults having at least one tooth with untreated dental decay and a similar proportion having destructive periodontal disease and oral facial pain. The pervasive nature of oral disease, together with the dramatic increase in retention of natural teeth in adults, has implications for the state dental care system and dental workforce.
Virtually all aspects of oral health measured in this survey were significantly more frequent and severe in Health
Oral heath perceptions All NSW adults Capital city/other Non Health Care Insured/uninsured (%) (95% CI) locations Card holders/Health (%) (95% CI)
(%) (95% CI) Care Card holders (%) (95% CI)
Adults rating their oral health as 16.9 (15.1–18.8) 16.0 (14.0–18.3) 13.2 (11.7–14.9) 11.8 (10.1–13.7)
fair-to-poor 18.4 (15.2–22.2) 29.6 (25.5–34.1) 21.9 (19.4–24.7)
Adults experiencing toothache 16.2 (14.5–18.2) 16.2 (13.9–18.7) 14.4 (12.7–16.2) 14.0 (11.8–16.4) 16.3 (13.8–19.2) 22.6 (19.1–26.6) 18.4 (16.2–20.9) Adults experiencing orofacial pain 23.3 (21.5–25.1) 22.9 (20.7–25.3) 22.9 (20.8–25.0) 21.8 (19.5–24.3) 23.9 (21.2–26.8) 24.7 (21.7–28.0) 24.9 (22.5–27.5) Adults perceiving a need for an 31.1 (29.3–32.9) 29.6 (27.4–31.9) 28.7 (26.6–30.9) 26.3 (24.0–28.9) extraction or filling 33.8 (30.9–36.8) 39.4 (35.6–43.4) 35.9 (33.4–38.5) Adults perceiving urgency for 71.6 (67.7–75.2) 70.6 (65.8–75.0) 71.1 (66.4–75.3) 73.7 (68.5–78.4) treatment (within 3 months) 73.1 (66.3–78.9) 73.4 (67.1–78.9) 69.8 (64.7–74.5)
95% CI⫽95% confidence interval for estimated percentage.
Source: The National Survey of Adult Oral Health 2004–06. New South Wales.6
different Australian jurisdictions, the social gradients and oral health outcomes observed for the NSW population are consistent across Australia.
The NSW Oral Health Strategic Directions sets the plat-form for oral health action in NSW into the next decade and calls for a range of interventions to tackle fundamen-tal causes of disadvantage. Linkages with the National Oral Health Plan, in a nationally coherent approach to dental services priorities and prevention, is supported by this state survey and the national report.9This approach includes a strong emphasis on water fluoridation, one of the few public health measures that reduce the social inequalities in caries experience.10
Providing more equitable access to dental care in the public sector and outside of Sydney remains a challenge. In NSW, holders of Health Care Cards Pensioner Concession Cards and Commonwealth Seniors Health Cards are eligi-ble for public dental care.11Data from Centrelink indicate approximately 1.6 million NSW residents are eligible for public dental care, of which 441 385 are Health Care Card holders and the remainder are Pensioner Concession Card and Commonwealth Seniors Health Card holders. However, only 16% (approximately 457) of the 3472 practicing den-tists in NSW are working in the public dental sector.12
In 2008, new dental awards were gazetted with salary enhancements for dental clinicians and a new career struc-ture that emphasises clinical skills and career pathways to attract and retain clinical staff in the public sector. NSW Health has strategies in place to attract new graduates and dentists to regional areas of NSW to reduce the inequitable distribution of dentists across the state. A new regional dental school training dentists and oral health therapists has been established at Charles Sturt University in Orange.
Although this latest survey provides current information on oral health for a representative sample of the NSW adult population, the small number of people from rural and remote areas enrolled in the survey does not allow spe-cific insight into these localities.6 Similarly, the small number of Aboriginal and Torres Strait Islander Australians included in this survey calls for further surveys with dif-ferent sampling frames. Data collected from such surveys would permit policy development aimed at reducing the inequalities in access to dental services and oral health outcomes for Aboriginal and Torres Strait Islander Australians and residents of rural and remote NSW.
Conclusions
Oral health of the NSW adult population and patterns of dental care are similar to national estimates. Oral disease is disproportionately more frequent among Health Care Card holders, the uninsured and those living outside of Sydney. These groups also have significantly less favourable pat-terns of dental care.
Acknowledgments
The author wishes to acknowledge: the Australian Research Centre for Population Oral Health; the NSW survey team – the dental exam-iners, dental recorders, appointment coordinators; the NSW area health services and Dr Clive Wright, NSW Chief Dental Officer.
References
1. Brennan DS, Spencer AJ, Slade GD. Caries experience among public funded dental patients in Australia, 1995-96: type of care and geographic location. Aust Dent J 2000; 45(1): 37–45. doi:10.1111/j.1834-7819.2000.tb00240.x
2. Brennan DS, Spencer AJ. Adult Dental Programs Survey 2001–02. Adelaide: AIHW Dental Statistics and Research Unit, the University of Adelaide; 2003.
The oral health of adults in NSW, 2004–06
4. Barnard PD. National Oral Health Survey Australia 1987–88. Canberra: Australian Government Publishing Service; 1993.
5. Slade GD, Spencer AJ, Roberts-Thomson KF, editors Australia’s dental generations: the National Survey of Adult Oral Health 2004–06. Dental Statistics and Research Series No. 34. Canberra: Australian Institute of Health and Welfare; 2007.
6. AIHW, Dental Statistics and Research Unit. The National Survey of Adult Oral Health 2004–06. New South Wales. Dental Statistics and Research Series No. 40. Canberra: Australian Institute of Health and Welfare; 2008.
7. Centre for Epidemiology and Research. Report on Adult Health from the 2007 New South Wales Population Health Survey. Sydney: NSW Department of Health; 2008.
8. Centre for Oral Health Strategy. New South Wales Oral Health Strategic Directions 2005–2010. Sydney: NSW Department of Health; 2008.
9. National Advisory Committee on Oral Health. Australia’s National Oral Health Plan 2004–2013. Australian Health Ministers’ Conference, 2004.
10. Slade GD, Spencer AJ, Davies MJ, Stewart JF. Influence of exposure to fluoridated water on socioeconomic inequalities in children’s caries experience. Community Dent Oral Epidemiol 1996; 24(2): 89–100. doi:10.1111/j.1600-0528.1996.tb00822.x
11. NSW Department of Health. Eligibility of Persons for Public Oral Health Services in NSW. Policy Directive PD 2008_006. November 2008. Available at: http://www.health.nsw.gov.au/ policies/pd/2008/PD2008_066.html (Cited 1 March 2009.)