A b s t r a c t. The purpose of this paper is to characterise ae-ration properties of 3 horizons of Arenic Chernozem profiles situa-ted in Tišice (typical for the agricultural production region of Cen-tral Bohemia, Czech-Republic) on the basis of results obtained in the multilateral Austrian-Czech-Hungarian-Polish-Slovak project on the “Assessment of Structure in Agricultural Soils” sponsored by the Austrian Ministry of Science and Research. The paper com-prises results of measurements of different soil aeration properties such as: oxygen diffusion rate (ODR), air-filled porosity (Eg), rela-tive gas diffusion coefficient (D/Do), air permeability (k), and re-dox potential (Eh) as well as dehydrogenase and catalase activity. Undisturbed soil cores (from a depth of 5, 20 and 40 cm) were tes-ted after equilibration on kaolin tension plates with soil water ten-sions 0 (capillary saturation – pF 0), 63 (pF 1.8), 159 (pF 2.2) and 500 hPa (pF 2.7). A significant correlation between the tested parameters was found.
K e y w o r d s: aeration properties, enzyme activity, Arenic Chernozem
INTRODUCTION
Soil enzymes are useful in evaluating the level of bio-logical fertility and, since they are very easy to assay, they are useful indicators in soil microbial studies. Dehydrogena-ses and catalaDehydrogena-ses belong to the group of oxidoreductaDehydrogena-ses and may both be considered as indicators of microbial oxidative activity in soil.
Dehydrogenase activity in soils provides correlative information on biological activity and microbial popula-tions in soil. Dehydrogenases conduct a broad range of oxidative activities that are responsible for decomposition, i.e., dehydrogenation, of organic matter. They represent a class of enzymes that gives us information about the in-fluence of natural environmental conditions on biological activity (Schäffer, 1993).
Since catalase is found in all aerobic microorganisms except for obligatory anaerobes, its activity can inform us about soil aeration status.
Physical conditions of the soil, e.g., water content and aeration influence the microbial populations and their viabi-lity. The effect of soil aeration status on the enzymatic acti-vities can help to understand nutrients transformation in the soil.
The purpose of this paper is to characterise aeration status of one Czech soil on the basis of results obtained in the multilateral Austrian-Czech-Hungarian-Polish-Slovak pro-ject on the ‘Assessment of Structure in Agricultural Soils’ sponsored by the Austrian Ministry of Science and Re-search. The measurements comprised oxygen diffusion rate (ODR), relative gas diffusion (D/Do), air permeability (k), redox potential (Eh) as well as dehydrogenase and catalase activities.
MATERIALS AND METHODS
Soil
The experiments were carried out on the soil from Cen-tral Bohemia situated in a typical region for agricultural pro-duction. The soil profiles are situated at Tišice (district Mélník, about 20 km north-west Prague), on a quaternary fluvial terrace of gravel sand, overlaid by sand. The land-scape is practically plain. The whole experimental area is oc-cupied by the Arenic Chernozems of the carbonate variety (according to FAO-classification system). The undisturbed soil samples from 3 soil pits (T1, T2, T3) were collected from three soil horizons - Ap (0-30) - 5 cm, Ap (0-30) - 20 cm and A/Ck (30-50) - 40 cm.
Aeration properties and enzyme activity on the example of Arenic Chernozem (Tišice)
T. W³odarczyk
1*, J. Gliñski
1, W. Stêpniewski
1,2, Z. Stêpniewska
1, M. Brzeziñska
1, and V. Kurá
31Institute of Agrophysics, Polish Academy of Sciences, Doœwiadczalna 4, P.O. Box 201, 20-290 Lublin 27, Poland 2
Department of Environmental Protection Engineering, Technical University of Lublin, Nadbystrzycka 40, 20-618 Lublin, Poland 3
Department of Irrigation and Drainage, Czech Technical University, Thákurova 7, 166 29 Prague 6, Czech Republic
Received December 1; accepted June 14, 2000
© 2001 Institute of Agrophysics, Polish Academy of Sciences *Corresponding author e-mail: teresa@demeter.ipan.lublin.pl
A A
Agggrrroooppphhyhyysssiiicccsss w
w
Their basic properties are presented in Table 1 and full description and characteristics in the paper by Gliñski (1993).
Measurement methods
Undisturbed soil samples in 100 cm3 brass cylinders were collected in late autumn, 1991 and transported to Lublin in January 92. The measurements of all the above mentioned parameters were made at soil moisture tension of: 0 hPa (capillary saturation), 63 hPa (pF 1.8), 159 hPa (pF 2.2) and 500 hPa (pF 2.7). Undisturbed soil cores repre-senting each horizon after capillary saturation were equili-brated with particular soil moisture tensions on kaolin ten-sion plates. At each equilibrium, a relative gas diffuten-sion coefficient (D/Do) and air permeability (k) were measured. When the measurements were completed, the cylinders were re-saturated and, after subsequent equilibration with the consecutive tension plates, were used to determine oxygen diffusion rate (ODR), redox potential (Eh), and the activity of dehydrogenases and catalases.
The measurement of D/Dowas performed according to the unsteady-state method of Stêpniewski (1983) with the modification of the sample holder described by Stêpniewski (1981) using oxygen as a diffusing agent. The method is also described by Gliñski and Konstankiewicz (1991). The soil core in this method is situated horizontally. Non-shrinking cores in this device are held in the cylinder, but shrinking cores (if they are stabile enough) can also be installed after removing them from the cylinder.
The measurement of air permeability (k) was performed at 10 hPa air pressure with a laboratory permeameter type LPIR-1 produced by the Experimental Department of Me-tallurgy in Cracow. The soil core (in the cylinder) was placed vertically in the device and air was blown through it from the bottom (Gliñski and Stêpniewski 1985, Ballet al.
1981).
The oxygen diffusion rate (ODR) method consists in amperometric measurements of electric current intensity corresponding to oxygen reduction on a platinum cathode placed in the soil and negatively polarised with respect to the reference electrode. The indicator is a measure of potential oxygen availability for plant roots. For the ODR
measure-ment, a device described by Malicki and Walczak (1983), with an automatic control of the effective reduction voltage was used. Four platinum wire electrodes (0.5 mm´4 mm)
were placed at a depth of 2 cm and polarised to -0.65 V versus saturated calomel electrode, during 4 min. The prin-ciple of the method is described in detail by Gliñski and Stêpniewski (1985) and Gliñski and Konstankiewicz (1991).
Redox potential (Eh) was measured potentiometrically using four Pt electrodes (of the same type as for ODR) saturated calomel electrode as the reference electrode, and a laboratory pH-meter (Radiometer, Copenhagen). The elec-trodes were placed at a depth of 2 cm. The measurements were taken after stabilisation of the readings (Gliñski and Stêpniewski, 1985).
Dehydrogenase activity was measured by the method of TTC (2,3,5-triphenyltetrazolium chloride) reduction to for-mazan during incubation for 20 h at 30oC, at pH=8.2 ac-cording to procedure of Casidaet al.(1964).
Catalase activity was measured by manganometric titra-tion of surplus of H2O2under acidic conditions according to the procedure by Johnson and Temple (1964).
Water content, bulk density and particle density were determined by the methods according to Turskiet al.(1983). All analytical results were calculated on the basis of oven-dry (105oC) soil mass.
Observations of the correlation between the investi-gated soil parameters in all horizons, subjected to pre-incu-bation at controlled water content, were confirmed by statistical analysis of variance and regression of data (Tables 2-4). The linear (Y=a+bx), exponential (Y=exp(a+bx)), multiplicative (Y=axb) and reciprocal (1/Y=a+bx) models were used for the description of the analysed relations.
RESULTS AND DISCUSSION
Pre-incubation of the soil material under various moisture conditions differentiated the physical, physico-chemical and biophysico-chemical parameters of the investigated soils. Three horizons of the Arenic Chernozem profiles were investigated.
A decrease of moisture content following changes in the soil moisture tension from 0 to 500 hPa caused changes of the soil aeration status towards oxic conditions. This Profile Horizon - depth
(cm)
Particle size distribution
(mm) Bulk density
(Mg m-3)
pH O.M.
(%)
2000-50 50-2 <2 H2O KCl
T1 T2 T3
Ap (0-30) -5 Ap (0-30) - 20 A/Ck (30-50) - 40
63 59 47
23 23 37
14 18 16
1.59 1.64 1.24
8.8 8.3 9.0
7.9 7.4 8.3
3.6 3.6 1.2
tendency was confirmed by a significant increase of soil oxygenation parameters like: Eg, k, D/Do and ODR (Fig. 1), but there was no significant differentiation in the dehy-drogenase and catalase activity or Eh value (Tables 2 and 3).
Changes of oxygenation parameters – Eg, k, D/Do, ODR and Eh in particular soil horizons of the studied soil are shown in Figs 2-6.
The air filled porosity (Eg) was deeper in higher ho-rizons and increased monotonically with respect to soil moisture tension in the range of 0-500 hPa. The average values of Eg were 0.030, 0.097, 0.128, 0.145 m3m-3at 0, 63, 159 and hPa, respectively (Fig. 2). It is reasonable to assume the air content of above 0.25 m3m-3to be sufficient for good aeration. In the range of air content from 0.10 to 0.25 m3m-3,
aeration may be deficient under some conditions while the air contents below 0.10 m3 m-3 characterised decidedly deficient aeration (Gliñski and Stêpniewski, 1985). This indicated that the investigated soil displayed decidedly deficient aeration conditions at 0 and 63 hPa and aeration may be deficient at 159 and 500 hPa. Analysis of variance did not show any significant differences between the horizons (Table 2) but differences between soil moisture tension levels were found (Table 3). Air-filled porosity (Eg) showed an obvious negative correlation with water content by weight (Table 4).
Air permeability for the studied horizons slowly in-creased with soil moisture tension (Fig. 3). In all the hori-zons saturated with water (0 hPa) the k values were equal
Factor/
parameter Eg k D/Do ODR Eh
Dehydro-genase Catalase
Depth n.s. n.s. n.s. n.s. + + +
s.m. tension + + + + n.s. n.s. n.s.
Explanation: + indicates significant differences, n.s. - no significant differences.
T a b l e 2.Significance of the effect of sampling depth and of soil moisture tension (s.m.) on the individual studied particular parameter
Soil moisture
tension(contrast) Eg k D/Do ODR Eh
Dehydro-genase Catalase
0 - 63 0 - 159 0 - 500 63 - 159 63 - 500 159 - 500
+ + + n.s.
+ n.s.
+ + + n.s.
+ n.s.
n.s. + + n.s.
+ n.s.
n.s. + + + + +
n.s. n.s. n.s. n.s. n.s. n.s.
n.s. n.s. n.s. n.s. n.s. n.s.
n.s. n.s. n.s. n.s. n.s. n.s.
Explanation: + denotes a statistically significant increase, with tension increase; n.s. - no significant differentiation.
T a b l e 3.Statistically significant differences in the tested parameters between individual soil moisture tension of the Arenic Chernozem horizons
Parameter D/Do ODR Eg Water content by mass
k 0.92***
y = a + bx
0.81*** y = a + bx
0.72** y = a + bx
-0.60* y = a + bx
D/Do 0.79**
y = a + bx
0.59* y = a + bx
n.s.
ODR 0.79**
y = e(a+bx)
-0.70* y = e(a+bx)
Eg -0.97***
y = a + bx
* - significant at P <0.05, ** - significant at P <0.01, *** - significant at P <0.001, n.s. - no significant differentiation.
zero. The k values were 8.48, 10.08 and 14.61mm2at 63, 159 and 500 hPa, respectively. Analysis of variance did not show significant differences between the horizons (Table 2), while such differences between 0 hPa and remaining soil moisture tensions were observed (Table 3). Air permeability (k) was positively correlated with D/Do, ODR, Eg and negatively correlated with water content for all the horizons taken together (Table 4).
A supplementary indicator of the soil oxygenation sta-tus is relative gas diffusion coefficient (D/Do). This para-meter showed a monotonic change in the range of 0-500 hPa. A relative gas diffusion coefficient was higher in deeper horizons and increased with an increasing soil water tension (Fig. 4). In all the horizons saturated with water (0 hPa), the D/Dovalues were equal to zero. The average values of D/Do were 0, 0.0093, 0.0154 and 0.0259 at 63, 159 and 500 hPa, respectively. Literature quote D/Do = 0.005 as a lower critical value corresponding to low respiration activities, and D/Do= 0.02 as the upper value for the highest respiration rates (Gliñski and Stêpniewski, 1985). Relating these threshold values to the studied soil, we can confirm that there were favourable conditions for gas exchange at the highest respiration rates only at the soil moisture tension of 500 hPa. For low respiration rates, gas exchange is sufficient already at 63 hPa. Analysis of variance did not show any significant differences between the horizons (Table 2) but such differences between soil moisture tensions were found (Table 3). The relative gas diffusion (D/Do) was positively correlated with ODR and Eg for the three horizons considered together (Table 4).
All three horizons studied showed a relatively high level of oxygen diffusion rate (Fig. 5). A typical tendency towards
(X 1E-3)
0 63 159 500
0
0 -7
0.03
30 3
0.06
60 0.09
90 13
0.12
120 0.15
150 23
0.18
180 33
Eg
(m
m
)
3-3
0
0 0
63
63 63
159
159 159
500
500 500
Soil water tension (hPa) Soil water tension (hPa)
-3 1 5 9 13 17 21
km
)
m
2
ODR
(
g
m
s
)
m
-2
-1
D/D
o
Fig. 1.Statistically significant differences in the tested parameters (Eg, k, D/Doand ODR) between individual soil water tension levels.
0 0,05 0,1 0,15 0,2
Eg
(m
3 m -3 )
0 63 159 500
Soil water tension (hPa)
5 cm 20cm 40cm
the ODR increase with increasing soil moisture tension levels was observed in all the horizons. The values of ODR showed an abrupt increase in the range of soil water tension of 63-169 hPa. The average value of ODR at 0 hPa(23.3mg m-2s-1) differed significantly from the value at 63 hPa (42.9 mg m-2s-1), at 159 hPa (118.7 mg m-2s-1) and at 500 hPa (147.3mg m-2s-1). The critical ODR value, usually consi-dered to be below 30 g m-2s-1, can be expected only at the soil water tension of 0 hPa in the all horizons and below 63 hPa in the deeper horizons. The analysis of variance did not show any significant differences between the horizons (Table 2) but significant differences between soil moisture tensions were observed (Table 3). Oxygen diffusion rate (ODR) was positively correlated with Eg and negatively correlated with water content in all the horizons taken together (Table 4).
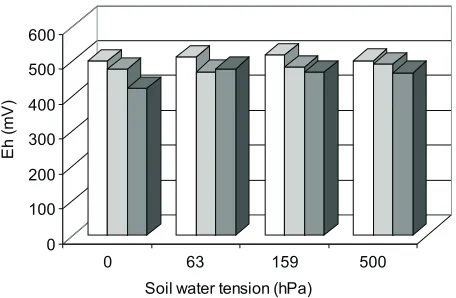
The investigated soil was characterised by high redox potential values, which never dropped below 400 mV irre-spective of soil water tension in any soil horizons (Fig. 6).
This suggests high soil redox resistance, related to numerous soil properties (Gliñski and Stêpniewska, 1986). None of the soil water tension levels reached Eh below 400 mV corre-sponding to the initiation of nitrate reduction (Stêpniewska, 1988). The reason for high levels of Eh may be the presence of nitrates. It has been found (Bailey and Beauchamp, 1971; Gliñski et al.,1990; Gliñskiet al.,1991), that soil amen-dment with nitrates maintains soil redox potential for a cer-tain period constant and delays reduction of Mn (IV) and Fe (III) compounds. Analysis of variance showed significant differences between the horizons (Fig. 7) and lack of significant differences between particular soil moisture tension levels (Tables 2 and 3).
Dehydrogenase activity varied widely in the tested ho-rizons (Fig. 8). The enzyme activity decreased with depth and with the increase of the soil moisture tension. The highest dehydrogenase activity (0.0140 nmol formazan 0
4 8 12 16 20
0 63 159 500
Soil water tension (hPa)
Fig. 3. Air permeability (k) of the three horizons of Arenic Chernozem incubated at particular soil water tension levels. Explanations as in Fig. 2.
k(
m
m
2)
0 0,01 0,02 0,03 0,04
D/Do
0 63 159 500
Soil water tension (hPa)
Fig. 4. Relative gas diffusion coefficient (D/Do) of the three horizons of Arenic Chernozem incubated at particular soil water tension levels. Explanations as in Fig. 2.
0 20 40 60 80 100 120 140 160
0 63 159 500
Soil water tension (hPa)
Fig. 5. Oxygen diffusion rate (ODR) of the three horizons of Arenic Chernozem incubated at particular soil water tension levels. Explanations as in Fig. 2.
0 100 200 300 400 500 600
E
h
(mV
)
0 63 159 500
Soil water tension (hPa)
Fig. 6. Redox potential (Eh) of the three horizons of Arenic Chernozem incubated at particular soil water tension levels. Explanations as in Fig. 2.
ODR
(
m
gm
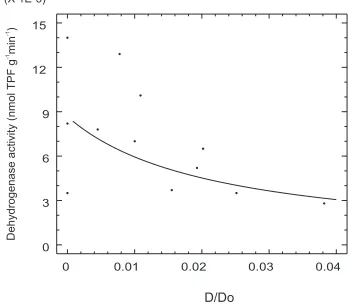
g-1min-1) occurred in the surface horizon pre-incubated at full saturation with water, and the lowest (0.0028 nmol formazan g-1min-1) - in A/Ck horizon, after pre-incubation at the soil moisture tension of 500 hPa. The second horizon exhibited dehydrogenase activity from 0.0082 nmol forma-zan g-1min-1in the soil pre-incubated at full saturation with water to 0.0065 nmol formazan g-1min-1after pre-incuba-tion at the soil moisture tension of 500 hPa. The third horizon showed dehydrogenase activity from 0.0035 to 0.0028 nmol formazan g-1min-1in the material pre-incu-bated at the soil moisture tension of 0 and 500 hPa, respectively. The influence of soil moisture tension on dehy-drogenase activity was lower in the deeper horizons as com-pared to the upper one. Analysis of variance showed statis-tically significant differences only between the deepest horizon and the two others (Fig. 9) and no significant dif-ferences between soil moisture tension levels were found
(Tables 2 and 3). Dehydrogenase activity was correlated positively with D/Do(r = 0.65*) (Fig. 10). Irrespective of the soil horizon, dehydrogenase activity in general showed a decreasing tendency with a decrease in soil moisture content, but it was not statistically significant. The highest activity was observed in the water saturated material and the lowest in the material pre-incubated at the soil moisture tension of 500 hPa. The range of the average (all horizons) values of enzyme activity was from 0.00483 nmol formazan g-1min-1(for 500 hPa) to 0.00857 nmol formazan g-1min-1 (for 0 hPa). The phenomenon of changes in dehydrogenas e activity, relating to the soil aeration status had been observed earlier (Gliñskiet al.,1983; Gliñskiet al.,1986; Pedrazzini and McKee, 1984; Stêpniewskiet al.,1993; Brzeziñskaet al.,1998).
Catalase activity varied widely in the tested horizons (Fig. 11). The highest catalase activity (73.9mmol KMnO4
Soil depth (cm)
5 20 40
0 150 300 450 600
Eh
(mV)
Fig. 7.Statistically significant differences in redox potential (Eh) between the three horizons of Arenic Chernozem.
0 0,004 0,008 0,012 0,016
D
ehy
dr
ogenas
e
a
c
ti
v
it
y
(n
mo
l
T
P
F
g
-1
mi
n
-1 )
0 63 159 500
Soil water tension (hPa)
Fig. 8.Dehydrogenase activity of the three horizons of Arenic Chernozem incubated at particular soil water tension levels. Explanations as in Fig. 2.
Soil depth (cm)
0 3 6 9 12 15
Dehydrogenas
e
activity
(nmol
TPF
g
min
)
-1
-1
(X 1E-3)
5 20 40
Fig. 9.Statistically significant differences in dehydrogenase acti-vity between the three horizons of Arenic Chernozem.
0 0.01 0.02 0.03 0.04
D/Do
0 3 6 9 12 15 (X 1E-3)
Dehydrogenas
e
activity
(nmol
TPF
g
min
)
-1
-1
g-1) was found in the surface horizons pre-incubated at the soil moisture tension of 0 and 63 hPa, and the lowest (32.6 mmol KMnO4g-) - in the third A/Ck horizon, after pre-incu-bation at the soil moisture tension of 159 hPa. The second horizon showed a little differentiation in enzyme activity relating to moisture tension. The third horizon showed catalase activity from 43.8 to 32.6mmol KMnO4g-1in the treatment pre-incubated at soil moisture tension of 0 and 159 hPa, respectively. The range of average (all horizons) values of enzyme activity was from 53.7mmol KMnO4g-1(for 500 hPa)to 56,9mmol KMnO4g-1(for 0 hPa). The influence of soil moisture tension on catalase activity was lower in the deeper horizons as compared to the top horizon. The enzyme activity decreased with soil depth. Analysis of variance showed significant differences among the horizons (Fig. 12) and no significant differences between particular soil moisture tension levels were found (Tables 2 and 3). Catalase activity was positively correlated with Eh (r =
0.70*) (Fig. 13). CONCLUSIONS
Characteristics of properties that related to aeration in particular soil horizons of the Arenic Chernozem profiles demonstrated their differentiation with soil depth and water tension level. In particular it was found out that:
1. Air-filled porosity increased from 0.005 m3m-3 (volume of the entrapped air) at full water saturation in the upper horizons to about 0.18 m3m-3at 500 hPa.
2. Air permeability, was the lowest in the deepest horizon.
3. Gas diffusion (D/Do)unlike k, was the best in the deepest soil horizon; restricted gas diffusion in the profile can be expected at the soil water tension <80 hPa.
4. ODR values showed an abrupt increase in the range of soil water tension of 63-159 hPa. The critical values being expected only at soil water tension <60 hPa.
5. All aeration parameters were interrelated and showed correlation with soil water content (except of D/Doand Eh).
6. Dehydrogenase and catalase activity varied widely in the tested horizons and decreased with soil depth. Dehydro-genase activity was correlated positively with D/Do and catalase activity was positively correlated with Eh.
REFERENCES
Bailey L.D. and Beauchamp E.G., 1971.Nitrate reduction and redox potentials measured with permanently and tem-porarily placed platinum electrodes in saturated soils. Can. J. Soil Sci., 51, 51-58.
Brzeziñska M., Stêpniewska Z., and Stêpniewski W., 1998.Soil oxygen status and dehydrogenase activity. Soil Biol. Bio-chem., 30, 13, 1783-1790.
Ball B.B., Harris W., and Burford J.R., 1981. A laboratory method to measure gas diffusion and flow in soil and other porous materials. J. Soil Sci., 32, 323.
Casida L.E., Klein D.A., and Santoro T., 1964.Soil dehydro-genase activity. Soil Sci., 98, 371-376.
Soil depth (cm)
5 20 40
0 16 32 48 64 80
Catalase
activity
m
mol
KMnO
g
)
4
-1
Fig. 12. Statistically significant differences in catalase activity between the three horizons of Arenic Chernozem.
420 440 460 480 500 520
Eh (mV)
32 42 52 62 72 82
Catalase
activity
m
mol
KMnO
g
)
4
-1
Fig. 13.Correlation between catalase activity versus redox poten-tial (Eh) for the three horizons and all soil water tension levels.
0 20 40 60 80
0 63 159 500
Soil water tension (hPa)
Fig. 11.Catalase activity of the three horizons of Arenic Cher-nozem incubated at particular soil water tension levels. Expla-nations as in Fig. 2.
Catalase
activity
(µmol
KMnO
4
g
Gliñski J., 1963.General characteristics of soils included to the multilateral programme. Int. Agrophysics, 7, 99-116.
Gliñski J. and Konstankiewicz K., 1991. Methods and instruments for agrophysical research (in Polish). Problemy Agrofizyki, 64.
Gliñski J., Stahr K., Stêpniewska Z., and Brzeziñska M., 1991.
Changes of redox and pH conditions in a flooded soil amended with glucose and nitrate under laboratory conditions. Z. Pflanzenernähr. Bodenk., 155, 13-17.
Gliñski J., Stêpniewska Z., and Stêpniewski W., 1990.
Indicators of soil aeration. Ernst-Schlichtng-Gedächtnis-Kolloquium, Tagungsband 75-85, Hohenheim.
Gliñski J. and Stêpniewska Z., 1986. An evaluation of soil resistance to reduction processes. Polish J. Soil Sci., 19, 15-19.
Gliñski J. and Stêpniewski W., 1985.Soil Aeration and its Role for Plants. CRC Press, Boca Raton, Florida.
Johnson J.L. and Temple K., 1964.Some variables affecting the measurement of catalase activity in soil. Soil Sci. Soc. Am.
Proc., 28, 207-209.
Malicki M. and Walczak R., 1983.A gauge for the redox poten-tial and the oxygen diffusion rate in the soils with an auto-matic regulation of cathode potential. Zesz. Probl. Post. Nauk Roln., 220, II, 447-452.
Shäffer A., 1993.Pesticide effects on enzyme activities in soil ecosystem. In: Soil Biochemistry. (Eds J.M. Bollag and G. Stotzky). M. Dekker, Inc. New York, Basel, Hong Kong, 8, 237-340.
Stêpniewska Z., 1988.Redox features of mineral soils of Poland (in Polish). Problemy Agrofizyki, 56.
Stêpniewski W., 1981.Gas diffusion and strength as related to soil compaction. II. Oxygen diffusion coefficient. Polish J. Soil Sci., 14, 3-13.
Stêpniewski W., 1983.Gas diffusion in a silty brown soil. Zesz. Probl. Post. Nauk Roln., 220, 559-567.