RESEARCH NOTE
OPTIMIZATION OF HFDS PRODUCTION
FROM DATE SYRUP
M. Jamshidi Mokhber, I. Alemzadeh* and M. Vossoughi
Chemical and Petroleum Engineering Department, Sharif University of Technology P.O. Box 11365-6891, Tehran, Iran
[email protected] - [email protected] – [email protected]
*Corresponding Author
(Received: October 24, 2007 – Accepted in Revised Form: January 30, 2008)
Abstract Fructose is utilized as a common sweetener in many food industries. Today, a large amount of HFCS (high fructose corn syrup, an equilibrium mixture of glucose and fructose) is produced by glucose isomerase, immobilized enzymes from corn starch. There are a lot of date palms in Iran. Date is a favorable source of carbohydrates, and a suitable source for HFDS (high fructose date syrup) production. In this investigation, date syrup properties were first determined and the operational conditions for glucose isomerase application were optimized respectively. Ion exchange chromatography has been utilized for carbohydrate separation. Fructose obtained from chromatographic column reached 90 % fructose syrup and glucose obtained was converted to fructose (42 % conversion) in a fixed bed glucose isomerase enzyme reactor. A mixture of this equilibrium syrup with fructose syrup obtained from chromatographic column produced 55 % fructose syrup.
Keywords High Fructose Date Syrup (HFDS), Chromatographic Column, Enzyme Reactor, Glucose Isomerase, Ion Exchange Chromatography, Date Palm
ﻩﺪﻴﮑﭼ
ﻲﻣﻑﺮﺼﻣﻲﻳﺍﺬﻏﻊﻳﺎﻨﺻﺯﺍﻱﺭﺎﻴﺴﺑﺭﺩﻝﻭﺍﺪﺘﻣﻩﺪﻨﻨﻛﻦﻳﺮﻴﺷﻚﻳﻥﺍﻮﻨﻋﻪﺑﺯﻮﺘﻛﻭﺮﻓ ﺩﻮﺷ
. ﺭﺍﺪﻘﻣﻩﺯﻭﺮﻣﺍ
ﺖﺳﺍﺯﻮﺘﻛﻭﺮﻓﻭﺰﻛﻮﻠﮔﻲﻟﺩﺎﻌﺗﻁﻮﻠﺨﻣﻪﻛﺯﻮﺘﻛﻭﺮﻓﺯﺍﻲﻨﻏﺖﺑﺮﺷﺯﺍﻱﺩﺎﻳﺯ ﻪﮐ
ﺮـﻣﻭﺰﻳﺍﺰﻛﻮـﻠﮔﻢﻳﺰـﻧﺁﻪﻠﻴﺳﻮﺑ ﺯﺍ
ﻲﻣﺪﻴﻟﻮﺗﺕﺭﺫﻪﺘﺳﺎﺸﻧ ﺩﻮـﺷ
.
ﻱﺩﺎـﻳﺯﺭﺍﺪـﻘﻣﻱﺍﺭﺍﺩﻥﺍﺮـﻳﺍﺭﻮﺸـﻛ
ﺯﺍﺭﺎـﺷﺮﺳﻲـﻌﺒﻨﻣﻪـﻛﺖـﺳﺍﺎـﻣﺮﺧﻝﻮﺼـﺤﻣ
ﺖﺳﺎﻬﺗﺍﺭﺪﻴﻫﻮﺑﺮﻛ
.
ﻲـﻣﺯﻮـﺘﻛﻭﺮﻓﺯﺍﻲﻨﻏﺖﺑﺮﺷﺪﻴﻟﻮﺗﻱﺍﺮﺑﻲﺒﺳﺎﻨﻣﻊﺒﻨﻣﻭﺭﻦﻳﺍﺯﺍ ﺪـﺷﺎﺑ
. ﺍﺪـﺘﺑﺍ،ﻖـﻴﻘﺤﺗﻦـﻳﺍﺭﺩ
ﻪـﻨﻴﻬﺑﺯﺍﺮـﻣﻭﺰﻳﺍﺰﻛﻮـﻠﮔﻢﻳﺰﻧﺁﺩﺮﺑﺭﺎﻛﻱﺍﺮﺑﻲﺗﺎﻴﻠﻤﻋﻂﻳﺍﺮﺷﺲﭙﺳﻩﺪﺷﻦﻴﻴﻌﺗﻭﻱﺮﻴﮔﻩﺯﺍﺪﻧﺍﺎﻣﺮﺧﺖﺑﺮﺷﺹﺍﻮﺧ ﺖﺳﺍﻩﺪﺷ
.
ﺎﺒﺗﻲﻓﺍﺮﮔﻮﺗﺎﻣﻭﺮﻛﺯﺍ
ﺍﺪﺟﻱﺍﺮﺑﻲﻧﻮﻳﻝﺩ
ﺖـﺳﺍﻩﺪـﺷﻩﺩﺎﻔﺘـﺳﺍﺎﻬﺗﺍﺭﺪـﻴﻫﻮﺑﺮﻛﻱﺯﺎﺳ
. ﺯﻮـﺘﻛﻭﺮﻓﺖﺑﺮـﺷ
ﻥﺍﺰﻴﻣﻪﺑﻲﻓﺍﺮﮔﻮﺗﺎﻣﻭﺮﻛﻥﻮﺘﺳﺯﺍﻩﺪﻣﺁﺖﺳﺪﺑ ۹۰
ﻲـﻣﺯﻮﺘﻛﻭﺮﻓﺯﺍﻲﻨﻏﺪﺻﺭﺩ
ﺍﺪـﺟﺰﻛﻮـﻠﮔﻭﺪـﺷﺎﺑ
ﻩﺪـﺷﻱﺯﺎـﺳ
ﻥﺍﺰـﻴﻣﻪـﺑﻲـﻤﻳﺰﻧﺁﺖﺑﺎﺛﺮﺘﺴﺑﺭﻮﺘﻛﺍﺭﻚﻳﺭﺩﺯﺍﺮﻣﻭﺰﻳﺍﺰﻛﻮﻠﮔﻢﻳﺰﻧﺁﻪﻠﻴﺳﻮﺑ،ﻲﻓﺍﺮﮔﻮﺗﺎﻣﻭﺮﻛﻂﺳﻮﺗ ۴۲
ﻪـﺑﺪـﺻﺭﺩ
ﺮﻓ
ﻲﻣﻞﻳﺪﺒﺗﺯﻮﺘﻛﻭ ﺩﻮﺷ
. ﺯﻮـﺘﻛﻭﺮﻓﺎﺑ،ﻲﻤﻳﺰﻧﺁﺭﻮﺘﻛﺍﺭﺯﺍﻩﺪﻣﺁﺖﺳﺪﺑﺯﻮﺘﻛﻭﺮﻓﻭﺰﻛﻮﻠﮔﻲﻟﺩﺎﻌﺗﺖﺑﺮﺷﺯﺍﻲﻃﻮﻠﺨﻣ
ﺍﺪﺟ ﺖﻈﻠﻏﺎﺑﻲﺘﺑﺮﺷﻲﻓﺍﺮﮔﻮﺗﺎﻣﻭﺮﻛﻥﻮﺘﺳﺭﺩﻩﺪﺷﻱﺯﺎﺳ ۵۵
ﻲﻣﺪﻴﻟﻮﺗﺯﻮﺘﻛﻭﺮﻓﺪﺻﺭﺩ ﺪﻨﻛ
.
1. INTRODUCTION
The fruit Date is produced largely in hot regions of South West Asia and North Africa, this fruit is full of carbohydrates as a rich source of calories. Date and its by products are used in food and pharmaceutical industries such as ethanol, citric acid, baker yeast and high fructose date syrup (HFDS) production [1].
The world production of date has increased to 5.4 million tones in 2002 and 65 percent of world
production is produced in Persian Gulf region. Iran which produces 18 percent of global date production, is a major date producing country [1,2]. The date crop in Iran during the farming year 1999-2000 was over one million tones but Iran exported only 100,000 tones during 1999-2000 and date consumption was only 100-200 thousand tones, therefore a large portion of date is unused in the country [3,4].
syrup replaced sucrose. Today, high fructose syrup is used as sweetener in many countries such as USA, Canada, European Community, Japan, South Korea and Argentina. The world production of high fructose syrup has increased from 3 million tones in 1980 to 8 million in 1995 and 12 million in 2004 [5,6]. The most common raw material used for the production of HFCS is corn starch. The production of HFCS from starch comprises of three major processes: liquefaction of starch by α-amylase, saccharification of starch by the combined action of amyloglocosidase along with pullulanase and isomerization of glucose by glucose isomerase [7]. The successful development of fructose syrup production lies in the discovery of glucose-isomerizing enzyme. Isomerization of glucose to fructose using glucose isomerase is an equilibrium reaction; this reaction produces syrup containing 42 % fructose and 58 % glucose which is commonly used in sport drinks. Other typical types of HFCS are: HFCS 90 (most commonly used in baked goods) which is approximately 90 % fructose and 10 % glucose; HFCS 55 (most commonly used in soft drinks) which is approximately 55 % fructose and 45 % glucose. HFCS 55 is comparable to sucrose and HFCS 90 is sweeter than sucrose as fructose is sweeter than glucose [7]. These syrups are produced with ion exchange chromatography. A liquid chromatography method known as simulated moving bed (SMB) chromatography is the most economical method for an industrial-scale process. It needs an industrial separator technology that is being used in sugar industry to separate glucose and fructose [8,9].
Date is a source of fructose and glucose which could be separated by ion exchange chromatography column, then glucose could be converted to equilibrium mixture of fructose and glucose in isomerization column [10,11].
In this investigation, date syrup was analyzed, 90 % fructose syrup was produced by ion exchange chromatography column using date syrup and residual glucose was isomerized using immobilized glucose isomerase column.
2. MATERIAL AND METHODS
2.1. Materials
Glucose Isomerase Sweetzyme Tfrom Streptomyces murinus was obtained from NOVO Nordisk, Ion exchange resin Amberlite CR1320Ca was obtained from Rohm and Hass and date syrup from Khorma-bon-jonoob.
2.2. Methods
Iranian date syrup was analyzed and its properties such as Brix, density, calcium, protein and carbohydrates content were determined following the procedures [12]. EDTA method was used for calcium determination and Nelson-somogy and Cystein-carbazol methods were used for carbohydrates determination following the procedure used by also HPLC method for more accuracy [12]. Molisch test was used for carbohydrates determination for chromatography column effluent [12,13].Enzyme assay: The enzyme reaction mixture contained 50 ml of Tris buffer (pH = 7.5), 9 g glucose (1M), 0.5 ml MgSO4.7H2O (1M) as
cofactor and 0.1 ml Na2S2O5 (1M) [14]. One unit
of immobilized glucose isomerase activity (GI) was defined as micromoles of fructose produced per minute at 60˚C and pH = 7.5. The reaction was stopped by separating enzyme and adding 1 ml of 0.5 N perchloric acid to 9 ml of reaction mixture, and produced fructose was determined with HPLC or Cystein–carbazol method [14].
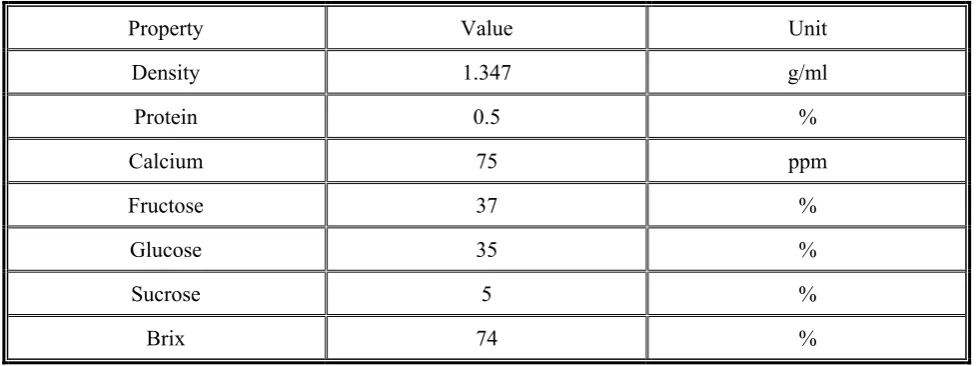
TABLE 1. The Properties of Experimented Date Syrup.
Property Value Unit Density 1.347 g/ml
Protein 0.5 % Calcium 75 ppm
Fructose 37 %
Glucose 35 %
Sucrose 5 %
Brix 74 % determined after 30 minutes [14].
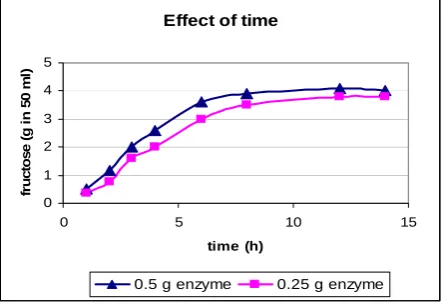
Isomerization was studied for 14 hours under optimum operational conditions. In this step two quantities of enzyme, 0.25 g and 0.5 g enzyme in 50 ml reaction mixture were examined.
Ion exchange chromatography: Glass column with the diameter of 3 cm and length of 40 cm was packed homogeneously with the ion exchange resin Amberlite CR1320Ca by slurry method [15], in this method slurry of resin in deionized water was poured into the column and the excess water was drained from the bottom of column. The packed height of glass chromatography column was generally 30 cm and bed volume was 200 ml. To optimize feed concentration, three synthetic solution of glucose and fructose (50% w/w) with the concentration of 40, 80 and 90 g/l was injected to the column (10 ml or 5 percent of bed volume), then the column was rinsed with 5 ml/min deionized water for 75 minutes and the column effluent was collected in small sampling tubes from 5 to 60 minutes after rinsing the chromatography column. The eluted fractions were first determined by molisch test and then by HPLC method for more accuracy [13].
Date syrup with optimum feed concentration was injected to the column under the same conditions and the column effluent was collected and analyzed by molisch test and HPLC method. The operational condition was temperature 35˚C. Batch isomerization of glucose: Fructose rich
product from chromatography column was used as 90 % fructose syrup and glucose rich product was used as isomerization feed. Glucose obtained from chromatography column was concentrated by a vacuum evaporator until the volume was reduced to one fifth of its initial volume, this syrup with concentration of 116 g/l glucose and 18 g/l fructose (86 % glucose and 14 % fructose) was a suitable feed for isomerization column. Enzyme was added to 50 ml of concentrated glucose syrup and maintained at 60°C and pH = 7.5, the production of fructose was measured at different intervals, for 14 hours.
Continuous isomerization: Glass column with a diameter of 3 cm was packed with glucose isomerase Sweetzyme T to the height level of 30 cm and concentrated glucose syrup obtained from vacuum evaporator was pumped through the column. Hot water (60˚C) also was pumped through water jacket which surrounded the column for fixing temperature and the effluent was collected and determined by HPLC. Four different feed flow rates (4,6,8 and 10 ml/min) were pumped through the column, to optimize the feed flow rate.
3. RESULTS AND DISCUSSION
optimum temperature
0 100 200 300 400
40 50 60 70 80 90
T ('C)
En
z
y
m
e
un
it
stability temp activity temp
Figure 1. The effect of temperature on activity and stability of immobilized glucose isomerase, pH = 7.5.
optimum pH
0 50 100 150 200
5 6 7 8 9
pH
E
n
z
y
m
e
u
n
it
stability pH activity pH
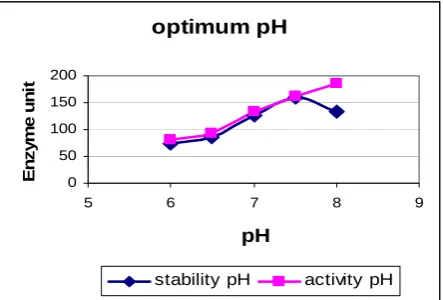
Figure 2. The effect of pH on activity and stability of immobilized glucose isomerase at 60˚C.
including density, Brix, calcium, protein and carbohydrates for 100 g date syrup [12,13].
3.1. Optimization of Operational Conditions
Figure 1 shows the effect of temperature on enzyme activity and stability. Enzyme activity increases with temperature to 70˚C but enzyme stability decreases after 60˚C. Enzyme activity was measured after 30 minutes, but for stability, the activity was measured after 2 hours, so the difference for reduction of stability comparing to activity is the length of time. The optimum temperature was selected 60˚C, because enzyme column must be used for a long period of time. Figure 2 presents the optimum pH for enzyme activity and stability. The optimum pH for stabilitywas 7.5 and for activity was 8 as it is shown in Figure 2.
Figure 3 shows the effect of time on fructose production under experimental conditions, 12 hours is the optimum time in fructose production.
Effect of time
0 1 2 3 4 5
0 5 10 15
time (h)
fr
u
c
to
s
e
(
g
in
5
0
m
l)
0.5 g enzyme 0.25 g enzyme
Figure 3. The effect of time on glucose isomerization using glucose isomerase at 60˚C, pH = 7.5 and initial glucose concentration was 9 g in 50 ml.
glucose & fructose (feed 1: 40gr/lit)
0 20 40 60 80 100
15 18 25 32 35
time (min)
pe
rc
ent % glucose
% fructose
Figure 4. Percents of carbohydrates in the chromatography column effluent for 40g/l synthetic mixture of glucose and fructose at 35˚C.
minutes. Figure 5 presents the percents of glucose and fructose in fructose rich product for three synthetic solution of 40, 80 and 90 g/l. Fructose obtained from chromatography column after 35 minutes was 76 percent for feed 1 (40 g/l) and 87 percent for feed 2 (80 g/l) and 83 percent for feed 3 (90 g/l), so the optimum feed concentration for these solutions was 80 g/l.
Date syrup with the concentration of 80 g/l was injected to the column and the effluent was collected and the concentration of sugars determined by HPLC method. Sucrose eluted the column at first, then glucose and fructose respectively.
Figure 6 shows the percentages of carbohydrates in the effluent of chromatography column with time. Fructose was 87 percent in column effluent after 35 minutes and glucose was 85 percent after 15 minutes. These figure present changes in the percentages of glucose and fructose in the eluted fractions.
optimum feed concentration
0 20 40 60 80 100
feed concentration (gr/ lit)
s
uga
r pr
c
e
nt
s
i
n
pr
oduc
t
% fructose
%glucose
% fructose 76 87 83
%glucose 24 13 17 40 80 90
Figure 5. Percents of carbohydrates in fructose rich product, column effluent after 35 minutes for three synthetic mixtures of glucose and fructose at 35˚C.
date syrup (80 gr/lit)
0 20 40 60 80 100
15 20 25 30 35
time (min)
p
e
rcen
t
% glucose % fructose
Figure 6. Percents of carbohydrates in the chromatography column effluent for initial date syrup of 80g/l at 35˚C.
evaporator, such as 50 ml of this glucose syrup contained 86 % glucose and 14 % fructose. Figure 7 presents glucose consumption and fructose production with time on a batch scale; the reaction was in equilibrium after 12 hours.
Concentrated glucose rich product from date syrup chromatographically was pumped through the enzyme column with different flow rates. Figure 8 shows glucose consumption and fructose production in isomerization column with different feed flow rate. As it is shown in this figure, the optimum flow rate was 4 ml/min. Fructose production and glucose consumption was optimum at this flow rate and the equilibrium syrup of glucose and fructose was
produced. At lower flow rates, increasing in the settling time of equilibrium syrup of glucose and fructose in enzyme column led to some by-products production such as psicose [16].
4. CONCLUSION
Isomerization of glucose rich from date syrup with time (batch scale)
0 1 2 3 4 5 6 7
0 2 4 6 8 10 12 14 16
time (hr)
g
ram
su
g
a
r in
50 m
l
fructose
glucose
Figure 7. Glucose consumption and fructose production in 50 ml of concentrated glucose syrup obtained from date syrup in the presence of GI in batch scale (glucose syrup contained 116 g/l glucose and 18 g/l fructose)
T = 60˚C and pH = 7.5.
Isomerization of glucose rich from date syrup in enzyme column
0 1 2 3 4 5 6
fe e d flow rate (ml/min)
g
ram
i
n
50
m
l
fructose
glucose
fructose 3.2 2.9 2.55 1.85 glucose 3.5 3.8 4.15 4.85
4 6 8 10
Figure 8. Glucose consumption and fructose production in 50 ml of enzyme column effluent for concentrated glucose syrup obtained from date syrup isomerization (glucose syrup contained 116 g/l glucose and 18 g/l fructose)
T = 60˚C and pH = 7.5.
Optimum operational conditions for enzyme activity and stability of glucose isomerase (NOVO NORDISK) were determined: temperature 60˚C and pH 7.5.
Date syrup is a mixture of carbohydrates: sucrose, glucose and fructose. In ion-exchange chromatography column, sucrose eluted the column at first, then glucose and fructose respectively. Glucose and fructose form complexes with calcium ion of resin with different stabilities, so fructose eluted the column at last because fructose-calcium
5. ACKNOWLEDGMENTS
This research was supported by Hi-Tech industries center, Iran ministry of industries and mines.
6. REFRENCES
1. Botes, A. and Zaid, A., “The Economic Importance of date Production and International Trade, Date Production Support Program”, FAO Corporate Document Repository, Agriculture Department, Rome, Italia, http://www.fao.org/DOCREP/006/Y4360E/y4360e07.htm, (June 2002).
2. Al-Bazzaz, S., “Global Date Production at Risk Due to Pests and Diseases”, www.Fao.org/Newsroom, Last Modified, (July 13, 2004).
3. Iranian Date and its Market in the World, “Iran Ministry of Commerce on the Web”, www.Iccim.org/English/ magazine/iran_commerce/no1_2001/22.html, Last modification, (October 2001).
4. Iran Nap Co., “Ltd.”, www.no-2.com/dates/index.html, (October 2001)
5. Forristal Linda, J., “Wise Traditions in Food, Farming and the Healing Arts”, The Quarterly Magazine of the Weston A. Price Foundation, Vol. 2, No. 3, (2001),
16-20.
6. World Corn Sweetener Production, “Consumption and Prices”, U. S. Department of Agriculture and Economic Research Service Report, http://findarticles.com/p/articles/ mi_m3796/ai_12092442/pg_5, (June 1991).
7. Snehalata, B., Vasanti H. and Deshpande, V., “Molecular and Industrial Aspects of Glucose Isomerase”,
Microbiology Reviews, Vol. 6, No. 2, (1996), 81-93.
8. Neeves, B., Elander, T., Jechur, L. and Mcmillan, D., “Expanding the Biomass Sugars Platform, an
Investigation of Sugar Separation and Purification Techniques in the Context of an Integrated Biomass Processing Refinery”, Natural Renewable Energy Laboratory, www.biomass.govtools.us/pdfs/bcota/abstracts/ 12/z205.pdf, (October 2001).
9. Azevedo, D. C. S. and Ridrigues, A., “SMB Chromatography Applied to the Separation and Purification of Fructose from Cashew Apple Juice”,
Brazilian Journal of chemical Engineering, Vol., 17,
No. 4, (2000), 507-516.
10. Ophardt, Ch. E., “Corn Syrup”, Virtual chem. book, ElnhurstCollege, www.elmhurst.Edu/~chm/vchembook/ 548Hfsyrup.html, (December 2003).
11. Coelho, M. S., Azevedo, D. C. S., Teixeira, J. A. and Rodrigues, A., “Dextran and Fructose Separation on an SMB Continuous Chromatographic Unit”, Biochemical Engineering Journal, Vol. 12, (2000), 215-221.
12. Maynard, A. J., “Methods in Food Analysis”, Academic Press, New York, U.S.A., (1970), 45-73
13. Schrech James, O. and Loffredo William, M., “Qualitative Testing for Carbohydrates Modular Laboratory Pogram in Chemistry”, Copyright by Chemical Education Resources Inc. Pennsylvania, www.cerlabs.com/experiments/10875404464.pdf, (June 1994).
14. Chen, W. P., Anderson, A. W., “Purification Immobilization and Some Properties of Glucose Isomerase from”, Sterptomyces flavogriseus, Applied
and Environmental Microbiology, Vol. 36, No. 6, (1979), 1111-1119.
15. Wankat Phillip, C., “Large-Scale Adsorption and Chromatography”, CRC Press Inc., New York, U.S.A., Vol. 2, (1986), 57-72.