A b s t r a c t. The dynamics of nitrogen forms in soil irrigated with municipal waste water was studied in order to determine its effect on soil redox potential. The soil (Eutric Histosol) was planted with a mixture of grasses, and irrigated 10 times per year with waste water purified by a two-step (mechanical and biologi-cal) treatment with a dose optimal for the plants, or doubled. Simultaneously, control soil (not flooded) with plant vegetation was studied. It was found that redox potential was influenced by nitrate (V) nitrogen in plots irrigated with municipal waste water at the optimal irrigation dosage for the plants and with double the optimal dose. Irrigation with waste water resulted in a decrease of Eh value in the whole soil profile, causing a reduction of redox potential value below the level of +200 mV, especially in lower horizons, corresponding to dissimilative reduction of nitrates (V) to the forms of N2O and N2.
K e y w o r d s: redox potential, biogene, irrigation, hydro-botanical treatment plant
INTRODUCTION
Water plays a very special role in the mutually related processes that take place in ecosystems, constituting a fun-damental, necessary for their functioning, abiotic element of the environment. Soil is the fundamental acceptor of wastes generated in nature (Fashchevsky and Fashchevskaya, 2003). Wastes purification utilizing the soil and plants is the result of complex processes – chemical, physical, physico-chemical, biochemical – that take place in the aeration and saturation zone.
Nitrogen compounds occurring in municipal and in-dustrial water can cause serious effects such as deoxidation due to nitrification, ammonia poisoning and biomass ex-cessive growth. Because of the above effects intensive studies including the removal of biogenic substances from
waste water (Obarska-Pempkowiak, 1991) and the use of soil and plants in hydrobotanical waste water treatment plants (Richardson and Davies, 1987) have been carried out in recent years. Nowadays, in Poland there are about 40 waste water treatment plants of this type.
Studies of processes occurring under the conditions of intensive irrigation of soil and plants, among others willow (Salix Americana) and grass, with municipal waste water from the ‘Hajdów’ waste water treatment plant were carried out in 1997-1999 in Lublin (Report, 1998). Intensive pe-riodic irrigation of soil caused an increase in redox pro-cesses. The intensity of the processes was evaluated based on changes and current values of redox potential which is one of more important parameters used to describe soil solution and its oxygen conditions (Stêpniewska, 1988; Stêpniewskaet al., 1997).
The values of pH of soil water were in the range of 6.85-8.8 and those of pH of waste water from 6.5 to 8.4 (Report, 1998), so the conditions for nitrification and deni-trification processes were favourable.
The aim of the paper was to compare changes of redox potential in soil with changes of concentrations of nitrate (V) and ammonia nitrogen in soil water during irrigation of mixed grass cultivations. The comparison was aimed at evaluation of the influence of nitrogen forms on redox potential values at different depths of soil.
METHODOLOGY OF STUDIES
The experiments were carried out in the Bystrzyca River Valley in the area of about 8 ha, divided into 7 equal plots. The area of one plot was covered with grass mixture. Every plot was divided into 3 subplots (A – control, B – with an optimal irrigation dose for the plant, C – with double the optimal dose).
Nitrate and ammonium transformation and redox potential changes in organic soil
(Eutric Histosol) treated with municipal waste water**
T. W³odarczyk* and U. Kotowska
Institute of Agrophysics, Polish Academy of Sciences, Doœwiadczalna 4, P.O. Box 201, 20-290 Lublin, Poland
Received September 5, 2005; accepted September 28, 2005
© 2006 Institute of Agrophysics, Polish Academy of Sciences *Corresponding author’s e-mail: teresa@demeter.ipan.lublin.pl
**This work was partly supported by the State Committee for Scientifc Research, Poland, Grant No. PBZ-31-03, 1997-1999.
w
w
To evaluate ammonia and nitrates (V) nitrogen concen-trations in soil solutions, ceramic drains for soil water sam-pling were installed at depths of 10, 30, 50, 70 and 100 cm on each subplot. Measurements of nitrogen forms concen-trations were conducted on a FIA-star 5010 /TEKATOR/ spectrophotometer.
Redox potential (Eh) at the above depths was measured with platinum electrodes using a calomel electrode (NEK) as reference, and an Orion Model 401 meter. Taking into account temperature fluctuations, adjustments of reference electrode potential were made assuming for the tempera-tures of 10, 15, 20 and 25°C the values equal to 254, 251, 247 and 244 mV, respectively.
Waste water from the ‘Hajdów’ used for the irrigation of mixed grass showed rather stable basic physiochemical para-meters (Report, 1998). Concentration of nitrogen forms, especially ammonia and nitrate (V) nitrogen, was more variable. Concentrations of NH4+-N and NO3--N were in the range of 1.1-7.1 g m-3 and 20.2-38.4 g m-3, respectively (Report, 1998).
Treated waste water can supply the soil with biogenic substances in quantities corresponding to intensive fertili-zation. The optimum irrigation dose of 600 mm (grass) sup-plied the soil with at least 180 kg N, 30 kg P, and 110 kg K ha-1, and the quantities of nitrogen, phosphorus and potas-sium amounted to 270, 45, 167 kg ha-1, respectively. On the subplots irrigated with double the optimum dose, the quanti-ties of fertilizers were twice as much.
RESULTS AND DISCUSSION
Nitrogen transformations in field irrigated with waste water after 2nd stage of treatment
Transformations of the ammonium form
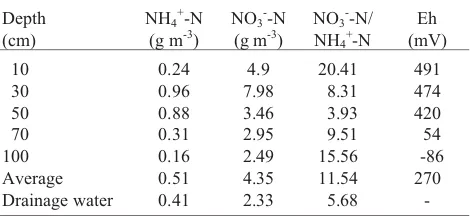
The highest average concentration of ammonium form in the first year of the experiment on the control plot covered with grass mix was found at the depth of 30 cm (0.96 g N m-3), and the lowest at 100 cm (0.16 g N m-3) (Table 1). Distinctly lower concentration of ammonium ion in the surface part of the soil profile (10 cm) could be related to more intensive uptake of ammonium N by the root system of the grasses.
Waste water irrigation in the single and double doses had its reflection in the content of the ion analyzed in soil solutions taken from plots B and C. The addition of waste water caused an increase in the concentration of ammonium ion to 3.87 and 4.82 g N m-3, respectively for plots B and C for the depth of 10 cmiealmost four- and five-fold as much as the native concentration of ammonium form in the control plot (Fig. 1). A somewhat lower increase was observed at depths below 10 cm in the soil profile. In the initial stage of waste water effect on the soil and the grasses only a slightly
higher concentration of NH4+-N was observed at the depth of 10 cm; at the other depths the concentration of ammonium ion was very much similar in both plots. Considerably greater differences in the concentration of the ion under analysis were observed on the second day from flooding, especially at depths down to 30 cm.
The decrease in the concentration of ammonium ion at the lower dose of waste water results, among other things, from the process of nitrification, its fixing in the sorptive complex of the soil, and immobilization by plants and microbes.
Figure 2 presents the balance of NH4+-N transforma-tions in the period from the 3rd hour to the 7th day after irrigation with waste water, expressed in the form of reduction or increase in the amount of the analysed ion, in absolute values.
Analysis of the results presented indicates that the effectiveness of the reduction decreases with depth, which is undoubtedly related with the lower biological activity in the deeper parts of the soil profile.
An important factor in the process of ammonium ion sorption was the dosage of waste water applied, where a greater reduction in the amount of NH4+-N was observed in the case of the double dose, especially at the depth of 10 cm. The tendency decreased with the increase of depth.
Concentration of ammonium ion in drainage water under grass mix is presented in Fig. 3 with relation to waste water dosage. A higher concentration of the NH4+-N ion was noted in plot (B), where it remained on a fairly stable level from the 3rd hour after irrigation till the second day. The concentration of NH4+-N dropped nearly by half on 7th day from irrigation. This fact may be related to the distinctly higher index of filtration of plot (B) as compared to that of plot (C). In the case of the latter, the concentration of ammo-nium ion in the drainage water remained stable on a rela-tively high level for a period of seven days. The higher level of the NH4+-N ion in the drainage water with relation to the control varied within the range from 3- to 1.5-fold.
However, taking into consideration the amount of NH4+-N ions introduced with the waste water, their concen-tration in the drainage water dropped from 3- to 6-fold.
Depth (cm)
NH4+-N (g m-3)
NO3--N (g m-3)
NO3--N/ NH4+-N
Transformations of nitrate (V) form
Figure 4 illustrates the distribution of nitrate (V) form concentration within the whole soil profile with relation to waste water dosage. The native content of nitrates (V) varied from 2.49 to 7.98 g N m-3, respectively for the depths of 100 and 30 cm (Table 1). Somewhat lower concentration of NO3--N occurred at the depth of 10 cm (like in the case of the ammonium form), which should be ascribed to intensive development of the root system of the grasses in that part of the soil profile, especially in the first year of cultivation.
The application of waste water affected the dynamics of transformations of nitrate (V) nitrogen irrespective of the dosage (Fig. 4). Comparison of NO3--N concentration with-in the whole period of waste water effect on the soil and
plants, as well as in the soil profile between single and double dosage, suggests that in the case of the grass mix the amount of nitrogen (V) introduced does not play any signifi-cant role in its transformations.
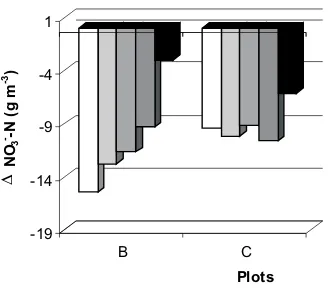
Figure 5 presents the balance of nitrogen transforma-tions between the 3rd hour and the 7th day from irrigation, expressed in the form of reduction or increase in the amount of nitrate (V) ion, in absolute values. Analysis of the results presented indicates that the reduction in the amount of nitrate (V) ion decreased with depth in the soil profile in plot B and was much higher than in plot C.
Figure 6 presents the concentration of NO3--N in the drainage water with relation to waste water dosage. The mobility of nitrates (V) caused that already after 3 h from the moment of waste water application their maximum -5
-4 -3 -2 -1 0 1
DNH
4
+-N
(g
m
-3)
B C
Plots
10 cm 30 cm 50 cm 70 cm 100 cm
Fig. 2.Changes in NH4+-N concentrations in soil solution expres-sed like a decrease or increase after 7 days after flooding under grass mixture as dependent on the waste water dose (single – B and double – C).
0 1 2
NH
4
+-N
(g
m
-3)
3 hours 2 days 7 days Tim e of flooding
A B C
Fig. 3.NH4+-N concentrations in drainage water during 7 days after flooding under grass mixture in a control plot A and as dependent on the waste water dose (single – B and double – C). 0
1 2 3 4 5
NH
4
+-N
(g
m
-3)
10 30 50 70 100 Depth (cm ) Plot B
3 h A 3 h B 2 days B 7 days B
0 1 2 3 4 5
NH
4
+ -N
(g
m
-3 )
10 30 50 70 100 Depth (cm ) Plot C
3 h A 3 h C 2 days C 7 days C
concentration was observed, proportionally to the amount of waste water applied. On day seven of the experiment, the concentration of NO3--N dropped three-fold, and taking into consideration the amount of nitrates introduced with the waste water, the concentration of NO3--N decreased by a factor of six.
Dynamics of redox potential changes
Introduction of waste water to the soil in amounts causing its total flooding results in radical changes in the water-air relations in the soil. As shown by research by
numerous authors (Gliñski and Stêpniewski, 1985; McKenneyet al., 2001), under the conditions of soil flood-ing with water exhaustion of oxygen occurs within several hours, resulting in a variety of changes in the soil. In particular, the redox potential of the soil decreases, with the drop of Eh values below +300 mV being caused by reduction of the soil and successive activation of redox couples other than the O2/H2O system egNO3--N/NO2--N (Gliñski and Stêpniewski, 1985).
As a result of oxygen content in the soil decrease below 1% (v/v), anaerobic microorganisms begin to dominate over aerobes. Gliñski and Stêpniewski (1985) conclude that soil 0
5 10 15 20 25
NO
3
--N
(g
m
-3)
10 30 50 70 100
Depth (cm ) Plot B
3 h A 3 h B 2 days B 7 days B
Fig. 4.NO3--N concentrations in soil solution during 7 days after flooding under grass mixture in a control plot A and as dependent on the waste water dose (single – B and double – C).
0 5 10 15 20 25
NO
3
- -N
(g
m
-3 )
10 30 50 70 100
Depth (cm ) Plot C
3 h A 3 h C 2 days C 7 days C
-19 -14 -9 -4 1
DNO
3
--N
(g
m
-3)
B C
Plots
10 cm 30 cm 50 cm 70 cm 100 cm
Fig. 5. Changes in NO3--N concentrations in soil solution expressed like a decrease or increase after 7 days after flooding under grass mixture as dependent on the waste water dose (single – B and double – C).
0 5 10 15
NO
3
--N
(g
m
-3)
3 hours 2 days 7 days
Tim e of flooding
A B C
flooding with water causes a gradual drop of redox potential until a certain fairly stable level is reached. The rate of the decrease and the value of Eh depend on the intensity of the process of reduction, determined by temperature and by the content of easily decomposable organic substrate and of oxidized inorganic compounds functioning as acceptors of electrons, including nitrates (V).
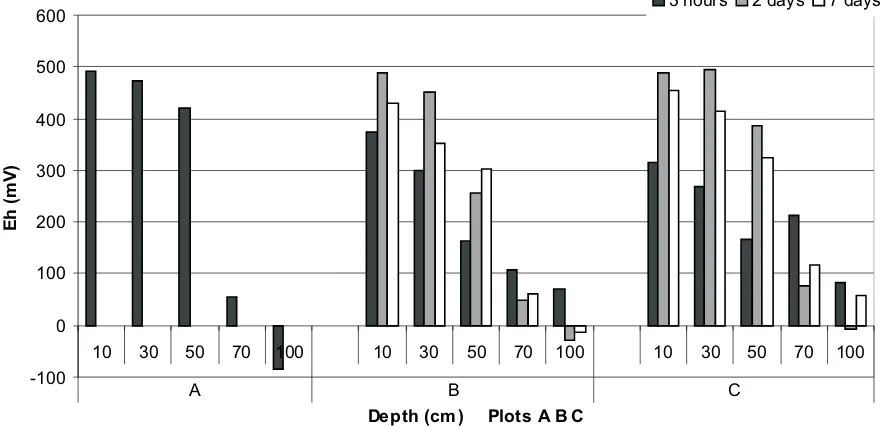
Figure 7 presents the change of redox potential after 3 h, and after two and seven days from the application of the single and double irrigation doses in fields under grass mix. Redox potential in the control soil profiles was stabilized down to the depth of 50 cm and varied within the range from about +400 to +500 mViein the range of aerobic oxidation of carbon (Tate, III, 1995).
At depths below 50 cm the value of Eh rapidly drops, reaching negative values. Such a drastic drop of the redox potential is related with the appearance of ground water table at the depth of 50-60 cm. That is why the values of Eh at the depths of 70 and 100 cm were relatively low and varied from about +60 to -90 mV.
Irrigation of the fields with the single and double doses of waste water resulted in a change of the redox potential. Analysis of changes in the aeration status in plots A, B, C down to the depth of 50 cm on the 3rd h showed a lower value of Eh in the combinations with irrigation than in the control plot (A). Generally, it can be stated that the value of redox potential, at the 3rd h from irrigation, decreased with depth in all the objects studied. The decrease in the lower part of the profile depended more on the ground water table than on the waste water applied.
On the second day after flooding the soil with waste water, for both the single and double dosage, in most of the analysed soil horizons down to the depth of 50 cm the phenomenon was observed of fairly rapid increase in the redox potential value reversing to a decrease by the seventh day from flooding. The rapid decrease after flooding could be related to high microbial activity that is always accompanied by fast depletion of oxygen in the environment and a drop of Eh before the microorganisms can adapt to anaerobic conditions and the system involving the NO3--N/ NO2--N pair of electrons (next in line after O2) can activate. This phenomenon occurs most frequently when the soil gets flooded following thorough drying.
Thus, in the case of fields with grass mix, in the profile down to the depth of 50 cm (except for field 6B at 50 cm), there was no distinctly observable phenomenon of reoxi-dation, so important for proper development of the root systems of plants grown.
Concentration of nitrates (V) versus redox potential in the soil irrigated with single and double dose of waste water after 2nd stage of treatment
Soil flooding may cause a gradual decrease of redox potential until a certain relatively stable level is reached. The rate of the decrease and the minimum value of Eh depend on the intensity of processes of reduction, determined by temperature and the amount of easily available organic
-100 0 100 200 300 400 500 600
10 30 50 70 100 10 30 50 70 100 10 30 50 70 100
A B C
Depth (cm ) Plots A B C
Eh
(m
V)
3 hours 2 days 7 days
substrate, and on the amount of bioreducible inorganic compounds which are acceptors of electrons (nitrates, three-and four-valent manganese compounds, iron oxides). The presence of such compounds maintains redox potential on a certain constant level whichegin the case of nitrates, is from +100 to +200 mV (Bailey and Beauchamp, 1971; Gliñski and Stêpniewski, 1985).
In parallel to analysis of concentration of nitrate (V) ions, data concerning the redox potential were collected and an attempt was made at determining the correlation between the concentration of nitrates (V) introduced with the single and double doses of waste water and the value of the redox potential. The relations obtained are presented on the example of average values of NO3--N concentration and values of Eh measured in the fields in the first year of the irrigations (Fig. 8).
The relationship is described by two mathematical functions: linear (y= a + bx) and power (y = axb). In all the cases analysed the functions are positive, which means higher concentration of NO3--N is accompanied by a higher value of Eh.
A higher coefficient of determination was observed in fields irrigated with the double dose of waste water (C). Analysis of the diagrams presented shows that up to two days from waste water application in all the cases analysed the value of Eh held at the level of +200 mV within the range of NO3--N concentrations of 12-20 g m-3. With high soil moisture, nitrate content could protect the soil against the process of reduction. In the case of soil flooding with waste water, there occurred a restriction of oxygen influx, first of all in the surface horizons. In that situation the presence of nitrates affected the value of Eh proportionally to their
concentration. At seventh day of experiment, the process of reoxidation, especially in higher part of horizons, could influence redox potential more than nitrate content (Fig. 8). W³odarczyk (2000) found that with a decrease in the content of nitrates within the range from about 100 to approximately 10 mg NO3--N kg-1, redox potential value decreased from 250 to 190 mV. For mineral soils, the limit value which is accompanied by a clear decrease in Eh value is the level of approximately 100 mg NO3--N kg-1. It is to be supposed, therefore, that below +400 mV the decrease in NO3--N concentration was caused by the process of denitri- fication. Literature reports indicate that the beginning of the process of denitrification in various soils occurs at different values of Eh, sometimes below +200 mV (Kralova et al., 1992; Van Cleemput and Patrick, 1974; W³odarczyk, 2000).
Under favourable conditions (min. low Eh value, available organic matter), nitrates (V) entered the path of dissimilative reduction, where the final product was the ammonium ion, periodically increasing its concentration in the soil profile, especially in its lower horizons.
The data presented in Fig. 9 show the effect of depth on the value of Eh. Statistical analysis of Eh values in the function of depth showed their close correlation. The dependence is described by linear function (y = a + bx). In all three plots under analysis the functions are negative, which means that redox potential decreases with depth. In all cases the coefficient of determination R2is close to 0.9 or even higher, which, with five replications, gives significance at the level of 0.001.
Plot B
y = 127.88x - 360.05 R2= 0.7454
y = 70.172x - 587.58 R2= 0.8734
-100 0 100 200 300 400 500 600 700
0 5 10 15 20
NO3
--N (g m-3)
Eh
(m
V)
2 days 7 days
Plot C y = 5.7522x2.1846
R2= 0.6164
y = 81.654x - 763.0 R2= 0.9238
-100 0 100 200 300 400 500 600 700
0 5 10 15 20
NO3
--N (g m-3)
Eh
(m
V)
2 days 7 days
CONCLUSIONS
1. Decrease in the concentration of NH4+-N and NO3--N ions in the soil profile indicates that grass mix can be used in the process of waste water purification.
2. In a great majority of cases discussed, the concentra-tion of NO3--N in drainage water did not exceed 15 g N m-3, which meets the requirements imposed by the European Union.
3. The best aeration conditions were found down to the depth of 30 cm, where Eh values held about +300 mV, with the possibility of nitrifiers development; below the depth of 50 cm redox potential decreased to a value permitting the development of denitrifiers.
4. A significant relationships has been shown between the redox potential and nitrogen transformations taking place in a soil irrigated with waste water after 2nd stage of treatment.
5. A significant negative effect of waste water dosage on redox potential was observed, especially in the case of the double dose, causing the reduction of redox potential value below the level of +200 mV, corresponding to dissimilative reduction of nitrates (V) to the forms of N2O and N2.
6. Waste water application in the single dose may pro-vide a valuable source of nitrogen in the cultivation of plants for industrial purposes.
REFERENCES
Bailey L.D. and Beauchamp E.G., 1971.Nitrate reduction, and redox potentials measured with permanently and tempo-rarily placed platinum electrodes in saturated soils. Can. J. Soil Sci., 51, 51-58.
Fashchevsky B. and Fashchevskaya T., 2003.Ecological Hydrology: New Scientific Direction for Water Resource Management, http://www.wrrc.dpri.kyoto-u.ac.jp/~aphw/APHW2004/ proceedings/OHS/56-OHS-M162/56-OHS-M162.pdf Gliñski J. and Stêpniewski W., 1985.Soil Aeration and Its Role
for Plants. CRC Press Inc., Boca Raton, Florida, USA. Kralova M., Masscheleyn P.H., Lindau C.W., and Patrick
W.H. jr., 1992.Production of dinitrogen and nitrous oxide in soil suspensions as affected by redox potential. Water, Air, Soil Pollut., 61, 37-45.
McKenney D.J., Drury C.F., and Wang S.W., 2001.Effect of oxygen on denitrification inhibition, repression, and depres-sion in soil columns. Soil Sci. Soc. Am. J., 65, 126-132. Obarska-Pempkowiak H., 1991. Seasonal variations in the
efficiency of nutrient removal from domestic effluent in aquasi-natural field of reed (Phragmites communis). In: Ecological Engineering for Wastewater Treatment (Eds C. Etnier, B. Guaterstarm), Bakskogen, Sweden.
Report,1998.Report, Grant No. PBZ-31-03.
Richardson C.J. and Davies J.A., 1987. Natural and artificial wetland ecosystems: ecological opportunities and limitations. In: Aquatic Plants for Water Treatment and Resource Recovery (Eds K.R. Reddy and W.H. Smith). Magnolia Publ., Orlando, Florida, USA.
Fig. 9.Redox potential value after 3 h, 2 and 7 days after flood-ing versus depth of profile and waste water dose (A – control, B – single dose, C – double dose) under grass mixture.
Plot B
y = -6.4619x + 579.42 R2= 0.9441
-100 0 100 200 300 400 500 600 700
0 20 40 60 80 100 120
Depth (cm )
Eh
(m
V)
2 days 7 days
Plot A y = -7.1816x + 644.04
R2= 0.8789
-100 0 100 200 300 400 500 600 700
0 20 40 60 80 100 120
Depth (cm )
Eh
(m
V)
3 hours
Plot C y = -4.8873x + 527.47
R2= 0.9346
-100 0 100 200 300 400 500 600 700
0 20 40 60 80 100 120
Depth (cm )
Eh
(m
V)
Stêpniewska Z., 1988.ODR-redox properties of mineral Polish soils (in Polish). Problemy Agrofizyki, 56, 1-104.
Stêpniewska Z., Stêpniewski W., Gliñski J., and Ostrowski J., 1997. Atlas of the Redox Properties of Arable Soils in Poland. Institute of Agrophysics, Lublin.
Tate, III, R.L., 1995. Process control in soil. In: Soil Micro-biology (Eds L. Robert, R.L. Tate III). J. Wiley & Sons, New York- Chichester-Brisbane-Toronto-Singapore.
Van Cleemput O. and Patrick W.H., 1974.Nitrate and nitrite reduction in flooded, gamma-irradiated soil under controlled pH and redox potential conditions. Soil Biol. Biochem., 6, 85-88.