i
tif c
n
e C
i o
c n
S f
l e
a r
n e
o n
i c
t e
a
2
nr 0
et 1
1
n I
ISC 2011
Proceeding of the International Conference on Advanced Science,
Engineering and Information Technology 2011
Hotel Equatorial Bangi-Putrajaya, Malaysia, 14 - 15 January 2011
ISBN 978-983-42366-4-9
ISC 2011
International Conference on Advanced Science, Engineering and Information Technology
ICASEIT 2011
Cutting Edge Sciences for Future Sustainability
Hotel Equatorial Bangi-Putrajaya, Malaysia, 14 - 15 January 2011
SR
IE AV IUN IT NESIE DOKB
IN N
R AG
JA A
L S
A A
E N
P M
N A
A L
U A
T Y
A S S A I
REP
N I
NOI TAI COSSA STNEDUTS NA ISENOD
Organized by Indonesian Students Association Universiti Kebangsaan Malaysia
Proceeding of the
Experimental Study of Breast Cancer Detection
Using UWB Imaging
Saleh A. Alshehri*,‡ , Sabira Khatun†, Adznan B. Jantan*,††,RSA Raja Abdullah£,
Rozi Mahmood§ and Zaiki Awang¶
*
Department of Computer and Communication Systems Engineering, Faculty of Engineering §
Department of Imaging, Faculty of Medicine and Health Sciences, Universiti Putra Malaysia, 43400, Serdang, Selengor, Malaysia
Tel: +60389466436, Email: ‡[email protected]; ††[email protected]; §[email protected]
£
Wireless & Photonic Networks Research Centre, Universiti Putra Malaysia, 43400, Serdang, Selangor, Malaysia.
E-mail: [email protected]
†
Department of Computer Systems and Networks, Faculty of Computer Systems and Software Engineering Universiti Malaysia Pahang, 26300 Gambang, Kuantan, Pahang, Malaysia
Email : [email protected]
¶
Microwave Technology Centre, Universiti Teknologi MARA 40450 Shah Alam, Selangor Darul Ehsan, Malaysia
Email: [email protected]
Abstract— Breast cancer detection using UWB imaging is presented in this paper. The study is performed experimentally.
Homogeneous breast phantom is constructed using pure petroleum jelly. The tumor is modeled using mixture of water and wheat flour. The breast fatty tissue and tumor tissue are put in breast shaped glass which mimics the skin. The dielectric properties values are comparable to previous study. Neural Network (NN) was trained and tested using feature vector which is prepared by performing discrete cosine transform (DCT) of the received UWB signals. Very encouraging results were obtained. Up to 100 % tumor existence detection was achieved. Tumor size and location detection rate were 91.3% and 95.6% respectively.
Keywords— Early breast cancer detection, NN, breast phantom for UWB imaging.
I. INTRODUCTION
There has been many numerical, simulation and experimental studies in using UWB imaging for breast cancer detection [1]-[8]. The main basis in UWB imaging application is the use of contrast in dielectric properties among different breast tissues [5], [6],[9]. A mixture of different percentage of soy oil and gelatin was the mostly used material to mimic breast fatty tissue. In almost all the previous studies, the breast phantoms were constructed to be used for relatively long time. It is found that the water content will migrate with time which may produce
inconsistence results [7,10].
We are proposing a UWB imaging system for early breast cancer detection. It consists of commercial UWB signal generation, a Neural Network model for detection and homogeneous breast phantom for temporary and immediate use. We have fabricated the homogenous breast phantom for this purpose which contains low cost and easily available materials. The phantom can be fabricated repeatedly with minimum cost and effort.
A. UWB Signal Generation
A back-propagation feed forward NN models was constructed to be trained for tumor existence, location and size detection. The procedure to collect the data is similar to the procedure presented in [8]. However, in this work, the feature vector contains the DCT of the UWB signals. Each received UWB signal using the commercial UWB device consists of 6400 points. Since large DCT values appear in the rage of 50-300, it has been used to train the NN. The generalization test of the proposed NN was measured using cross-validation method.
It is required to use UWB transmitter and receiver to perform this experiment. We used Time Domain product called PulsOn evaluation kit [11]. It works with center frequency of 4.7 GHz and 3.2 GHz bandwidth. The transmitted signal is not documented. This device is intended to be used for UWB data communication. It uses packet format for transmission. However, one of its functions is to show a received waveform in time domain which is an integration of many UWB pulses to reach signal level higher than the noise level. Fig. 1 shows a received wave form.
B. Breast Phantom Construction
In [8] the dielectric properties (permittivity and conductivity) were obtained from [12]. The exact dielectric properties values are not important. The most important metrics are the ratios between the different breast and tumor tissues dielectric properties [4],[5]. Even these ratios are not restricted values. It is reported in literature with different values [2],[5],[6],[9],[10],[13],[14].
Fig. 1. UWB wave form received by PulsOn device.
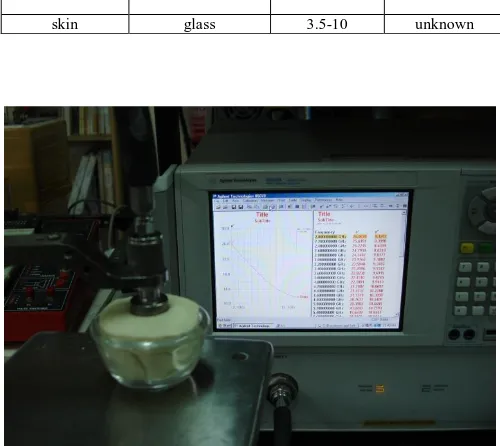
In the presented experiment, we used various materials. The dielectric properties values are dependent on the water contents of the tissue [10],[13],[15]. We have tried to create tumor with different dielectric constant values by changing the water to wheat flour ratio. Fig. 2 shows the water to wheat flour ratio versus the dielectric constants values at certain frequencies. The measurement was done using Agilent N5230A VNA and HP 85070B dielectric coaxial probe as show in Fig. 3. The measured dielectric properties at 4.7 GHz are shown in Table I. The glass dielectric properties were not measured. It is assumed as in [16]. The
glass is lossless material. Since it is used to mimic the skin tissue which is only 2 mm thick, its lossless effect is minimal. Fig. 4 and 5 show the permittivity and conductivity of the Vaseline and water to wheat flour ratio of 55.3% in the frequency range of 2-12 GHz. This water to flour ratio is the one used to mimic tumor tissue.
Fig. 2. Permittivity for various water to flour ratios.
TABLE I
DIELECTRIC PROPERTIES OF THE USED MATERIALS AT 4.7 GHZ.
Breast phantom parts
Material Permittivity Conductivity
(S/M)
fatty tissue pure petroleum
jelly (Vaseline) 2.36 0.012
tumor
mixture of water
and wheat flour 23 2.57
skin glass 3.5-10 unknown
Fig. 4. Permittivity of Vaseline and water to flour ratio of 55.3%.
Fig. 5. Conductivity of Vaseline and water to flour ratio of 55.3%.
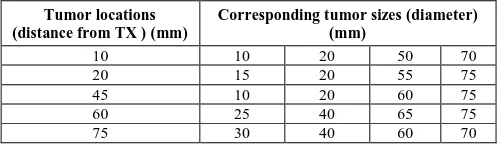
A glass of hemispherical shape with 100 mm width, 50 mm height and 1.6 mm thick was used as skin. Its shape is similar to patient breast in prone position. To imitate the fatty breast tissue, it was filled with Vaseline which is pure petroleum jelly. Water to wheat flour ratio of 55.3% was used to mimic tumor tissue. Tumors with different sizes were located at different location along the line between the transmitter and the receiver. Table II shows the tumor sizes corresponding to the location. Fig. 6 shows one tumor locations which were used in our experiment. A 2 mm tumor can be seen at the lower right corner of the figure.
TABLE II
TUMOR SIZES AND LOCATION COMBINATION USED IN THE EXPERIMENTS.
Tumor locations (distance from TX ) (mm)
Corresponding tumor sizes (diameter) (mm)
10 10 20 50 70
20 15 20 55 75
45 10 20 60 75
60 25 40 65 75
75 30 40 60 70
For each tumor size and location pair, the PulsOn is used to transmit and receive three different UWB signals to generate as maximum number of signals as possible for better NN training. We did not include the chest representation on our phantom because of the difficulty in inserting the tumor then. We think the effect of this step is
minimal since the measurement is done through the line of site by placing the tumor along the straight line between the transmitter and receiver Discrete Cosine Transform.
Fig. 6. One tumor location. A 2 mm tumor is shown at the lower right corner.
In [8], we used UWB signals in time domain. The signals were sampled to obtain the feature vector needed to train the NN model. PulsOn device does not show the time relation between the transmitted and the received signals, it only shows the wave form. So, it is impossible to sample the received signals at the same instance of time. The DCT is a sum of infinitely many cosines basis functions in different frequencies with varying real number amplitudes [17]. By this summation, DCT can approximate any signal. Since most of the signals information is captures in few low frequency components, we have decided to use DCT. Applying DCT to the same data obtained in [8] gives tumor existence, size and location detection rate of 100%, 86.9% and 80.4% respectively. A simple back-propagation feed-forward NN model was used. The input feature vector size is 200. It corresponds to the DCT components between 50 and 250. It has one hidden layer of 4 nodes and an output layer with one node for tumor location detection. The same NN architecture is used for tumor size detection. Tumor existence detection is noticed by the negative output in both NN architectures. MatLab 7 was used for calculating DCT and constructing the NN model
III. RESULTS
All To calculate the absolute error, the used formula is:
𝐸 =𝑛1 𝑡𝑛− 𝑦𝑛 (1)
where 𝑡𝑛 is the target vector, 𝑦𝑛 is the predicted values by
the neural network and 𝑛 is the number of samples. However for relative performance rate, the used formula is:
𝐸 =𝑚𝑎𝑥 𝑦𝑖,𝑡𝑖 −𝑚𝑖𝑛 𝑦𝑖,𝑡𝑖
where 𝑦
𝑖are the predicted and 𝑡
𝑖are the targets.
A tumor existence detection rate of up to 100% was achieved. Tumor size and location detection rates were 95.8% and 91.3% respectively. This result is in agreement with the simulation results reported in [8]. Tables III and IV show the tumor size and location detection relative performance rate respectively using Equation 2.TABLE III
TUMOR SIZE RELATIVE PERFORMANCE DETECTION RATE
Data groups
Actual tumor size (mm)
Predicted tumor size (mm)
Relative performance %
training data (partial)
6.00 6.31 95.09
2.00 1.96 98.00
-1.00 -0.95 100.00
4.50 4.91 91.65
1.00 1.91 52.36
2.00 2.27 88.11
4.50 4.92 91.46
1.00 1.93 51.81
6.00 6.31 95.09
6.00 6.38 94.04
-1.00 -0.95 100.00
2.00 2.41 82.99
6.00 6.36 94.34
validating data
2.00 1.93 96.50
2.00 1.99 99.50
4.50 4.31 95.78
6.00 6.11 98.20
7.50 6.54 87.20
testing data
6.00 6.53 91.88
-1.00 -0.92 100.00
2.00 1.92 96.00
2.00 2.25 88.89
7.50 6.54 87.20
2.00 2.83 70.67
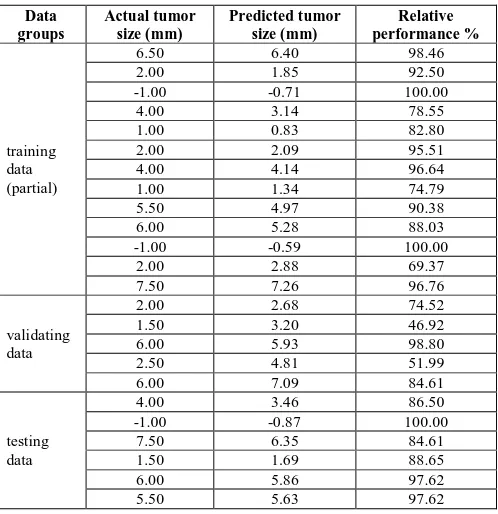
TABLE IIIV
LOCATION DETECTION RELATIVE PERFORMANCE RATE
Data groups
Actual tumor size (mm)
Predicted tumor size (mm)
Relative performance %
training data (partial)
6.50 6.40 98.46
2.00 1.85 92.50
-1.00 -0.71 100.00
4.00 3.14 78.55
1.00 0.83 82.80
2.00 2.09 95.51
4.00 4.14 96.64
1.00 1.34 74.79
5.50 4.97 90.38
6.00 5.28 88.03
-1.00 -0.59 100.00
2.00 2.88 69.37
7.50 7.26 96.76
validating data
2.00 2.68 74.52
1.50 3.20 46.92
6.00 5.93 98.80
2.50 4.81 51.99
6.00 7.09 84.61
testing data
4.00 3.46 86.50
-1.00 -0.87 100.00
7.50 6.35 84.61
1.50 1.69 88.65
6.00 5.86 97.62
5.50 5.63 97.62
The tumor location relative performance detection rate is similar. Even though, the simulation setup is an ideal environment, the experiment work which was done in noisy normal room shows better results. This could be because the number of signal value points obtained in the experimental work is much larger than the simulation work. This results in more accurate DCT values.
Fig. 8 and 9 show a comparison between the simulation and the breast phantom experimental results for some sizes and locations values.
Fig. 7. Some actual vs. predicted tumor sizes from both simulation experimental work.
Fig. 8. Some actual vs. predicted tumor locations from both simulation and homogenous experimental
IV. CONCLUSIONS
REFERENCES
[1] G. Bindu, A. Lonappan, V. Thomas, C. K. Ananadan, and K.T.
Mathew, “Active microwave imaging for breast cancer detection,”
Progress In Electromagnetic Research, PIER, vol. 58, pp. 149-169, 2006.
[2] H. B. Lim, N. T. Nhung, E. Li and N. D. Thang, “ Confocal
microwave imaging for breast cancer detection:
delay-multiply-and-sum image reconstruction algorithm,” IEEE Transaction on
Biomedical Engineering, vol. 55, no. 6, pp. 1697-1704, 2008.
[3] E. C. Fear, X. Li, S. C. Hagness and M.A. Stuchly, “Confocal
microwave imaging for breast tumor detection: localization of tumors
in three dimensions,” IEEE Transactions on Biomedical Engineering,
vol. 49, no. 8, pp. 812-822, 2002.
[4] E. C. Fear, J. Still, and M.A. Stuchly, “Experimental feasibility study
of confocal microwave imaging for breast tumor detection,” IEEE
Transactions on Microwave Theory and Techniques, vol. 51, no. 3, pp. 887-897, March 2003.
[5] X. Li, S. K. Davis, S. C. Hagness, D. W. Weide, and B. D. Veen,
"Microwave imaging via space-time beam forming: experimental investigation of tumor detection in multilayer breast phantoms,”
IEEE Trans. Microwav. Theory Techniques, vol. 52, no. 8, pp. 1856-1865, 2004.
[6] X. Xiao, “Study on the breast cancer detection by UWB microwave
imaging,” in Proc. of the International Conference on Microwave
and Millimeter Wave Technology ICMMT2008, April 21-24 2008, Nanjing P.R. China.
[7] J. M. Sill, E. C. Fear, “Tissue sensing adaptive radar for breast cancer
detection-experimental investigation of simple tumor models,” IEEE
Transactions on Microwave Theory and Techniques, vol. 53, no. 11, pp. 3312 – 3319, 2005.
[8] S. A. Alshehri, S. Khatun, “UWB imaging for breast cancer detection
using neural networks,” Progress In Electromagnetic Research C,
vol. 7, pp. 79–93, 2009.
[9] L. Sha, E. R. Ward and B. Story, “A review of dielectric properties of
normal and malignant breast tissue,” in Proc. IEEE SoutheastCon,
April 5-7 2002, pp. 457 – 462.
[10] J. C. Lai, C. B. Soh, E. Gunawan and K.S. Low, “Homogeneous and
heterogeneous breast phantom for ultra-wideband microwave
imaging applications,” Progress In Electromagnetic Research , vol.
100, pp. 377–415, 2010.
[11] Time domain corporation, Comings Research Park, 330 Wynn Drive,
Suite 300, Hantsville, Al 35805, USA.
[12] M. Miyakawa, T. Ishida and M. Wantanabe, “Imaging capability of
an early stage breast tumor by CP-MCT,” inProc. of the 26th Annual
International Conference of the IEEE EMBS, September 1-5, 2004, vol. 1, pp. 1427-1430, San Francisco, CA, USA.
[13] M. Lazebnik, et al., “A large-scale study of the ultrawideband
microwave dielectric properties of normal, benign and malignant
breast tissues obtained from cancer surgeries,” IOP PUBLISHING,
Phys. Med. Biol., vol. 52, pp. 6093–6115, October 2007.
[14] G. Bindu, A. Lonappan, V. Thomas, V. Hamsakkutty, D. K.
Aanandan and K.T. Mathew, “ Microwave characterization of
breast-phantom materials,” Microwave and Optical Technology Letters, vol.
43, no. 6, pp.506-508, December 2004.
[15] M. Lazebnik, et al., “A large-scale study of the ultrawideband
microwave dielectric properties of normal breast tissues obtained
from reduction surgeries,” IOP PUBLISHING, Phys. Med. Biol., vol.
52, pp. 2637–2656, April 2007.
[16] Dielectric Constants of Common Materials
http://www.flowmeterdirectory.com/dielectric_constant_01.html
[17] N. Ahmed, T. Natarajan and K. R. Rao, “ Discrete cosine transform,