A b s t r a c t. On the basis of a 4–year study, the effect of fertilization methods on the uptake and accumulation of mineral components by maize was evaluated. Two methods were used: by broadcasting over the whole surface and by band fertilization. The applied fertilizer level was gradually increased from 17.4 to 56.7 kg P ha-1with the use of superphosphate and ammonium phosphate. It was found that the uptake and accumulation of mineral compo-nents depended on all the studied factors and their effect was increasing with the advancing vegetation. Band fertilization and the use of ammonium phosphate kept increasing the accumulation of all mineral components from 4-5 to 8-9-leaf-stage, in compari-son with broadcast fertilization and superphosphate application, respectively. No distinct effect of phosphorus fertilization level on the uptake and accumulation of mineral components was visible before the stage of 8-9 leaves. Regressions were calculated for the relationship between the mineral components accumulation and the lapse of time from emergence to 8-9-leaf-stage and for the relationship between the uptake of mineral components and the accumulation of dry matter.
K e y w o r d s: maize, fertilization, uptake, mineral components
INTRODUCTION
Slow initial growth of maize caused by low temperatures prevailing in that period is the result of decreased uptake of nutritive components, particularly of nitrogen and phosphorus (Mackay and Barber, 1984; Mozafaret al., 1993). Quick growth of maize root system permitting to limit the effects of nutritional stress is possible with an adequate nitrogen and phosphorus concentration in the soil solution (Alexandrova and Donov, 2003; Mollier
and Pellerin, 1999; Rhoads and Wright, 1998; Scroederet al., 1996). One of the ways of increasing phosphorus availability is the broadcasting of high doses of phosphoric fertilizer. In order to facilitate the uptake of this component by plants under unfavourable conditions, the doses must significantly exceed the nutritive requirements of maize. Such a procedure is not acceptable from the economic and ecological points of view. A significantly better method of increasing the availability of phosphorus is band fertilization, where the fertilizer is located in the direct vicinity of roots (El-Hamdi and Woodard, 1995; Mascagni and Boquet, 1996; Sleightet al., 1984; Tlustoset al., 1997). Localized fertilization for maize is a routine procedure in some countries, particularly in the USA (Arnon, 1975; Teare and Wright, 1990). Under Polish conditions, this problem is practically not fully recognized. So far, studies on the comparison of broadcast fertilization and band fertilization together with sowing (starting fertilization) were only fragmentary (Dubas and Duhr, 1983), or methodological assumptions limited the possibility of direct transfer of results to productive application (Koteret al., 1978). The aim of the present study was the determination of the effect of two methods of starting fertilization (by broadcasting and band fertilization) using phosphoric and phosphor-and-nitrogen fertilizers on the uptake and accumulation of mineral components by maize in the initial stage of development depending on phosphorus dose.
MATERIALS AND METHODS
The studies were carried out at the Experimental and Didactic Department in Swadzim near Poznañ, in the years
Effect of fertilization method on the uptake and accumulation of mineral components
in the initial period of maize development**
A. Kruczek* and P. Szulc
Department of Soil and Plant Cultivation, University of Agriculture, Mazowiecka 45/46, 60-623 Poznañ, Poland
Received March 23, 2005; accepted May 6, 2005
© 2006 Institute of Agrophysics, Polish Academy of Sciences
*Corresponding author’s e-mail: [email protected]
**This work was financed by budget support for science in Poland, Grant No. 6 P06B 050 20.
w
w
2000-2003. Field experiments were established in a 3-factor random split-plot design in 4 replications; each year on a dif-ferent plot. The first factor included four doses of phosphorus: 17.4 (40 kg P2O5ha-1), 30.5 (70 kg P2O5ha-1), 43.6 (100 kg P2O5ha-1), and 56.7 kg P ha-1(130 kg P2O5
ha-1). The second factor included two kinds of fertilizer: superphosphate (46% P2O5) and ammonium phosphate
(18% N and 46% P2O5). The third factor consisted of two
fertilization methods: by broadcasting over the whole surface before seed sowing and by band fertilization (starter fertilization together with seed sowing).
Single maize seed-drill equipped with a fertilizer sower for band fertilization was used. Fertilizer coulters were set in relation to seed coulters in such a way that the fertilizer was placed in the soil 5 cm aside and 5 cm below the seeds. Phosphorus fertilization was done according to the experimental scheme within the studied factors, while N and K fertilization was carried out before maize sowing in the doses of 120 kg N ha-1 (ammonium nitrate 34% N) and 107.9 kg K ha-1 (130 kg K2O ha-1) – 60% potash salt.
Nitrogen dose before sowing on the plots where ammonium phosphate was used was decreased by the amount of nitrogen introduced with this fertilizer. The size of plots for sowing was 42 m2(length 15 m, width 2.8 m – 4 rows). Plot area for observation and measurements was 21 m2(length 15 m, width 1.4 m – 2 middle rows). Mona hybrid (FAO 250) was the experimental plant.
In the developmental stages of 2-3 leaves, 4-5 leaves, 6-7 leaves and 8-9 leaves, 15 plants were sampled from each plot. Analyses of mineral components content were made (on cumulative samples from fertilizer combinations) in the laboratory of Agricultural and Chemical Station in Poznañ. Nitrogen was determined by Kjeldahl’s method, phosphorus and magnesium were identified by the colorimetric method, while potassium and calcium by the flame photometry method. The accumulation of mineral components by maize was calculated as the product of plant dry mass yield and the percentage content of the component. Results were statisti-cally analysed using univariant analysis of variance as well as regression and correlation calculus. Hypotheses were tested at the level ofa= 0.05.
Thermal conditions in the years of the experiment were favourable for the initial growth and development of maize (Table 1). In all the experimental years, in comparison with the mean of many years, there occurred water deficiencies in the soil. Periods of drought occurred in April and June of 2000, in May of 2001, and from May till June in 2003.
The experiments were carried out on grey-brown podzolic soil, medium sand type, lying shallowly on sandy loam and belonging to the good rye complex. Phosphorus and potassium content in the soil was determined by the Egner-Riehm method. Magnesium content was determined by the Schachtschabel method and nitrogen was identified by the distillation method. Soil abundance in nutritive components and soil acidity are shown in Table 1.
RESULTS AND DISCUSSION
The effect of the studied factors on the uptake and accumulation of mineral components by maize in the 2-3-leaf-stage was not high (Tables 2 and 3). Phosphorus fertilization levels exerted an effect only on the uptake and accumulation of sodium. The highest values of these levels were found after the application of 17.4 kg P ha-1, while the lowest ones were found after the application of 56.7 kg P ha-1. The use of ammonium phosphate increased nitrogen and potassium uptake, and nitrogen, potassium and magne-sium accumulation in comparison with superphosphate. Band fertilization had a positive effect only on the uptake and accumulation of magnesium in comparison with broadcast fertilization. The absence of a differentiated phosphorus uptake by maize under the influence of the studied factors including, among others, phosphorus doses and P and NP fertilizer forms, probably resulted from the insufficient amount of these components in the seed. As reported by Arnon (1975) and Rintelen (1971), the phosphorus contained in seeds satisfies the plant require-ments for about two weeks from the sowing date. In our own studies, the mean time (for 4 years) from the sowing date to the development of 2-3 maize leaves was 11 days.
With the progress of vegetation, the effect of the studied factors on the uptake and accumulation of mineral
Years Temperature Rainfall Soil conditions
April May June Mean April May June Total N-NH4 N-NO3 P K Mg pH in
KCl
(°C) (mm) (mg 100 g-1 dry mass of soil)
2000 2001 2002 2003 1958-2003
12.1 8.3 8.9 8.6 7.8
15.7 15.2 16.8 15.7 13.3
17.5 15.3 18.1 19.2 16.5
15.1 12.9 14.6 14.5 12.5
15.7 33.1 34.2 16.2 33.2
47.4 10.4 45.7 24.0 51.4
29.9 67.8 38.1 40.4 58.7
93.0 111.3 118.0 80.6 143.3
0.15 0.12 0.10 0.09
-0.46 0.32 0.30 0.50
-7.7 12.9 10.8 6.4
-16.0 13.5 12.3 5.2
-4.6 3.6 4.8 5.6
Development
stages Studied factors
Nutrients (mg per plant)
P N K Mg Na Ca
2-3 leaves
17.4 kg P ha-1 30.5 kg P ha-1 43.6 kg P ha-1 56.7 kg P ha-1
0.468 0.464 0.487 0.474 3.962 3.845 3.985 3.904 2.893 2.809 2.717 2.909 0.251 0.242 0.255 0.239 0.018 0.017 0.017 0.016 0.551 0.505 0.542 0.549 LSD0.05 superphosphate ammonium phosphate LSD0.05 broadcast fertilization band fertilization LSD0.05 n.s. 0.472 0.476 n.s. 0.469 0.478 n.s. n.s. 3.846 4.002 0.1093 3.878 3.970 n.s. n.s. 2.772 2.892 0.0785 2.824 2.840 n.s. n.s. 0.244 0.250 n.s. 0.242 0.251 0.0068 0.0012 0.017 0.017 n.s. 0.017 0.017 n.s. n.s. 0.532 0.541 n.s. 0.533 0.540 n.s. 4-5 leaves
17.4 kg P ha-1 30.5 kg P ha-1 43.6 kg P ha-1 56.7 kg P ha-1
1.186 1.272 1.457 1.620 12.811 12.953 13.849 14.493 10.982 10.814 10.351 11.474 0.727 0.690 0.726 0.750 0.058 0.062 0.065 0.066 2.034 1.941 1.968 2.068 LSD0.05 superphosphate ammonium phosphate LSD0.05 broadcast fertilization band fertilization LSD0.05 0.0945 1.282 1.486 0.0587 1.094 1.674 0.4650 0.9895 12.468 14.585 1.4959 12.339 14.714 2.3340 n.s. 10.676 11.134 0.3745 10.335 11.475 1.0727 n.s. 0.703 0.744 0.0280 0.694 0.753 0.0229 0.0045 0.062 0.064 n.s. 0.061 0.064 0.0019 n.s. 1.976 2.029 n.s. 1.952 2.053 0.0705 6-7 leaves
17.4 kg P ha-1 30.5 kg P ha-1 43.6 kg P ha-1 56.7 kg P ha-1
5.364 5.986 6.486 6.594 50.988 51.126 54.147 54.471 49.537 46.689 48.585 51.649 2.581 2.649 2.923 2.758 0.375 0.351 0.358 0.427 6.810 6.522 6.840 6.993 LSD0.05 superphosphate ammonium phosphate LSD0.05 broadcast fertilization band fertilization LSD0.05 0.6835 4.880 7.335 0.3885 3.660 8.554 0.4018 2.6031 44.444 60.922 2.8985 40.022 65.344 2.915 n.s. 46.545 51.685 2.5040 42.625 55.605 2.6126 n.s. 2.376 3.079 0.1539 2.139 3.317 0.1582 0.0392 0.364 0.391 0.0211 0.314 0.442 0.0220 n.s. 6.386 7.197 0.3198 5.788 7.795 0.3161 8-9 leaves
17.4 kg P ha-1 30.5 kg P ha-1 43.6 kg P ha-1 56.7 kg P ha-1
13.324 15.649 17.832 20.103 132.237 141.628 148.243 171.414 107.719 116.544 136.110 158.940 6.566 7.958 9.087 9.826 0.504 0.589 0.725 0.764 15.887 17.783 19.960 22.221 LSD0.05 superphosphate ammonium phosphate LSD0.05 broadcast fertilization band fertilization LSD0.05 2.4678 13.070 20.384 1.4512 10.572 22.882 1.3995 20.9383 128.188 168.573 12.4529 109.310 187.452 11.4399 18.5109 122.400 137.256 11.3519 109.059 150.597 9.6154 1.2576 6.995 9.723 0.8019 6.096 10.622 0.6966 0.0858 0.580 0.710 0.0555 0.505 0.786 0.0504 2.6966 17.377 20.548 1.5981 14.882 23.044 1.4375 n.s. – no significant differences.
Development
stages Studied factors
Nutrients (g ha-1)
P N K Mg Na Ca
17.4 kg P ha-1 30.5 kg P ha-1 43.6 kg P ha-1 56.7 kg P ha-1
38.01 37.81 39.79 38.61 320.81 313.60 324.61 317.14 235.50 229.67 221.51 237.30 20.35 19.75 20.80 19.39 1.49 1.37 1.39 1.28 44.41 44.04 44.07 44.48 2-3 leaves LSD0.05
superphosphate ammonium phosphate LSD0.05 broadcast fertilization band fertilization LSD0.05 n.s. 38.34 38.77 n.s. 38.29 38.83 n.s. n.s. 312.17 325.91 8.645 316.05 322.04 n.s. n.s. 225.68 236.31 6.432 230.91 231.08 n.s. n.s. 19.79 20.36 0.542 19.73 20.41 0.560 0.094 1.37 1.40 n.s. 1.38 1.39 n.s. n.s. 43.07 43.93 n.s. 43.34 43.66 n.s. 4-5 leaves
17.4 kg P ha-1 30.5 kg P ha-1 43.6 kg P ha-1 56.7 kg P ha-1
97.07 104.31 119.78 132.01 1045.23 1057.04 1132.79 1177.24 899.11 887.80 849.35 937.38 59.09 56.12 59.35 60.87 4.68 5.10 5.35 5.32 163.98 156.84 159.45 166.41 LSD0.05 superphosphate ammonium phosphate LSD0.05 broadcast fertilization band fertilization LSD0.05 7.603 104.81 121.78 9.006 89.59 137.00 39.980 80.434 1014.66 1191.49 131.615 1007.43 1198.72 33.656 n.s. 873.55 913.27 30.125 848.22 938.60 25.210 n.s. 57.05 60.66 2.226 56.51 61.20 1.785 0.371 5.03 5.19 n.s. 5.00 5.23 0.146 n.s. 159.29 164.05 n.s. 157.93 165.41 5.466 6-7 leaves
17.4 kg P ha-1 30.5 kg P ha-1 43.6 kg P ha-1 56.7 kg P ha-1
442.27 495.78 536.62 539.48 4193.63 4216.97 4442.95 4469.08 4078.52 3867.12 4019.78 4245.84 211.31 217.32 241.23 225.54 30.94 29.19 29.67 35.25 555.77 534.03 561.54 569.58 LSD0.05 superphosphate ammonium phosphate LSD0.05 broadcast fertilization band fertilization LSD0.05 56.197 401.27 605.81 33.665 301.55 705.53 34.202 260.750 3641.16 5020.15 249.740 3285.72 5375.59 246.699 n.s. 3832.89 4272.74 216.87 3518.17 4587.46 220.658 n.s. 194.06 253.64 13.264 175.11 272.59 13.397 3.197 30.11 32.42 1.840 25.94 36.58 1.849 n.s. 520.46 590.00 27.108 472.97 637.49 26.428 8-9 leaves
17.4 kg P ha-1 30.5 kg P ha-1 43.6 kg P ha-1 56.7 kg P ha-1
1034.85 1299.24 1323.56 1557.54 10282.18 10506.40 12173.97 13292.64 9111.82 9843.21 10099.93 11302.12 510.13 630.04 693.58 756.00 39.12 49.03 53.64 59.22 1306.32 1408.52 1459.12 1714.19 LSD0.05 superphosphate ammonium phosphate LSD0.05 broadcast fertilization band fertilization LSD0.05 192.855 1015.49 1592.11 106.930 824.24 1783.36 111.519 1620.778 9973.23 13154.37 928.566 8529.79 14597.81 909.326 1435.437 9511.21 10667.33 851.632 8506.43 11672.11 768.37 98.819 541.47 753.41 58.781 473.13 821.74 55.633 6.658 45.15 55.36 4.170 39.35 61.15 4.003 210.052 1347.26 1596.81 119.701 1157.27 1786.81 115.136 n.s. – no significant differences.
components by maize increased (Tables 2 and 3). In the stages of 4-5 and 6-7 leaves, the increase of phosphorus fertilization level increased also the uptake and accumu-lation of nitrogen and phosphorus and it changed these values with respect to sodium. On the other hand, in the 8-9-leaf-stage, the uptake and accumulation of all analysed mineral components increased gradually with the increase of phosphorus dose from 17.4 to 56.7 kg P ha-1. Similar results regarding phosphorus were obtained by El-Hamdi and Woodard (1995), who found an increase in the uptake of this component by maize with the increase of phosphorus dose.
The application of ammonium phosphate significantly increased, in comparison with superphosphate, the uptake and accumulation of P, N, K and Mg in the 4-5-leaf-stage and, additionally, it increased the uptake and accumulation of calcium and sodium in the stages of 6-7 and 8-9 leaves. The result obtained in the case of phosphorus was explained by Moskal (1972) who argued that the uptake and utilization of phosphorus by plants depends on the uptake of inorganic nitrogen compounds as a result of mutual physiological relations in plant metabolism.
Band fertilization significantly increased the uptake and accumulation of all mineral components, in relation to broadcast fertilization, both in the stages of 4-5, 6-7 and 8-9 leaves. A higher uptake of phosphorus by maize as a result of band fertilization was also found on the 28th day from the sowing date by El-Hamdi and Woodard (1995), and Rhoads and Wright (1998) reported the same observation on the 41st day from the sowing date.
With the progress of vegetation, there was also an increase in the influencing intensity of the studied factors on the uptake and accumulation of mineral components (Tables 2 and 3). For example, in the 4-5-leaf-stage, the increase of phosphorus dose from 17.4 to 56.7 kg P ha-1increased also the P uptake by 36.6% and the N uptake by 13.1%, while the accumulation of these elements increased by 36 and 12.6%, respectively. On the other hand, in the stage of 8-9 leaves, both the uptake and accumulation were increased by about 50.9 and 29.6%, respectively. In the case of the application of ammonium phosphate, in comparison with super-phosphate, in the 4-5-leaf-stage the P and N uptake increased by 15.9 and 17%, respectively, while P and N
accumulation increased by 16.2 and 17.4%, respectively. In the 8-9-leaf-stage, the uptake and accumulation of P and N increased by 56 and 31.5% and by 56.8 and 31.9%, respecti-vely. Band fertilization, in comparison with broadcasting fertilization, increased the P and N uptake by 53 and 19.2%, respectively, while the P and N accumulation increased by 52.9 and 19%, respectively. In the 8-9-leaf-stage, P uptake increased by 116.4% and N uptake by 71.5% while P and N accumulation increased by 116.4 and 71.1%, respectively.
Accumulation of dry mass, and thereby the occurrence of mineral components, is more associated with plant growth than with its development. In a definite development stage, depending on time lapse and different amounts of dry mass in the years, plants can accumulate different amounts of components. On this basis, we can conclude that it is more practical to determine the effect of the studied factors on the amount of accumulated mineral components for a definite amount of dry mass rather than to calculate it in reference to the developmental stage of maize, because it allows to minimize the impairing effect on the environment. Hence, in the calculus of regression presented below, the time lapse counted in days from full emergence to the occurrence of the definite developmental phase was accepted as independent variable. The occurrence variability of the particular developmental stages, differentiated under the influence of soil and climatic conditions, is presented in Table 4.
Relationships between the yield of dry mass or the accumulation of mineral components and the time lapse were described by an exponential model in the form:
y = axb,
where: y – yield of dry mass (kg ha-1) or accumulation of mineral components (g ha-1); x – number of days from emergence; a, b – regression coefficients.
Corresponding regressions are presented in Table 5 and the high coefficients of determination certify that the model has been well selected to describe this dependence. On the basis of these coefficients, the yields of dry mass for the particular developmental stages of maize and the uptake of mineral components were calculated (Table 6). As follows from the equations and from Table 6, the accumulation of dry mass, under the influence of the studied factors,
Development stage
Number of days from emergence Standard deviation Coefficient of variation
minimal maximal mean
2-3 leaves 4-5 leaves 6-7 leaves 8-9 leaves
4 10 18 31
5 11 19 34
4.25 10.5 18.5 32.5
0.5000 0.5774 0.5774 1.7321
occurred with different intensity in the particular developmental stages, disregarding the 2-3-leaf-stage where the effect of the studied factors was not high. The increase of phosphorus dose from 17.4 to 56.7 kg P ha-1caused the increase of the yield of plant dry mass by 6.9% after 10.5 days from emergence; 18.5 days after emergence, it increa-sed by 13.5%; and 32.5 days after emergence it increaincrea-sed by 20.4%. The application of ammonium phosphate increased the yield of plant dry mass, as compared with super-phosphate, by 10.6% after the lapse of 10.5 days from emergence, by 16.5% after 18.5 days from emergence and by 22.8% after 32.5 days from emergence. Band fertili-zation, in comparison with broadcasting fertilifertili-zation, in-creased the yield of plant dry mass by 20.0% after the lapse of 10.5 days from emergence; by 35.3% after 18.5 days from emergence; and by 52.5% after 32.5 days from emergence. This indicates that the highest positive effect on the
accumulation of dry mass in the initial period of maize development was exerted by the fertilization method, by the fertilizer type applied in an almost twice smaller amount and by the lowest level of phosphorus fertilization.
A more favourable effect of increased phosphorus dose, the use of ammonium phosphate and the application of band fertilization exerted on the uptake of mineral components was intensified with the lapse of time in the initial developmental stage of maize. The same situation was observed for the accumulation of dry mass (Tables 5 and 6). For example, the increase of phosphorus dose from 17.4 to 56.7 kg P ha-1, after the lapse of 10.5 days from emergence, increased the accumulation of P by 25.5%, N accumulation by 11.5% and K accumulation by 9.9%. After 18.5 days from emergence, P accumulation increased by 38.2%, N by 18.7% and K by 16.3%. After 32.5 days from emergence, P accumulation increased by 52.1%, N by 26.2% and K by
Specifi-cation
Coeffi-cients*
Studied factors
P dose (kg ha-1) Kind of fertilizer Method of fertilization
17.4 30.5 43.6 56.7
super-phosphate
ammonium phosphate
broadcast fertilization
band fertilization Yield of dry
mass
a b R2
0.4467 1.8351 0.9297
0.4080 1.8759 0.9330
0.4143 1.8742 0.9371
0.3730 1.9403 0.9523
0.4326 1.8381 0.9414
0.3848 1.9307 0.9372
0.4898 1.7634 0.9427
0.3568 1.9756 0.9346 P
accumulation a b R2
2.7276 1.6622 0.8849
2.4383 1.7460 0.8888
2.6692 1.7393 0.8993
2.2942 1.8323 0.9359
3.0026 1.6283 0.9068
2.1912 1.8465 0.9065
3.4252 1.5140 0.8967
2.0618 1.9057 0.9064 N
accumulation a b R2
21.924 1.7379 0.9178
20.1400 1.7837 0.9275
22.251 1.7595 0.9315
18.895 1.8475 0.9498
22.195 1.7177 0.9363
19.597 1.8403 0.9315
25.753 1.6361 0.94
17.644 1.8959 0.9275 K
accumulation a b R2
12.178 1.8946 0.9098
11.849 1.9037 0.9073
11.906 1.8932 0.9097
10.573 1.9947 0.9250
11.901 1.8995 0.9170
11.299 1.9463 0.9118
13.068 1.8412 0.9108
10.439 1.9952 0.9168 Mg
accumulation a b R2
1.6012 1.6276 0.9238
1.1888 1.7739 0.9328
1.4123 1.7115 0.9187
1.1245 1.8118 0.9303
1.4816 1.6555 0.9384
1.1761 1.8055 0.9217
1.6487 1.5873 0.9333
1.1041 1.8482 0.9237 Ca
accumulation a b R2
3.3844 1.7048 0.9473
2.7806 1.7784 0.9565
3.2153 1.7303 0.9468
2.7469 1.8190 0.9555
3.1987 1.7205 0.9553
2.8416 1.7976 0.9505
3.6134 1.6470 0.9519
2.6032 1.8414 0.9512 Na
accumulation a b R2
0.0929 1.7797 0.8745
0.0728 1.8964 0.8965
0.0785 1.8647 0.8916
0.0570 2.0165 0.8978
0.0806 1.8457 0.8943
0.0695 1.9304 0.8933
0.0970 1.7172 0.9502
0.0652 1.9431 0.9383 *a, b – coefficients of regression, R2– coefficient of determination.
23%. In relation to superphosphate, as a result of ammonium phosphate application, after 10.5 days from emergence the accumulation of P increased by 21.9%, N accumulation by 17.8% and that of K by 6%; 18.5 days after emergence, the values increased respectively by: 37.9% for P, 26.3% for N and 8.8% for K; and 32.5 days after emergence, the cor-responding values increased by 56% for P, by 35.3% for N and by 11.7% for K. Band fertilization, in comparison with broadcast fertilization, after the lapse of 10.5 days from
emergence, increased the accumulation of the respective elements by the following percentage values: P by 51.2%, N by 26.2% and K by 14.7%. After 18.5 days from emergence, the accumulation of the respective elements increased: P by 88.8%, N by 46.2% and K by 25.2%. After 32.5 days from emergence, the accumulation increased: P by 135.4%, N by 69.2% and K by 36.5%. Similar dependences referred to magnesium, calcium and sodium. The fertilization method was the studied factor which exerted the highest effect on Mean number of days after emergence Studied factors Dry mass
(kg ha-1) Accumulation (g ha
-1 )
P N K Mg Na Ca
4.25 days (2-3 leaves)
17.4 kg P ha-1 30.5 kg P ha-1 43.6 kg P ha-1 56.7 kg P ha-1
6.36 6.16 6.24 6.18 30.22 30.50 33.06 32.51 271.02 266.02 283.79 273.70 188.85 186.19 184.26 189.52 16.87 15.48 16.80 15.50 39.88 36.45 39.31 38.18 1.22 1.13 1.17 1.05 superphosphate ammonium phosphate broadcast fertilization band fertilization 6.18 6.29 6.28 6.22 31.67 31.70 30.62 32.49 266.46 280.94 274.75 274.13 185.87 188.83 187.59 187.25 16.26 16.03 16.39 16.01 38.56 38.30 39.16 37.92 1.16 1.14 1.16 1.09 10.5 days (4-5 leaves)
17.4 kg P ha-1 30.5 kg P ha-1 43.6 kg P ha-1 56.7 kg P ha-1
33.42 33.60 33.98 35.74 135.89 147.94 159.42 170.51 1305.10 1335.23 1393.58 1455.36 1047.90 1041.65 1021.13 1151.24 73.54 77.02 79.01 79.64 186.38 182.06 188.01 197.87 6.10 6.29 6.30 6.53 superphosphate ammonium phosphate broadcast fertilization band fertilization 32.59 36.04 30.96 37.14 138.13 168.39 120.44 182.11 1259.95 1484.17 1206.69 1522.90 1035.94 1097.95 991.80 1137.98 72.66 82.07 68.88 85.19 182.78 194.65 173.71 202.37 6.18 6.51 6.50 6.29 18.5 days (6-7 leaves)
17.4 kg P ha-1 30.5 kg P ha-1 43.6 kg P ha-1 56.7 kg P ha-1
94.49 97.22 98.23 107.25 348.40 397.71 426.95 481.36 3492.51 3667.02 3775.19 4144.04 3064.50 3061.94 2983.84 3563.08 184.88 210.35 208.30 222.24 489.50 498.51 500.97 554.41 16.72 18.42 18.10 20.47 superphosphate ammonium phosphate broadcast fertilization band fertilization 92.32 107.59 84.05 113.72 347.40 479.20 283.91 535.92 3333.31 4208.87 3048.23 4456.85 3037.92 3306.26 2814.01 3523.06 185.58 228.20 169.25 242.66 484.33 538.80 441.52 577.50 17.59 19.42 14.55 18.90 32.5 days (8-9 leaves)
17.4 kg P ha-1 30.5 kg P ha-1 43.6 kg P ha-1 56.7 kg P ha-1
maize nutrition level in all the analysed mineral compo-nents, expressed by their accumulation percentage. It indicates that, in practice, the optimal nutrition of maize plant in the initial period of development can be obtained with a decreased dose of the nutritive component in the fertilizer when it is used in the adequate form and in a localized way, as compared with the traditional broad-casting fertilization method and higher doses.
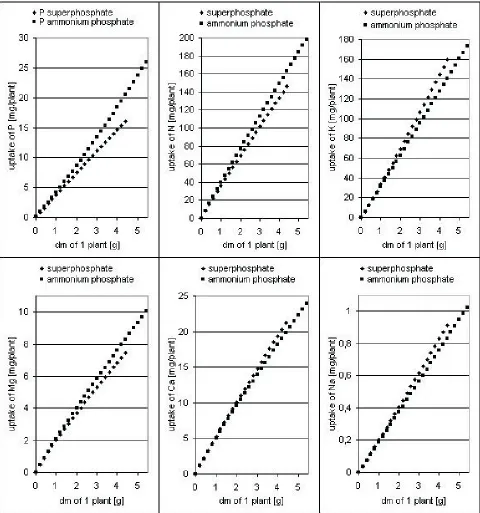
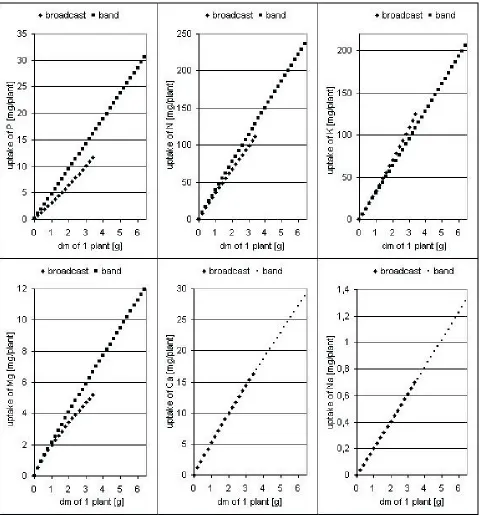
The relationships between the uptake of mineral components and the dry mass of the aboveground parts per plant were determined for all the studied factors. This dependence was described for phosphorus by the model of second order regression and for the remaining components by a power function. The equations have the following general form:
y = ax2+ bx + c or y = axb,
where: y – uptake of mineral component (mg per plant), x – dry mass of 1 plant (g), a, b, c – regression coefficients.
High coefficients of determination R2(Table 7) indicate that the model for the description of the relationships was selected well; they are graphically presented for the particular forms and fertilization methods (Figs 1 and 2), for the range of dry mass corresponding to real values. In the case of phosphorus doses, the course of some functions overlapped, making the graph illegible. The relationships between the uptaken amount of mineral components for all the investigated factors and the dry mass of the aboveground plant were similar. The studied factors differed, however, in the amount and accumulation rate of dry mass - hence, the amounts of mineral components taken up by plants in the particular developmental stages were different. The amounts of mineral components calculated according to the equation for the mean value of dry mass of one plant (Table 7) related to the studied factors in the particular developmental stages are shown in Table 8.
Nutrients Coeffi-cients*
Studied factors
P dose (kg ha-1) Kind of fertilizer Method of fertilization
17.4 30.5 43.6 56.7
super-phosphate
ammonium phosphate
broadcast fertilization
band fertilization
P a
b c R2
-0.0782 4.0190 -0.2054 0.9923
-0.0048 4.2471 -0.0651 0.9921
0.1381 3.8759 0.148 0.993
0.0187 4.3032 0.1183 0.9953
-0.0236 3.7461 0.0706 0.9927
0.1572 3.9190 0.1607 0.9789
0.2026 2.7078 0.1771 0.9936
0.0149 4.6628 0.0920 0.9753
N a
b R2
37.015 0.9525 0.9969
37.922 0.9481 0.9976
38.641 0.9430 0.9971
38.920 0.9538 0.9977
36.387 0.9384 0.9965
39.563 0.9557 0.9966
35.808 0.9275 0.9965
39.688 0.9609 0.9966
K a
b R2
32.788 1.0455 0.9884
31.871 1.0253 0.9866
30.667 1.0351 0.9888
33.112 1.0409 0.9878
33.528 1.0543 0.9885
30.963 1.0212 0.9852
33.762 1.0656 0.9886
31.190 1.0171 0.9800
Mg a
b R2
1.9747 0.8875 0.9968
2.1261 0.9339 0.9911
2.1168 0.9164 0.9904
2.0634 0.9359 0.9873
2.0102 0.8842 0.9821
2.1007 0.928 0.9901
1.9760 0.7869 0.9886
2.1285 0.9293 0.9898
Ca a
b R2
5.2133 0.9256 0.9801
5.1448 0.9335 0.9814
5.1291 0.9244 0.9854
5.2137 0.9390 0.9848
5.3015 0.9359 0.9807
5.0564 0.9228 0.9839
5.2023 0.9301 0.9784
5.1456 0.9276 0.9853
Na a
b R2
0.1912 0.9980 0.9646
0.1978 1.0234 0.9773
0.1937 1.0314 0.9818
0.2013 1.0611 0.9636
0.1998 1.026 0.9652
0.1845 1.0165 0.9672
0.1992 1.0237 0.9657
0.1927 1.0329 0.9718 Explanations as in Table 5.
CONCLUSIONS
1. The effect of the studied factors on dry mass accumu-lation, uptake and accumulation of mineral components by maize increased with time lapse from the emergence to the 8-9-leaf-stage.
2. Dry mass accumulation and plant nutrition level by phosphorus, nitrogen, potassium, magnesium, calcium and sodium depended in the highest degree on the fertilization method, in a lesser degree on fertilizer type, and in the least degree on phosphorus dose.
3. Localized band fertilization, as well as the 2-component NP fertilizer, had a stimulating effect on the initial growth of maize, which was demonstrated by an increased uptake of mineral components and in effect it gave a greater amount of plant dry mass as compared with broadcast fertilization and superphosphate application, respectively.
4. Band fertilization with a low dose of component allows to obtain the same effect of maize nutrition in the initial developmental stage as can be achieved by broadcast fertilization with higher doses.
Mean number of days after emergence Studied factors Dry mass (g)
Uptake (mg per plant)
P N K Mg Na Ca
4.25 days (2-3 leaves)
17.4 kg P ha-1 30.5 kg P ha-1 43.6 kg P ha-1 56.7 kg P ha-1
0.0946 0.0906 0.0918 0.0918 0.174 0.320 0.505 0.514 3.917 3.892 4.065 3.990 2.786 2.717 2.589 2.757 0.244 0.226 0.237 0.221 0.588 0.567 0.564 0.554 0.018 0.017 0.017 0.016 superphosphate ammonium phosphate broadcast fertilization band fertilization 0.0910 0.0970 0.0916 0.0920 0.411 0.542 0.427 0.521 3.838 4.256 3.901 4.006 2.679 2.859 2.644 2.755 0.241 0.241 0.301 0.232 0.563 0.587 0.563 0.563 0.017 0.017 0.017 0.016 10.5 days (4-5 leaves)
17.4 kg P ha-1 30.5 kg P ha-1 43.6 kg P ha-1 56.7 kg P ha-1
0.327 0.320 0.327 0.350 1.100 1.294 1.430 1.627 12.764 12.874 13.467 14.299 10.190 9.909 9.642 11.102 0.732 0.734 0.760 0.772 1.853 1.776 1.825 1.946 0.063 0.062 0.061 0.066 superphosphate ammonium phosphate broadcast fertilization band fertilization 0.318 0.344 0.314 0.348 1.259 1.527 1.047 1.717 12.417 14.269 12.229 14.386 10.019 10.413 9.826 10.660 0.730 0.780 0.794 0.798 1.814 1.889 1.771 1.933 0.062 0.062 0.061 0.065 18.5 days (6-7 leaves)
17.4 kg P ha-1 30.5 kg P ha-1 43.6 kg P ha-1 56.7 kg P ha-1
1.352 1.403 1.487 1.468 5.085 5.884 6.217 6.476 49.333 52.278 56.174 56.130 44.942 45.100 46.241 49.378 2.581 2.917 3.045 2.955 6.892 7.057 7.402 7.477 0.258 0.280 0.292 0.303 superphosphate ammonium phosphate broadcast fertilization band fertilization 1.306 1.591 1.198 1.699 4.923 6.794 3.712 8.057 46.746 61.663 42.340 66.014 44.427 49.750 40.929 53.474 2.545 3.232 2.278 3.483 6.806 7.762 6.154 8.413 0.263 0.296 0.240 0.333 32.5 days (8-9 leaves)
17.4 kg P ha-1 30.5 kg P ha-1 43.6 kg P ha-1 56.7 kg P ha-1
REFERENCES
Alexandrova P. and Donov D., 2003.Nitrogen content and its uptake by maize as influenced by some meteorogical elements and fertilization. Int. Agrophysics, 17, 41-45. Arnon I., 1975.Mineral Nutrition of Maize. Int. Potash Institute
Press, Bern-Worblaufen, Switzerland.
Dubas A. and Duhr E., 1983.Effect of method of phosphorus fertilizer application on the yield of maize (in Polish). Pam. Pu³., 81, 131-139.
El-Hamdi K.H. and Woodard H.J., 1995.Response of early corn growth to fertilizer phosphorus rates and placement methods. J. Plant Nutr., 18(6), 1103-1120.
Koter Z., Jeœmanowicz A., Krawczyk Z., and Kuku³a S., 1978. Growth and yield of two maize hybrids depending on the method of mineral fertilizers application (in Polish). IUNG Pu³awy Press, 132, 24-36.
Mackay A.D. and Barber S.A., 1984.Soil temperature effects on root growth and phosphorus uptake by corn. Soil Sci. Soc. Am. J., 48, 818-823.
Mascagni J.H. and Boquet J.D., 1996.Starter fertilizer and planting date effects on corn rotated with cotton. Agron. J., 88, 975-981. Mollier A. and Pellerin S., 1999.Maize root system growth and
development as influenced by phosphorus deficiency. J. Exp. Botany, 50(333), 487-497.
Moskal S., 1972.Transformations of phosphoric fertilizers in the soil (in Polish). Prace Nauk. Inst. Tech. Nieorg. i Nawozów Miner., Politechnika Wroc³awska, 4, 33-87.
Mozafar A., Schreiber P., and Oertli J.J., 1993.Photoperiod and root-zone temperature: Interacting effects on growth and mineral nutrients of maize. Plant and Soil, 153, 71-78. Rhoads F.M. and Wright D.L., 1998.Root mass as a determinant
of corn hybrid response to starter fertilizer. J. Plant Nutr., 21(8), 1743-1751.
Rintelen P., 1971.Mais, ein Handbuch über Produktionstechnik und Ökonomik. DLG Verlag, Frankfurt/Main.
Scroeder J.J., Groenwold J., and Zaharieva T., 1996. Soil mineral nitrogen availability to young maize plants as related to root density distribution and fertilizer application method. Netherland J. Agric. Sci., 44(3), 209-225. Sleight D.M., Sander D.H., and Peterson G.A., 1984.Effect of
fertilizer phosphorus placement on the availability of phosphorus. Soil Sci. Soc. Am. J., 48, 336-340.
Teare I.D. and Wright D.L., 1990.Corn hybrid-Starter fertilizer interaction for yield and lodging. Crop Sci., 30, 1298-1303. Tlustos P., Balik J., Pavlikova D., and Vanek V., 1997.The