A Monthly Double-Blind Peer Reviewed Refereed Open Access International e-Journal - Included in the International Serial Directories Indexed & Listed at:
Ulrich's Periodicals Directory ©, ProQuest, U.S.A., EBSCO Publishing, U.S.A., Cabell’s Directories of Publishing Opportunities, U.S.A. as well as in Open J-Gage, India [link of the same is duly available at Inflibnet of University Grants Commission (U.G.C.)]
VOLUME NO.2(2012),ISSUE NO.5(MAY) ISSN2231-5756
CONTENTS
CONTENTS
CONTENTS
CONTENTS
Sr.No.
TITLE & NAME OF THE AUTHOR (S)
Page No.
1. CUSTOMER RELATIONSHIP MANAGEMENT: A CASE STUDY OF BRITISH TELECOM BROADBAND CUSTOMERS HYDER KAMRAN & NITIN RAJ SRIVASTAVA
1 2. INFLUENCE OF ORGANIZATIONAL STRUCTURE, SOCIAL INTERACTION AND DEMOGRAPHICAL VARIABLES ON ORGANIZATIONAL
COMMITMENT: AN EMPIRICAL ASSESSMENT OF TWO LEVELS OF EMPLOYEES OF SAUDI ARABIA DR. NASSER S. AL-KAHTANI
7
3. FINANCIAL DEREGULATIONS AND PRODUCTIVITY CHANGE IN PAKISTAN BANKING INDUSTRY RAFAQET ALI & MUHAMMAD AFZAL
12 4. BRILLIANT INTELLIGENCE AND INTERNAL MARKETING EFFECT ON ORGANIZATIONAL CITIZENSHIP BEHAVIOR- STUDY OF EMPLOYEE IN
HIGH TECHNOLOGY INDUSTRY
FENG-LI LIN, JUI-YING HUNG & KUO-SONG LU
17
5. AN IDENTIFICATION OF CRITICAL STRATEGIC SUCCESS FACTORS THAT MAKES ETHIOPIA ONE OF THE MOST ATTRACTIVE TOURIST DESTINATION
DR. GETIE ANDUALEM IMIRU
25
6. BARRIERS TO KNOWLEDGE MANAGEMENT IMPLEMENTATION IN UNIVERSITIES ROYA DARABI & AHMAD GHASEMI
32 7. AN ASSESSMENT OF BANGLADESHI COMMERCIAL BANKS TREND TOWARDS UNIVERSAL BANKING
MD. AL MAMUN
37 8. COMPARISON OF IMAGE ENHANCEMENT TECHNIQUES
ABDUL RASAK ZUBAIR
44 9. STATIONARY DEMAND CURVE MODEL UNDER JUST IN TIME INVENTORY SYSTEM
DR. KAVITA DAVE & DR. NITIN D. SHAH
53 10. A STUDY OF LEADERSHIP STYLES IN PUBLIC-SECTOR ENTERPRISES (A CASE STUDY OF BHARATH EARTH MOVERS LIMITED)
K. V. GEETHA DEVI, DR. G. RAMA KRISHNA REDDY & DR. G.HARANATH
55 11. A STUDY ON CONSUMER AWARENESS, USAGE PENETRATION AND ADOPTION OF 3G MOBILE SERVICES IN INDIA
SARIKA KHANNA & DR. NISHA AGARWAL
64 12. THE IMPACT OF WORKPLACE STRESS ON HEALTH: THE MEDIATING ROLE OF SPIRITUALITY IN THE WORKPLACE
NAGALAKSHMI. P & DR. K. JAWAHAR RANI
69 13. EMPLOYMNET TO WOMEN IN INDIAN BEEDI INDUSTRY AN OPPORTUNITY OR THREAT: A CASE STUDY OF NIZAMABAD DISTRICT
GIRISH KUMAR PAINOLI
72 14. CELEBRITY ADVERTISEMENT AND ITS IMPACT ON BUYING BEHAVIOUR
DR. S. BANUMATHY & DR. M. SUBASINI
76 15. INFLUENCE OF PERSONALITY ON QUALITY OF WORK LIFE OF TEACHERS
J. PARAMESWARI & DR. S. KADHIRAVAN
79 16. LEADERSHIP ENHANCEMENT THROUGH ASSESSMENT AND DEVELOPMENT (LEAD) AT ALPHA PHARMACEUTICALS INDIA PRIVATE LTD.
DR. GOWRI JOSHI & DR. BHARATI DESHPANDE
83 17. ANALYSIS OF CUSTOMERS’PERCEPTION IN INDIAN BANKING SECTOR
DR. ROSY KALRA
86 18. DEMOGRAPHIC CHARACTERISTICS OF EMPLOYEES IN INFORMATION TECHNOLOGY INDUSTRY IN INDIA
DR. DEEPAKSHI GUPTA
93 19. IMPACT OF ANIMATION ON CHILDREN
J. J. SOUNDARARAJ & DR. D. V. S. JANAKIDAS
98 20. A CASE STUDY ON TRAINING AND DEVELOPMENT WITH REFERENCE TO NUTRINE CONFECTIONERY COMPANY LTD., CHITTOOR (A.P)
C. RAJANIKANTH
109 21. SHIFTING PARADIGMS IN TEACHING PEDAGOGY OF B-SCHOOLS
PRITAM P. KOTHARI, AVINASH A. DHAVAN & SHIVGANGA C. MINDARGI
116 22. IMERATIVES FOR GLOBAL RETAILERS EYEING INDIAN RETAIL MARKET- A STUDY OF WAL MART
DR. SIDDHARATHA S BHARDWAJ & DR. MAMTA RANI
122 23. CUSTOMERS' PERCEPTION TOWARDS E-BANKING SERVICES OF THE COMMERCIAL BANKS IN CUDDALORE DISTRICT
RAVICHANDRAN & DR. A. MURUGARATHINAM
125 24. CUSTOMER RETENTION CHALLENGES IN THE HYPERCOMPETITIVE INDIAN INDUSTRIES
NIDHI KHURANA & AJEET KUMAR PATHAK
128 25. SERVICES INNOVATION INSIDE AND OUTSIDE OF THE ORGANIZATION WITH THE HELP OF ICT
DR. RAJESH N. PAHURKAR
133 26. CREATING A SYSTEMATIC TRADING PLAN WITH AT THE MONEY CALENDAR CALL SPREAD IN NIFTY
PRIYANKA VASHISHT
137 27. GENDER EMPOWERMENT IN PRACTICE: A CASE STUDY OF BHARAT COKING COAL LIMITED, DHANBAD
DR. N. C. PAHARIYA & ABHINAV KUMAR SHRIVASTAVA
143 28. RETAIL STORE SELECTION CRITERIA USED BY CUSTOMERS IN DELHI-NCR: IMPLICATIONS FOR THE RETAILERS
ANOOP KUMAR GUPTA
147 29. CUSTOMER RELATIONSHIP MANAGEMENT IN TELECOM INDUSTRY – WITH REFERENCE TO BHARTI AIRTEL, ANDHRA PRADESH
DR. K. RAJI REDDY, DR. D.THIRUVENGALA CHARY & SHATHABOINA. RAJU
152 30. INITIATIVE TAKEN TOWARDS RETAIL MARKETING IN INDIA WITH REFERENCE TO LUCKNOW CITY (U.P.), INDIA
SMRITI SRIVASTAVA & RAJEEV GUPTA
156
INTERNATIONAL JOURNAL OF RESEARCH IN COMMERCE, IT & MANAGEMENT
CHIEF PATRON
CHIEF PATRON
CHIEF PATRON
CHIEF PATRON
PROF. K. K. AGGARWAL
Chancellor, Lingaya’s University, Delhi
Founder Vice-Chancellor, Guru Gobind Singh Indraprastha University, Delhi
Ex. Pro Vice-Chancellor, Guru Jambheshwar University, Hisar
PATRON
PATRON
PATRON
PATRON
SH. RAM BHAJAN AGGARWAL
Ex. State Minister for Home & Tourism, Government of Haryana
Vice-President, Dadri Education Society, Charkhi Dadri
President, Chinar Syntex Ltd. (Textile Mills), Bhiwani
CO
CO
CO
CO----ORDINATOR
ORDINATOR
ORDINATOR
ORDINATOR
AMITA
Faculty, Government M. S., Mohali
ADVISORS
ADVISORS
ADVISORS
ADVISORS
DR. PRIYA RANJAN TRIVEDI
Chancellor, The Global Open University, Nagaland
PROF. M. S. SENAM RAJU
Director A. C. D., School of Management Studies, I.G.N.O.U., New Delhi
PROF. M. N. SHARMA
Chairman, M.B.A., Haryana College of Technology & Management, Kaithal
PROF. S. L. MAHANDRU
Principal (Retd.), Maharaja Agrasen College, Jagadhri
EDITOR
EDITOR
EDITOR
EDITOR
PROF. R. K. SHARMA
Professor, Bharti Vidyapeeth University Institute of Management & Research, New Delhi
CO
CO
CO
CO----EDITOR
EDITOR
EDITOR
EDITOR
DR. BHAVET
Faculty, M. M. Institute of Management, Maharishi Markandeshwar University, Mullana, Ambala, Haryana
EDITORIAL ADVISORY BOARD
EDITORIAL ADVISORY BOARD
EDITORIAL ADVISORY BOARD
EDITORIAL ADVISORY BOARD
DR. RAJESH MODI
Faculty, Yanbu Industrial College, Kingdom of Saudi Arabia
PROF. SANJIV MITTAL
University School of Management Studies, Guru Gobind Singh I. P. University, Delhi
PROF. ANIL K. SAINI
Chairperson (CRC), Guru Gobind Singh I. P. University, Delhi
DR. SAMBHAVNA
Faculty, I.I.T.M., Delhi
DR. MOHENDER KUMAR GUPTA
VOLUME NO.2(2012),ISSUE NO.5(MAY) ISSN2231-5756
DR. SHIVAKUMAR DEENE
Asst. Professor, Dept. of Commerce, School of Business Studies, Central University of Karnataka, Gulbarga
MOHITA
Faculty, Yamuna Institute of Engineering & Technology, Village Gadholi, P. O. Gadhola, Yamunanagar
ASSOCIATE EDITORS
ASSOCIATE EDITORS
ASSOCIATE EDITORS
ASSOCIATE EDITORS
PROF. NAWAB ALI KHAN
Department of Commerce, Aligarh Muslim University, Aligarh, U.P.
PROF. ABHAY BANSAL
Head, Department of Information Technology, Amity School of Engineering & Technology, Amity University, Noida
PROF. A. SURYANARAYANA
Department of Business Management, Osmania University, Hyderabad
DR. ASHOK KUMAR
Head, Department of Electronics, D. A. V. College (Lahore), Ambala City
DR. SAMBHAV GARG
Faculty, M. M. Institute of Management, Maharishi Markandeshwar University, Mullana, Ambala, Haryana
PROF. V. SELVAM
SSL, VIT University, Vellore
DR. PARDEEP AHLAWAT
Reader, Institute of Management Studies & Research, Maharshi Dayanand University, Rohtak
S. TABASSUM SULTANA
Associate Professor, Department of Business Management, Matrusri Institute of P.G. Studies, Hyderabad
SURJEET SINGH
Asst. Professor, Department of Computer Science, G. M. N. (P.G.) College, Ambala Cantt.
TECHNICAL
TECHNICAL
TECHNICAL
TECHNICAL ADVISOR
ADVISOR
ADVISOR
ADVISOR
AMITA
Faculty, Government H. S., Mohali
MOHITA
Faculty, Yamuna Institute of Engineering & Technology, Village Gadholi, P. O. Gadhola, Yamunanagar
FINANCIAL ADVISORS
FINANCIAL ADVISORS
FINANCIAL ADVISORS
FINANCIAL ADVISORS
DICKIN GOYAL
Advocate & Tax Adviser, Panchkula
NEENA
Investment Consultant, Chambaghat, Solan, Himachal Pradesh
LEGAL ADVISORS
LEGAL ADVISORS
LEGAL ADVISORS
LEGAL ADVISORS
JITENDER S. CHAHAL
Advocate, Punjab & Haryana High Court, Chandigarh U.T.
CHANDER BHUSHAN SHARMA
Advocate & Consultant, District Courts, Yamunanagar at Jagadhri
SUPERINTENDENT
SUPERINTENDENT
SUPERINTENDENT
SUPERINTENDENT
SURENDER KUMAR POONIA
INTERNATIONAL JOURNAL OF RESEARCH IN COMMERCE, IT & MANAGEMENT
CALL FOR MANUSCRIPTS
CALL FOR MANUSCRIPTS
CALL FOR MANUSCRIPTS
CALL FOR MANUSCRIPTS
Weinvite unpublished novel, original, empirical and high quality research work pertaining to recent developments & practices in the area of Computer, Business, Finance, Marketing, Human Resource Management, General Management, Banking, Insurance, Corporate Governance and emerging paradigms in allied subjects like Accounting Education; Accounting Information Systems; Accounting Theory & Practice; Auditing; Behavioral Accounting; Behavioral Economics; Corporate Finance; Cost Accounting; Econometrics; Economic Development; Economic History; Financial Institutions & Markets; Financial Services; Fiscal Policy; Government & Non Profit Accounting; Industrial Organization; International Economics & Trade; International Finance; Macro Economics; Micro Economics; Monetary Policy; Portfolio & Security Analysis; Public Policy Economics; Real Estate; Regional Economics; Tax Accounting; Advertising & Promotion Management; Business Education; Management Information Systems (MIS); Business Law, Public Responsibility & Ethics; Communication; Direct Marketing; E-Commerce; Global Business; Health Care Administration; Labor Relations & Human Resource Management; Marketing Research; Marketing Theory & Applications; Non-Profit Organizations; Office Administration/Management; Operations Research/Statistics; Organizational Behavior & Theory; Organizational Development; Production/Operations; Public Administration; Purchasing/Materials Management; Retailing; Sales/Selling; Services; Small Business Entrepreneurship; Strategic Management Policy; Technology/Innovation; Tourism, Hospitality & Leisure; Transportation/Physical Distribution; Algorithms; Artificial Intelligence; Compilers & Translation; Computer Aided Design (CAD); Computer Aided Manufacturing; Computer Graphics; Computer Organization & Architecture; Database Structures & Systems; Digital Logic; Discrete Structures; Internet; Management Information Systems; Modeling & Simulation; Multimedia; Neural Systems/Neural Networks; Numerical Analysis/Scientific Computing; Object Oriented Programming; Operating Systems; Programming Languages; Robotics; Symbolic & Formal Logic and Web Design. The above mentioned tracks are only indicative, and not exhaustive.
Anybody can submit the soft copy of his/her manuscript anytime in M.S. Word format after preparing the same as per our submission guidelines duly available on our website under the heading guidelines for submission, at the email addresses: [email protected]or
GUIDELINES FOR SUBMISSION OF MANUSCRIPT
GUIDELINES FOR SUBMISSION OF MANUSCRIPT
GUIDELINES FOR SUBMISSION OF MANUSCRIPT
GUIDELINES FOR SUBMISSION OF MANUSCRIPT
1. COVERING LETTER FOR SUBMISSION:
DATED: _____________
THE EDITOR
IJRCM
Subject: SUBMISSION OF MANUSCRIPT IN THE AREA OF .
(e.g. Finance/Marketing/HRM/General Management/Economics/Psychology/Law/Computer/IT/Engineering/Mathematics/other, please specify)
DEAR SIR/MADAM
Please find my submission of manuscript entitled ‘___________________________________________’ for possible publication in your journals.
I hereby affirm that the contents of this manuscript are original. Furthermore, it has neither been published elsewhere in any language fully or partly, nor is it under review for publication elsewhere.
I affirm that all the author (s) have seen and agreed to the submitted version of the manuscript and their inclusion of name (s) as co-author (s).
Also, if my/our manuscript is accepted, I/We agree to comply with the formalities as given on the website of the journal & you are free to publish our contribution in any of your journals.
NAME OF CORRESPONDING AUTHOR: Designation:
Affiliation with full address, contact numbers & Pin Code: Residential address with Pin Code:
Mobile Number (s): Landline Number (s): E-mail Address: Alternate E-mail Address:
NOTES:
a) The whole manuscript is required to be in ONE MS WORD FILE only (pdf. version is liable to be rejected without any consideration), which will start from the covering letter, inside the manuscript.
b) The sender is required to mention the following in the SUBJECT COLUMN of the mail:
New Manuscript for Review in the area of (Finance/Marketing/HRM/General Management/Economics/Psychology/Law/Computer/IT/ Engineering/Mathematics/other, please specify)
c) There is no need to give any text in the body of mail, except the cases where the author wishes to give any specific message w.r.t. to the manuscript. d) The total size of the file containing the manuscript is required to be below 500 KB.
e) Abstract alone will not be considered for review, and the author is required to submit the complete manuscript in the first instance.
f) The journal gives acknowledgement w.r.t. the receipt of every email and in case of non-receipt of acknowledgment from the journal, w.r.t. the submission of manuscript, within two days of submission, the corresponding author is required to demand for the same by sending separate mail to the journal.
2. MANUSCRIPT TITLE: The title of the paper should be in a 12 point Calibri Font. It should be bold typed, centered and fully capitalised.
3. AUTHOR NAME (S) & AFFILIATIONS: The author (s) full name, designation, affiliation (s), address, mobile/landline numbers, and email/alternate email address should be in italic & 11-point Calibri Font. It must be centered underneath the title.
VOLUME NO.2(2012),ISSUE NO.5(MAY) ISSN2231-5756
5. KEYWORDS: Abstract must be followed by a list of keywords, subject to the maximum of five. These should be arranged in alphabetic order separated by commas and full stops at the end.
6. MANUSCRIPT: Manuscript must be in BRITISH ENGLISH prepared on a standard A4 size PORTRAIT SETTING PAPER. It must be prepared on a single space and single column with 1” margin set for top, bottom, left and right. It should be typed in 8 point Calibri Font with page numbers at the bottom and centre of every page. It should be free from grammatical, spelling and punctuation errors and must be thoroughly edited.
7. HEADINGS: All the headings should be in a 10 point Calibri Font. These must be bold-faced, aligned left and fully capitalised. Leave a blank line before each heading.
8. SUB-HEADINGS: All the sub-headings should be in a 8 point Calibri Font. These must be bold-faced, aligned left and fully capitalised.
9. MAIN TEXT: The main text should follow the following sequence:
INTRODUCTION
REVIEW OF LITERATURE
NEED/IMPORTANCE OF THE STUDY
STATEMENT OF THE PROBLEM
OBJECTIVES
HYPOTHESES
RESEARCH METHODOLOGY
RESULTS & DISCUSSION
FINDINGS
RECOMMENDATIONS/SUGGESTIONS
CONCLUSIONS
SCOPE FOR FURTHER RESEARCH
ACKNOWLEDGMENTS
REFERENCES
APPENDIX/ANNEXURE
It should be in a 8 point Calibri Font, single spaced and justified. The manuscript should preferably not exceed 5000 WORDS.
10. FIGURES &TABLES: These should be simple, crystal clear, centered, separately numbered & self explained, and titles must be above the table/figure. Sources of data should be mentioned below the table/figure. It should be ensured that the tables/figures are referred to from the main text.
11. EQUATIONS: These should be consecutively numbered in parentheses, horizontally centered with equation number placed at the right.
12. REFERENCES: The list of all references should be alphabetically arranged. The author (s) should mention only the actually utilised references in the preparation of manuscript and they are supposed to follow Harvard Style of Referencing. The author (s) are supposed to follow the references as per the following:
•
All works cited in the text (including sources for tables and figures) should be listed alphabetically.•
Use (ed.) for one editor, and (ed.s) for multiple editors.•
When listing two or more works by one author, use --- (20xx), such as after Kohl (1997), use --- (2001), etc, in chronologically ascending order.•
Indicate (opening and closing) page numbers for articles in journals and for chapters in books.•
The title of books and journals should be in italics. Double quotation marks are used for titles of journal articles, book chapters, dissertations, reports, working papers, unpublished material, etc.•
For titles in a language other than English, provide an English translation in parentheses.•
The location of endnotes within the text should be indicated by superscript numbers.PLEASE USE THE FOLLOWING FOR STYLE AND PUNCTUATION IN REFERENCES: BOOKS
•
Bowersox, Donald J., Closs, David J., (1996), "Logistical Management." Tata McGraw, Hill, New Delhi.•
Hunker, H.L. and A.J. Wright (1963), "Factors of Industrial Location in Ohio" Ohio State University, Nigeria. CONTRIBUTIONS TO BOOKS•
Sharma T., Kwatra, G. (2008) Effectiveness of Social Advertising: A Study of Selected Campaigns, Corporate Social Responsibility, Edited by David Crowther & Nicholas Capaldi, Ashgate Research Companion to Corporate Social Responsibility, Chapter 15, pp 287-303.JOURNAL AND OTHER ARTICLES
•
Schemenner, R.W., Huber, J.C. and Cook, R.L. (1987), "Geographic Differences and the Location of New Manufacturing Facilities," Journal of Urban Economics, Vol. 21, No. 1, pp. 83-104.CONFERENCE PAPERS
•
Garg, Sambhav (2011): "Business Ethics" Paper presented at the Annual International Conference for the All India Management Association, New Delhi, India, 19–22 June.UNPUBLISHED DISSERTATIONS AND THESES
•
Kumar S. (2011): "Customer Value: A Comparative Study of Rural and Urban Customers," Thesis, Kurukshetra University, Kurukshetra. ONLINE RESOURCES•
Always indicate the date that the source was accessed, as online resources are frequently updated or removed. WEBSITEINTERNATIONAL JOURNAL OF RESEARCH IN COMMERCE, IT & MANAGEMENT
CREATING A SYSTEMATIC TRADING PLAN WITH AT THE MONEY CALENDAR CALL SPREAD IN NIFTY
PRIYANKA VASHISHT
ASST. PROFESSOR
BADDI UNIVERSITY OF EMERGING SCIENCES & TECHNOLOGY
BADDI
ABSTRACT
In the retail investor segment, brokers receive meagre brokerage revenues from the Options segment of Stock Market. Retail Investors have limited or no knowledge about options segment of the market, and also there is a huge perception among them that trading options is extremely risky. Thus, there is a need to create a Systematic Trading Plan in options which carries low risk and is easy to understand. A Research was conducted in Nifty (Index of National Stock Exchange) to quantify the risk and returns for At the Money Calendar Spread (An Options Strategy). Quantitative results are shown by applying At the Money Calendar Call Spread in Nifty for a period of 42 weeks, and results show remarkable profits with low risk by acting only twice on monthly basis at a prescribed time, and in a prescribed simplistic manner. Even a beginner in stock market can take such simplistic decisions. By entering At the Money Calendar Spread in Nifty on first day of a week before Current Month Expiry in a prescribed manner, and exiting on current month expiry, traders can make a net annualized return of 44%.
KEYWORDS
At the Money Calendar Call Spread, Fixed entry and exit points, Nifty Options, Simplistic decisions, Systematic Trading Plan.
INTRODUCTION
f we analyze the average brokerage received from the retail traders (with lack of in-depth knowledge of Stock Market) by leading brokerage houses from different segments of Stock Market, Brokerage from Options segment is the least. Options are a relatively newer segment in Stock Market, and retail traders have limited knowledge of the same. They mainly follow basic Option strategies involving low margin requirements like Long Strangles and Long Straddles. These strategies work only if there is a huge move in the Stock (More than 5-6%) in either direction from the point of entry till expiry of Monthly F&O Series. This often is not the case, and traders end up with 100% loss of their capital invested in these strategies (because of time decay of premium) on expiry. This has created a Perception among retail investors that Options are highly risky instruments of trading. This Perception partially explains the reluctance of retail traders to allocate funds to options segment, and thus explains the lack of revenues of Stock Brokers from this segment. To boost the trader sentiment, and to help the brokers to increase their revenues from Options segment, there is a serious case of educating retail traders about the relatively safer strategies in Options Leading Stock Brokers often organise investor camps for their clients. They can explain these strategies to their clients/ prospective clients in such camps. However, considering the average awareness level about options among general retail traders/ prospective traders, there is a need to create a Systematic Trading Plan in Options which has low risk, is easy to explain, and can be easily implemented by the traders/ prospective traders.
Calendar Spread is a relatively safe strategy in Options. Calendar Spread involves simultaneous buying and selling of equal quantity of options of the same stock and type with same strike price but different expiration Months. In Calendar Spread, far month options are bought, and near month options are sold. Calendar spread can be created with both Calls and Puts, and is also known as time spread or horizontal spread. When this strategy is created by using calls, it’s called Calendar Call spread. Near month options depreciate faster than far month options, and this is the essence of this strategy. Maximum gains are pocketed if the Stock remains neutral. This will ensure almost total depreciation of near month options on expiry. Far month options will still have substantial premiums attached to them, and hence result in reasonable profits for the traders. Important to note about Calendar spreads is that they will give profits only in a certain range. The profit range will vary with the different strike prices chosen, as well as with entry at different time points. If stock moves out of this range, either on the upside or on the downside, losses are limited. Absolute losses on expiry will depend upon how far away the stock is from the chosen strike price. On breakdown towards the downside, near month shorted call will become zero and will give maximum possible profit. However, more the stock falls from the chosen strike price, more will be the fall in far month bought call, and more will be the losses. As Option premiums can never be negative, the total loss will remain restricted. Maximum Loss will be limited to the difference between the premium paid to buy far month call, and the premium received by selling the near month call. On breakout towards the upside, as the stock price rises above the chosen strike price, there will be an increase in premiums of both bought and sold calls. If the chosen strike price becomes deep in the money, both the near month and far month calls will approach their intrinsic or expiry value (which will be the same for both near month and far month calls). Maximum Loss in this case will again be limited to the difference between the premium paid to buy far month call, and the premium received by selling the near month call.
In Indian Stock Markets, highest volumes in Options come from Nifty. A Research was conducted in Nifty by entering Calendar spread during different time points in a monthly F&O series. Aim of this research was to create a Systematic and Simple Trading Plan for retail traders which has low risk, is easy to explain, is easy to implement by the retail traders, and earns decent profits. This can be introduced by the Stock Brokers to their retail clients/ prospective clients in the Investor Camps, or through mailers. At the Money Strike price was chosen for creating Calendar Spread, and Monthly Expiry was chosen as the Exit Point. Time Period for research was between January 2008 and June 2011.
OBJECTIVES OF RESEARCH
Objectives of Research are summarized as under:
• To create a Systematic Trading Plan with Low Risk At the money Calendar Call Spread in Nifty
• To create the plan in such a manner that it is easy to understand by the Retail Investors, and is also perceived as a low risk trading instrument
• To help increase revenues of brokers from options from the retail investor segment
RESEARCH DESIGN
Nifty was the Stock chosen for research. Analysis of Historical Options data for Indian Markets suggests that Nifty generates the highest volumes in Options (In both quantity and Rupee terms). Nifty is thus the most liquid stock in options, and hence was chosen for research. Apart from a few other stocks like Reliance and State Bank of India, liquidity in options is much lower. Calls of At the Money strike price were chosen to create calendar spreads. At the Money Calls were chosen as this strike price gives maximum time value in near month series. As discussed above, the essence of this strategy is that current month calls depreciate faster than far month calls. To gain maximum from this, we need to select strike price with maximum time value.
It was assumed that one call of near month (current month) expiry at the money strike price was sold (shorted), and against this, one call of far month (next month) at the money expiry was bought.
Each F&O series in NSE (National Stock Exchange) lasts for 4-5 months. This series expires on last Thursday of each month, and next series starts on the next working day. Traders can trade in current month and next two month series at any point of time. Expiry for current month series was chosen as the reference point for research. This was also chosen as the exit point for Calendar spread. Four different time points during current month series were chosen as entry points for the strategy. These points were first working day of three weeks before expiry, first working day of two weeks before expiry, first working day of a week before expiry, and first working day of expiry week. At the beginning of a series, more time value is attached to the calls, and as the expiry approaches, this time
VOLUME NO.2(2012),ISSUE NO.5(MAY) ISSN2231-5756
value depreciates. The implication for research is that different entry points may give different results. Entry near to expiry may mean expiry happening in the desired profitable range. However, this may also mean lesser time value for both current month and next month calls, and hence lesser profitability. On the contrary, entry during early part of the series will get better time value. However, as the expiry will be farther, its probability of happening in the desired profitability range will be lesser. Early entry will give more profits than later entry if the expiry happens in the desired profitability range. These four entry points were named as Entry Point 1, Entry Point 2, Entry Point 3, and Entry point 4 respectively, with Entry Point 1 being the earliest entry, and Entry Point 4 being the later entry. Opening price for the selected strike price calls was noted from the NSE website as Entry Price. Similarly, Settlement price on Current month Expiry (for both current month and next month calls) was noted from the NSE website as squaring off price.
Nifty can be traded in Strike prices with a difference of 100 (as per regulation). There was a brief period of a few months in 2008-2009 when Nifty fell below 3000, and Strike prices with a difference of 50 were available. However, volumes in the middle strike prices ending in 50’s were meagre. Moreover, to maintain uniformity for the whole time period of research, only Strike prices ending in 100’s were considered. At the Money Strike Price was chosen as follows:
a) If Nifty opened exactly on the entry day at 100s, the exact Strike price was chosen to enter Calendar Spread. For instance, If Nifty opened at 5100, the same Strike Price (5100) was chosen as At the Money Strike Price.
b) If Nifty for instance opened above 5100 and below 5150, 5100 was chosen as At the Money Strike Price c) If Nifty for instance opened above 5150, between 5150 and 5200, 5200 was chosen as At the Money Strike Price. Uniform procedure was followed at each entry point every month to maintain uniformity of Research.
Time Period chosen for research was between January 2008 and June 2011. A total of 42 monthly F&O series were covered for research during this time period. Nifty was at its peak in January 2008. It started falling in the following months, and reached almost its 1/3rd level in October 2008. It remained in an extremely bearish phase till March 2009. Then there was an extremely bullish phase from April 2009 to December 2010. Nifty regained its peak in this period. This was followed by a range-bound phase from January 2011 to June 2011. The findings were subdivided in to three different phases as follows:
a) Bearish Phase- January 2008 to March 2009 b) Bullish Phase- April 2009 to December 2010 c) Range Bound- January 2011 to June 2011
This would enable the Stock Brokers to explain behaviour of Calendar Spreads during different phases to the retail traders.
Calendar Spread strategy in question requires simultaneous buying and selling of Calls of different expiries, but with the same Strike Price. On an average, the prescribed margin for selling one Call of Nifty is 10%. However, since this particular strategy involves simultaneous buying of a Call with the same strike price, Brokers keep a margin on an average of around 7%. If for instance Nifty was at 5000, margin required for entry in this strategy was 7% of (5000 x 50), where 50 is the lot size of Nifty. Margin required in our example thus comes out to be Rs 17500. Opening level of Nifty at different entry points was chosen for calculating margin requirements. Average margin required during overall and different sub-periods was chosen as reference investment for calculating profitability. Annualized return was calculated as follows:
1) Entry Point 1 was first working day of three weeks before expiry week. Since margin was required for only 25 calendar days every month, annualized return was adjusted accordingly.
2) Entry Point 2 was first working day of two weeks before expiry week. Since margin was required for only 18 calendar days every month, annualized return was adjusted accordingly.
3) Entry Point 3 was first working day of one week before expiry week. Since margin was required for only 11 calendar days every month, annualized return was adjusted accordingly.
4) Entry Point 4 was first working day of expiry week. Since margin was required for only 4 calendar days every month, annualized return was adjusted accordingly.
INTERNATIONAL JOURNAL OF RESEARCH IN COMMERCE, IT & MANAGEMENT
TABULATION OF RESULTS
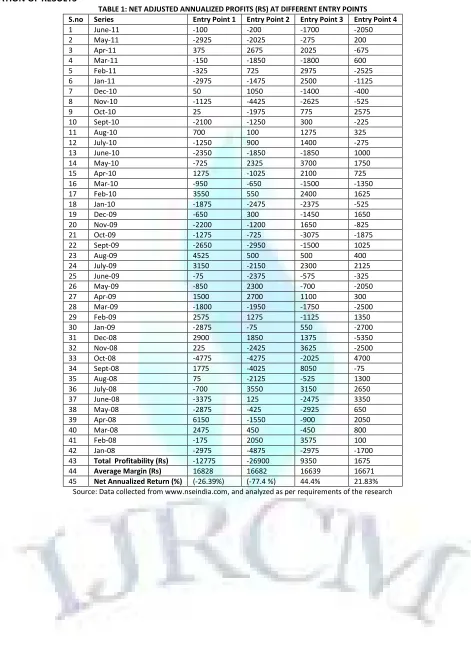
TABLE 1: NET ADJUSTED ANNUALIZED PROFITS (RS) AT DIFFERENT ENTRY POINTS S.no Series Entry Point 1 Entry Point 2 Entry Point 3 Entry Point 4
1 June-11 -100 -200 -1700 -2050
2 May-11 -2925 -2025 -275 200
3 Apr-11 375 2675 2025 -675
4 Mar-11 -150 -1850 -1800 600
5 Feb-11 -325 725 2975 -2525
6 Jan-11 -2975 -1475 2500 -1125
7 Dec-10 50 1050 -1400 -400
8 Nov-10 -1125 -4425 -2625 -525
9 Oct-10 25 -1975 775 2575
10 Sept-10 -2100 -1250 300 -225
11 Aug-10 700 100 1275 325
12 July-10 -1250 900 1400 -275
13 June-10 -2350 -1850 -1850 1000
14 May-10 -725 2325 3700 1750
15 Apr-10 1275 -1025 2100 725
16 Mar-10 -950 -650 -1500 -1350
17 Feb-10 3550 550 2400 1625
18 Jan-10 -1875 -2475 -2375 -525
19 Dec-09 -650 300 -1450 1650
20 Nov-09 -2200 -1200 1650 -825
21 Oct-09 -1275 -725 -3075 -1875
22 Sept-09 -2650 -2950 -1500 1025
23 Aug-09 4525 500 500 400
24 July-09 3150 -2150 2300 2125
25 June-09 -75 -2375 -575 -325
26 May-09 -850 2300 -700 -2050
27 Apr-09 1500 2700 1100 300
28 Mar-09 -1800 -1950 -1750 -2500
29 Feb-09 2575 1275 -1125 1350
30 Jan-09 -2875 -75 550 -2700
31 Dec-08 2900 1850 1375 -5350
32 Nov-08 225 -2425 3625 -2500
33 Oct-08 -4775 -4275 -2025 4700
34 Sept-08 1775 -4025 8050 -75
35 Aug-08 75 -2125 -525 1300
36 July-08 -700 3550 3150 2650
37 June-08 -3375 125 -2475 3350
38 May-08 -2875 -425 -2925 650
39 Apr-08 6150 -1550 -900 2050
40 Mar-08 2475 450 -450 800
41 Feb-08 -175 2050 3575 100
42 Jan-08 -2975 -4875 -2975 -1700
43 Total Profitability (Rs) -12775 -26900 9350 1675 44 Average Margin (Rs) 16828 16682 16639 16671 45 Net Annualized Return (%) (-26.39%) (-77.4 %) 44.4% 21.83%
VOLUME NO.2(2012),ISSUE NO.5(MAY) ISSN2231-5756
TABLE 2: AVERAGE MARGIN IN RS (*CALCULATED ON THE BASIS OF 7% MARGIN ON OPENING LEVEL OF NIFTY FUTURES AT RESPECTIVE ENTRY POINTS) S.no Series Entry Point 1 Entry Point 2 Entry Point 3 Entry Point 4
1 June-11 19271 19530 18809 19054
2 May-11 20195 19142 19369 19037
3 Apr-11 20559 20430 20412 20615
4 Mar-11 19250 19096 18935 19845
5 Feb-11 19163 18900 18711 19079
6 Jan-11 21707 20738 19740 19968
7 Dec-10 21123 20948 20650 21140
8 Nov-10 21368 22190 21312 20755
9 Oct-10 21749 21637 21263 21420
10 Sept-10 19285 19863 20808 21245
11 Aug-10 18925 19068 19086 19355
12 July-10 18340 18792 18816 19110
13 June-10 17623 17539 17983 18638
14 May-10 18323 17780 17563 17465
15 Apr-10 18655 18774 18200 18715
16 Mar-10 17430 17969 17927 18200
17 Feb-10 16968 16534 16933 17168
18 Jan-10 18288 18463 18335 17486
19 Dec-09 17973 17868 17465 18169
20 Nov-09 16289 16870 17644 17752
21 Oct-09 17500 17297 18071 17497
22 Sept-09 16359 16520 16839 17143
23 Aug-09 16303 15894 15750 15960
24 July-09 15495 15495 15547 16104
25 June-09 15789 16065 15897 15078
26 May-09 12674 12775 15015 14840
27 Apr-09 11484 11848 11900 11995
28 Mar-09 9335 9006 9496 9961
29 Feb-09 9923 9940 10210 9419
30 Jan-09 10805 10010 9853 10171
31 Dec-08 9786 9870 10395 10728
32 Nov-08 10563 10675 9916 9415
33 Oct-08 13090 11480 10924 8841
34 Sept-08 15089 15901 14322 15071
35 Aug-08 15407 16135 15463 15351
36 July-08 13972 14035 14469 15071
37 June-08 17073 15680 15943 15138
38 May-08 18375 17448 17913 17210
39 Apr-08 17157 16394 16429 17913
40 Mar-08 17542 16729 16037 16146
41 Feb-08 18967 17591 18571 17955
42 Jan-08 21595 21718 19919 18942
43 Average Margin 16828 16682 16639 16671
Source: Data collected from www.nseindia.com, and analyzed as per requirements of the research
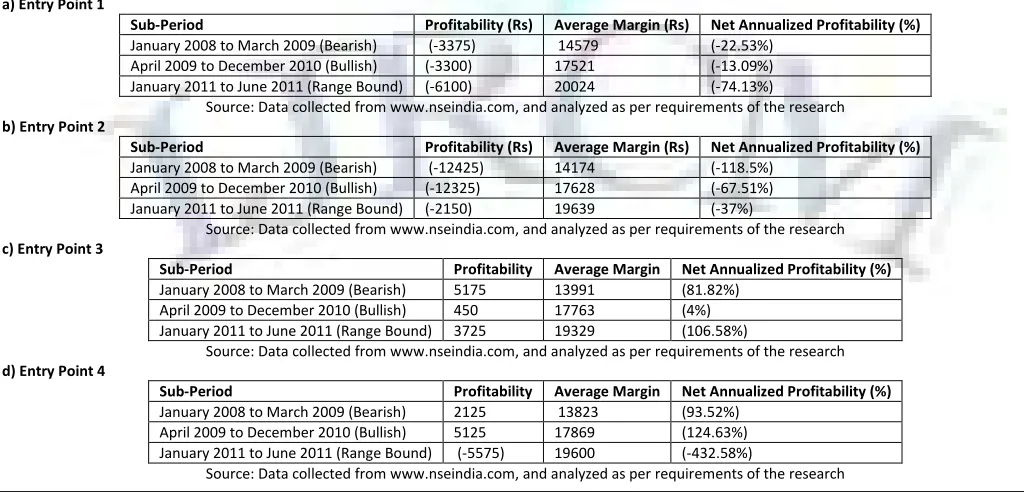
TABLE 3: Profitability calculated for three different sub-periods (Adjusted to Net Annualized Profitability as discussed under Research Design) a) Entry Point 1
Sub-Period Profitability (Rs) Average Margin (Rs) Net Annualized Profitability (%)
January 2008 to March 2009 (Bearish) (-3375) 14579 (-22.53%)
April 2009 to December 2010 (Bullish) (-3300) 17521 (-13.09%)
January 2011 to June 2011 (Range Bound) (-6100) 20024 (-74.13%)
Source: Data collected from www.nseindia.com, and analyzed as per requirements of the research b) Entry Point 2
Sub-Period Profitability (Rs) Average Margin (Rs) Net Annualized Profitability (%)
January 2008 to March 2009 (Bearish) (-12425) 14174 (-118.5%)
April 2009 to December 2010 (Bullish) (-12325) 17628 (-67.51%)
January 2011 to June 2011 (Range Bound) (-2150) 19639 (-37%)
Source: Data collected from www.nseindia.com, and analyzed as per requirements of the research c) Entry Point 3
Sub-Period Profitability Average Margin Net Annualized Profitability (%)
January 2008 to March 2009 (Bearish) 5175 13991 (81.82%)
April 2009 to December 2010 (Bullish) 450 17763 (4%)
January 2011 to June 2011 (Range Bound) 3725 19329 (106.58%)
Source: Data collected from www.nseindia.com, and analyzed as per requirements of the research d) Entry Point 4
Sub-Period Profitability Average Margin Net Annualized Profitability (%)
January 2008 to March 2009 (Bearish) 2125 13823 (93.52%)
April 2009 to December 2010 (Bullish) 5125 17869 (124.63%)
January 2011 to June 2011 (Range Bound) (-5575) 19600 (-432.58%)
INTERNATIONAL JOURNAL OF RESEARCH IN COMMERCE, IT & MANAGEMENT
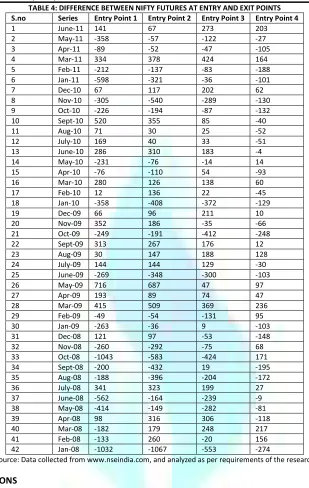
TABLE 4: DIFFERENCE BETWEEN NIFTY FUTURES AT ENTRY AND EXIT POINTS S.no Series Entry Point 1 Entry Point 2 Entry Point 3 Entry Point 4
1 June-11 141 67 273 203
2 May-11 -358 -57 -122 -27
3 Apr-11 -89 -52 -47 -105
4 Mar-11 334 378 424 164
5 Feb-11 -212 -137 -83 -188
6 Jan-11 -598 -321 -36 -101
7 Dec-10 67 117 202 62
8 Nov-10 -305 -540 -289 -130
9 Oct-10 -226 -194 -87 -132
10 Sept-10 520 355 85 -40
11 Aug-10 71 30 25 -52
12 July-10 169 40 33 -51
13 June-10 286 310 183 -4
14 May-10 -231 -76 -14 14
15 Apr-10 -76 -110 54 -93
16 Mar-10 280 126 138 60
17 Feb-10 12 136 22 -45
18 Jan-10 -358 -408 -372 -129
19 Dec-09 66 96 211 10
20 Nov-09 352 186 -35 -66
21 Oct-09 -249 -191 -412 -248
22 Sept-09 313 267 176 12
23 Aug-09 30 147 188 128
24 July-09 144 144 129 -30
25 June-09 -269 -348 -300 -103
26 May-09 716 687 47 97
27 Apr-09 193 89 74 47
28 Mar-09 415 509 369 236
29 Feb-09 -49 -54 -131 95
30 Jan-09 -263 -36 9 -103
31 Dec-08 121 97 -53 -148
32 Nov-08 -260 -292 -75 68
33 Oct-08 -1043 -583 -424 171
34 Sept-08 -200 -432 19 -195
35 Aug-08 -188 -396 -204 -172
36 July-08 341 323 199 27
37 June-08 -562 -164 -239 -9
38 May-08 -414 -149 -282 -81
39 Apr-08 98 316 306 -118
40 Mar-08 -182 179 248 217
41 Feb-08 -133 260 -20 156
42 Jan-08 -1032 -1067 -553 -274
Source: Data collected from www.nseindia.com, and analyzed as per requirements of the research
FINDINGS AND CONCLUSIONS
• Overall, Maximum Net Annualized gains were realized from Calendar Call spreads at Entry Point 3, i.e. entry at opening time of first working day of the week before Expiry. These annual gains amounted to 44% (From Table 1). Comparing this with 10-11% annual gains from other safe traditional instruments like Fixed Deposits, Calendar Spread at Entry point 3 can be marketed as a Star Product by the Stock Brokers.
• There was an overall net annualized loss of 26.39 % and 77.4% respectively at Entry Points 1 and 2 (Table 1). Also, there was a loss in all the three sub-periods in both Entry points 1 and 2 (Table 3a and 3b). Thus, creation of Calendar spread with At the Money Calls in Nifty should be avoided at Entry Points 1 and 2. Retail traders should be strictly cautioned by the Stock Brokers against this.
• At Entry Point 1, there was a net loss in 26 out of 42 F&O series. Talking about the sub-periods, maximum loss was visible at this Entry Point in the Range bound period (From January 2011 to June 2011). There was a loss in 5 out of 6 F&O series during this period. This can be explained by the fact that 5 expiries out of 6 took place more than 100 points from the entry level (Table 4). As Calendar spread gives profit in a range of around 100 points (positive or negative) from the entry point, expiries happening outside this range was the reason for the losses. This reinforces the hypothesis that earlier entry in a monthly F&O series in Calendar Spread reduces the Probability of Expiry happening in the Profitable Zone.
• At Entry Point 2, there was a net loss in 25 out of 42 F&O series. Maximum loss was witnessed in both Bearish and Bullish phases. 21 of the 36 expiries during this period accounted for a net loss. Out of these negative series, biggest loss making months were January 2008, September 2008, October 2008, and November 2010. If we analyze expiries of all these four months, January 2008 expiry was 1067 points negative from the entry point, September 2008 was 432 points negative from the entry point, October 2008 was 583 points negative from the entry point, and November 2010 expiry was 540 points negative from the entry point. If we analyze the loss making months in which expiries happened on the positive side from the entry point, the corresponding losses are not huge. For instance, March 2009 was 509 points positive from the entry point, but the loss was only Rs 1950. If we extend this analysis to Entry Point 1, biggest loss making series were October 2008, June 2008, January 2008 and January 2011 (In descending order of extent of loss). Expiries in these months were (-1043 Points), (-562 points), (-1032 Points), and (-598 points) respectively. Loss making months on the positive side again didn’t produce huge losses. Thus, we can conclude that at Entry Points 1 and 2, there is more risk on the negative side in this strategy than the positive side. Another important point to note is that irrespective of the extreme conditions in the markets, maximum potential loss is restricted (Both Upside and Downside, Refer Tables 1 &4)
VOLUME NO.2(2012),ISSUE NO.5(MAY)
expiry), current month At the money premiums are already depleted to a large extent. In fact, in the last four days of curren premiums deplete more in absolute terms than the current month premiums. This explains the reason for the huge losses in a ra Volatile sub-periods, Entry Point 4 performs better than Entry Point 3. This can be explained from the fac
times. By default, current month premiums have to reach their Intrinsic Values on Expiry, but Next month premiums keep enjoyi Entry Point 4 is the nearest to expiry, and hence enjoy
Entry at Point 4 may be recommended to the clients if there can be a clear distinction between the various phases of the Mark often not so. Hence, Systematic Trading Plan should recommend entry only at Point 3 (Considering the huge potential losses in Point 4).
• Entry Point 3 gave profitability in all the sub-periods. It can be argued that returns
the other sub-periods compensates for this meagre profitability. In reality, it is extremely difficult to distinguish between different pha This is more so in case of an average retail trader. Since Entry Point 3 is safe in all the Sub
all times. Brokers can simply recommend the retail traders to enter the Calendar spread on the first day of a week before Expiry to make net annualized returns of 44.4%. Constructing this strategy is also extremely simple. Traders just need to sel Expiry Call, and buy one At the Money Next Month Expiry Call. Thus, by enter
prescribed manner extremely easy to understand, handsome gains can be made. No thorough knowledge of the Stock Market is requ
from this strategy. Even Part time traders can benefit from this. They need not be glued to their computer/ Television screens all the time (which is usually the case with traders). Thus, Brokers can exploit a much wider market, including people willing to invest in Stock Market, bu
the markets on a regular basis.
• Stock Brokers can simply prepare an Illustration as shown in Table 1, and can distribute the same to their clients/ prospecti
can also present/ distribute this illustration during the seminars organised by them. An important point to note is that gains can’t be made from this strategy in every F&O series. There will be some negative months and some positive months. Brokers should explain to their cl
importance of Systematic Investment in this plan. The fact that this strategy restricts the maximum potential loss irrespecti Markets (Both upside and downside) should also be explained to the traders. This will give the
investment.
• There was a gain of only 4% during the Bullish Phase at Entry Point 3. Leading Brokers give a limit of up to 85% for trading
Cash Portfolio with them. During the Bullish Phase, Cash portfolio will be highly profitable, and hence will take care of the Profitability targets. However Cash investors cut a sorry figure in Bearish and Range Bound phases. Brokers can recommend this strategy to their Cash Invest
Bearish and Range Bound Phases. Because of the in
situation for both Cash Investors and Stock Brokers. Cash investors will get a he additional Brokerage revenues from Options segment.
REFERENCES
1. Arvedlund, Erin E (2001), The Striking Price: Friendly Calendar, Barron’s, May 7, 2001; 81,19; pp
2. Black, F. and M. Scholes (1973). The pricing of options and corporate liabilities. Journal of Political Economy pp. 81, 399 3. Carr, P., K. Ellis, and V. Gupta (1998). Static hedging of exotic options. The Journal of Finance 53 (3), pp. 1165
4. Chandra Parsanna, (2006) “Investment Analysis and Portfolio Management”, 5
5. Fischer Donald and Jordan Ronald (2005), “Security Analysis and Portfolio Management”, 6 6. Frederick, Randy. Timing your Butterfly Trades,Futures
7. Hull, John C (2006), Options Futures and Other Derivatives, pp 8. Mendoza, Alex, Options Strategy, Futures Magazine, February 2010, pp 9. Preston, Tom , Equities Magazine, January 2008, pp
10. Ranganatham M. and Madhumati R (2008), “ Inv Delhi.
11. Sharpe William , Alaxender Gordon , and Bailey Jeffery (2006), “Investments”, 6 12. Srivastava, Rajiv (2010), Derivatives and Risk Management, pp
13. Stone, Daniel (1993), Knock Out Options, When and How to use them, Corporate Finance; June 1993; 103; pp 14. Tyllas, Howard (2008), Option Strategy, Futures; Janua
15. Zhu, Guo Dong (May 2007), Pricing Options on Trading Strategies, Ph.D. Thesis, Department of Mathematics, New York University WEBSITES 16. www.angelbroking.com 17. www.cboe.com 18. www.cbot.com 19. www.ffsil.com 20. www.nseindia.com 21. www.reliancemoney.com 22. www.sharekhan.com
expiry), current month At the money premiums are already depleted to a large extent. In fact, in the last four days of curren premiums deplete more in absolute terms than the current month premiums. This explains the reason for the huge losses in a ra
periods, Entry Point 4 performs better than Entry Point 3. This can be explained from the fact that Option premiums are more during volatile times. By default, current month premiums have to reach their Intrinsic Values on Expiry, but Next month premiums keep enjoyi
Entry Point 4 is the nearest to expiry, and hence enjoys the added advantage of having the highest probability of expiry occurring in the Profitability range. Entry at Point 4 may be recommended to the clients if there can be a clear distinction between the various phases of the Mark
often not so. Hence, Systematic Trading Plan should recommend entry only at Point 3 (Considering the huge potential losses in
periods. It can be argued that returns were only 4% in the bullish phase of the Market. However, huge gains in periods compensates for this meagre profitability. In reality, it is extremely difficult to distinguish between different pha
f an average retail trader. Since Entry Point 3 is safe in all the Sub-periods, entry can be recommended to the retail traders during all times. Brokers can simply recommend the retail traders to enter the Calendar spread on the first day of a week before
Expiry to make net annualized returns of 44.4%. Constructing this strategy is also extremely simple. Traders just need to sel
Expiry Call, and buy one At the Money Next Month Expiry Call. Thus, by entering and exiting this strategy at a specified time every month, and in a prescribed manner extremely easy to understand, handsome gains can be made. No thorough knowledge of the Stock Market is requ
rs can benefit from this. They need not be glued to their computer/ Television screens all the time (which is usually the case with traders). Thus, Brokers can exploit a much wider market, including people willing to invest in Stock Market, bu
Stock Brokers can simply prepare an Illustration as shown in Table 1, and can distribute the same to their clients/ prospecti
during the seminars organised by them. An important point to note is that gains can’t be made from this strategy in every F&O series. There will be some negative months and some positive months. Brokers should explain to their cl
importance of Systematic Investment in this plan. The fact that this strategy restricts the maximum potential loss irrespecti
Markets (Both upside and downside) should also be explained to the traders. This will give them confidence to invest in this low risk instrument of
There was a gain of only 4% during the Bullish Phase at Entry Point 3. Leading Brokers give a limit of up to 85% for trading
g the Bullish Phase, Cash portfolio will be highly profitable, and hence will take care of the Profitability targets. However Cash investors cut a sorry figure in Bearish and Range Bound phases. Brokers can recommend this strategy to their Cash Invest
Bearish and Range Bound Phases. Because of the in-built limit, investors need not put any additional investment for trading options. This will be a win situation for both Cash Investors and Stock Brokers. Cash investors will get a hedging instrument at no additional investment, and Stock Brokers will get additional Brokerage revenues from Options segment.
Arvedlund, Erin E (2001), The Striking Price: Friendly Calendar, Barron’s, May 7, 2001; 81,19; pp-MW 15.
M. Scholes (1973). The pricing of options and corporate liabilities. Journal of Political Economy pp. 81, 399 Carr, P., K. Ellis, and V. Gupta (1998). Static hedging of exotic options. The Journal of Finance 53 (3), pp. 1165–1190.
006) “Investment Analysis and Portfolio Management”, 5th Reprint, pp. 497-510, Tata McGraw-Fischer Donald and Jordan Ronald (2005), “Security Analysis and Portfolio Management”, 6th Edition, pp. 404-427, Prentice
Futures 34, 13 (Oct 2005),pp. 36-38 John C (2006), Options Futures and Other Derivatives, pp-338. Pearson Education. Mendoza, Alex, Options Strategy, Futures Magazine, February 2010, pp-18.
Preston, Tom , Equities Magazine, January 2008, pp-14
Ranganatham M. and Madhumati R (2008), “ Investment Analysis and Portfolio Management, 3rd Edition, pp. 412, Dorling Kindersley (India) Pvt. Ltd, New
Sharpe William , Alaxender Gordon , and Bailey Jeffery (2006), “Investments”, 6th Edition, pp. 601, Prentice-Hall of India, New Delhi Srivastava, Rajiv (2010), Derivatives and Risk Management, pp-458, Oxford University Press,
Stone, Daniel (1993), Knock Out Options, When and How to use them, Corporate Finance; June 1993; 103; pp-11. Tyllas, Howard (2008), Option Strategy, Futures; January, 2008; 37,1; pp-20
Zhu, Guo Dong (May 2007), Pricing Options on Trading Strategies, Ph.D. Thesis, Department of Mathematics, New York University
ISSN2231-5756
expiry), current month At the money premiums are already depleted to a large extent. In fact, in the last four days of current month expiry, next month premiums deplete more in absolute terms than the current month premiums. This explains the reason for the huge losses in a range bound phase. During t that Option premiums are more during volatile times. By default, current month premiums have to reach their Intrinsic Values on Expiry, but Next month premiums keep enjoying higher valuations. Also, s the added advantage of having the highest probability of expiry occurring in the Profitability range. Entry at Point 4 may be recommended to the clients if there can be a clear distinction between the various phases of the Market. However, in reality, this is often not so. Hence, Systematic Trading Plan should recommend entry only at Point 3 (Considering the huge potential losses in range bound phase at Entry
were only 4% in the bullish phase of the Market. However, huge gains in periods compensates for this meagre profitability. In reality, it is extremely difficult to distinguish between different phases of the Market. periods, entry can be recommended to the retail traders during all times. Brokers can simply recommend the retail traders to enter the Calendar spread on the first day of a week before monthly expiry, and exit on Expiry to make net annualized returns of 44.4%. Constructing this strategy is also extremely simple. Traders just need to sell one At the Money Current ing and exiting this strategy at a specified time every month, and in a prescribed manner extremely easy to understand, handsome gains can be made. No thorough knowledge of the Stock Market is required to make gains rs can benefit from this. They need not be glued to their computer/ Television screens all the time (which is usually the case with traders). Thus, Brokers can exploit a much wider market, including people willing to invest in Stock Market, but who don’t have time to track
Stock Brokers can simply prepare an Illustration as shown in Table 1, and can distribute the same to their clients/ prospective clients through mailers. They during the seminars organised by them. An important point to note is that gains can’t be made from this strategy in every F&O series. There will be some negative months and some positive months. Brokers should explain to their clients/ prospective clients the importance of Systematic Investment in this plan. The fact that this strategy restricts the maximum potential loss irrespective of extreme conditions in the m confidence to invest in this low risk instrument of
There was a gain of only 4% during the Bullish Phase at Entry Point 3. Leading Brokers give a limit of up to 85% for trading in Options to Investors having a g the Bullish Phase, Cash portfolio will be highly profitable, and hence will take care of the Profitability targets. However, Cash investors cut a sorry figure in Bearish and Range Bound phases. Brokers can recommend this strategy to their Cash Investors as a hedge against built limit, investors need not put any additional investment for trading options. This will be a win-win dging instrument at no additional investment, and Stock Brokers will get
M. Scholes (1973). The pricing of options and corporate liabilities. Journal of Political Economy pp. 81, 399–417.
-Hill, New Delhi.
427, Prentice-Hall of India, New Delhi.
Edition, pp. 412, Dorling Kindersley (India) Pvt. Ltd, New
Hall of India, New Delhi
INTERNATIONAL JOURNAL OF RESEARCH IN COMMERCE, IT & MANAGEMENT
REQUEST FOR FEEDBACK
Dear Readers
At the very outset, International Journal of Research in Commerce, IT and Management (IJRCM)
acknowledges & appreciates your efforts in showing interest in our present issue under your kind perusal.
I would like to request you to supply your critical comments and suggestions about the material published
in this issue as well as on the journal as a whole, on our E-mails i.e.
or
for further improvements in the interest of research.
If you have any queries please feel free to contact us on our E-mail
.
I am sure that your feedback and deliberations would make future issues better – a result of our joint
effort.
Looking forward an appropriate consideration.
With sincere regards
Thanking you profoundly
Academically yours
Sd/-