RESEARCH NOTE
A COMPARSION STUDY BETWEEN THE JOINT
PROBABILITYAPPROACH AND TIME SERIES
RAINFALLMODELLING IN COASTAL
DETENTION POND ANALYSIS
M. Gorji-Bandpy
Department of Mechanical Engineering, University of Mazandaran, Babol, Iran
(Received: February 5, 1997 - Accepted in Revised Form: May 3, 1999)
In tidally affected coastal catchments detention pond shou ld be provided to store Abstract
flood su rface water. A comparison between the full simu lation approach based on the joint probability method and time series rainfall modeling via the annual maximum of pond level was undertaken to investigate the assumptions of independence between variables that are necessary in the joint probability method. The rainfall data was run through a catchment model and the inflow hydrograph was obtained. This inflow was run through a detention pond with an outfall significantly affected by tidal action. The tidal variations were determined at that exact historical time of the time series rainfall. A continu ous record of time series pond level was therefore determined and the peak pond level for each year was used to generate the annual maximum series of pond levels. A comparison between the growth curves of full simulation approach, and the time series rainfall mode ling was u ndert aken . The resu lts in dicat e tha t the re are no significant differences between the two growth curves generated.
Joint Probability, Time Series Rainfall, Detention Pond, Annual Maximum Level, Key Words
Tidal Level, Growth Curve
k« ° nm] o¼YFU SdU B½nj JC ³ »¦eBw ºBµo´{ nj JÀ¼w é A±« nj »d w ºB´MC ºn°Céª] ºAoM
²k¼ña
©\e ° »£k¯nBM nj JC ¬A°n ¬Aq¼« ¬jn°C SwkM ºAoM x°n °j /j±{»« ²jB TwA »î±®~« ºBµ³aB½nj pA ,jnAj nAo ¬k{ ¬B«qªµ ¤BªTeA ³½BQ oM ³ ¥«B ºpBw³¼L{ x°n ;jnAj j±]° }hz« »¯B«p ²n°j ð½ nj Bµ³aB½nj ³¯±¢®½A »¯B«p oUA±T« ºB´½ow nj »£k¯nBM ¬Aq¼« tBwAoM ³ ©¼ Tv« x°n ° jnAj nAo B½nj k« ° »£k¯nBM ¦Th« ºBµoT«AnBQ ºBµoTÇ«AnBÇQ ¬j±M ¥ Tv« oM »®TL« ³ ¤°A x°n nBLTîA BU SwA ³T o£ Rn±æ x°n °j ½A ¼M ºA³v½B « /SwA Rk{ ° »MC ²p±e ð½ RB~hz« T{Aj Swj nj BM /jjo£ ¼ dU ° »wnoM ,SwA B½nj S¼í ° ° »£k¯nBM ¦Th« ³ »î±®~« ³aB½nj ¥iAj nj ¬A°n JC ½A ³ k½C»« SwkM ³¦æBe ¬A°n JC nAk « ,²p±e ¬C nj »£k¯nBM Rk« ° ºA³§±§ w±U ,³¼¦hU ºAoM ,³aB½nj JC /j±{»« jnA° ,²k{ »eAo JÀ¼w é A±« nj »d w ºB´MC ºn°Céª] ºAoM »¯BÇ«p ºB´½oÇw nj »£k¯nBM ¬Aq¼« ¬j±ª¯ ¤k« BM /jnAj nAo k« ° nm] o¼YFU SdU q¼¯ B½nj ° ²k½jo£ ¥~T« B½nj ³M nj ° ²k«C SwkM ¦Th« ºB´¯B«p nj ³aB½nj JC c w B UnA S¼í ° ,B½nj JC ¬k«C ¼ÄBQ ° ¿BM ¬Aq¼« q¼¯ ° oUA±T« BM ,¬B«p ³M SLv¯ ³aB½nj JC c w B UnA »®d®« /j±{»« ºo¼£@²pAk¯A ¤Bw oµ nj ³aB½nj JC ©ª½q @B« B UnAS½B´¯ »®d®Ç« °j ǽA ¼M ³ kµj»« ¬Bz¯ [½BT¯ /SwA ²k{ ³v½B « o¢½kñ½ BM ° ²k«C SwkM ,x°n °j oµ pA ²jB TwA pA »¦eBw ºBµo´{ nj »d w ºB´MC ºn°Céª] ºAoM ³aB½nj »eAo nj ¬A±U»« ° ³T{Ak¯ j±]° »wBwA ÀTiA /j±ª¯ ²jB TwA ,SwA »£k¯nBM »¯B«p ºB´½ow x°n pA ºoT¯ApnA ° oU²jBw x°n ³ BµoT«AnBQ ºpBw¤k« x°n
INTRODUCTION
In gene ral drainage aut horities for industrial a n d r e side n t ia l p r o je ct s h a ve a do p t e d a specified return period coupled with a particular
wh ich affe ct s t h e le ve ls in t h e d isch arging waters. A conventional approach to the design o f su ch syst e m is o n t h e p r o b a b ilit y o f occurrence of rainfall and tide.
In the coast al de tention pond analysis t he p r o ble m wa s d e r ive d a s a r e su lt o f t h e development of a full simulation method based on the probability of occurrence of individual e ve n t va r ia ble s, sa mp le d fr o m t h e ir o wn probability of occurrence, in order to arrive at the probability distribution of pond flood level [3]. The adoption of t his philosophy se e ms acce pt able fo r t h e de sign of su ch p ondsby assumption of independence between rainfall and tide.
This study was unde rt ake n by running t he time series rainfall through a de tent ion pond with an outfall significant ly affecte d by t idal action. The tidal times series was generated by u sin g su fficie n t h a r mo n ics t o de t e r m in e reasonable results. The two main constituents, the lunar and solar semidiurnal, (M 2 and S2) pro duce re alist ic tida l le ve ls, and t he y are ade qua te for t he de te ntio n pond mode l. A co nt in uo us 30 ye ar s of p ou nd le ve ls we re the refore det ermined and it was nece ssary to se lect t he highest pond le vel for e ach ye ar in order to generat e the annual maximum series from the pond level time series.
Since t h e t ide h a s a r a ndo m n a t ur e in relation to the rainfall effect, which could be the dominant effect, it is ne cessary to stagger t h e st ar t s of t he t ime se rie s r ainfall in an attempt to identify any error associated with the sh ort t e rm t ida l t iming e ffe ct s an d also t o inve stigate the significance of the lag effect. The staggered time series rainfall growth curves produced from annual maximum series when compared with the e xact timing growth curve provide d a me asure of lag' s significance and t he r e fore a me a sure of variat ions t h at can reasonably be anticipated.
THE RAINFALL DATA
Access to rainfall data in the form of continuous t ime se r ie s o f r a in fa ll int e n sit y va lue s is necessary in order to select the best rainfall data for each pract ical applicat ion [4]. The be st design is obtained when data from all historic ra in fall e ve n t s is use d, co mbine d wit h t he necessary runoff model. The greatest problem precluding the use of historical rainfall events is the availability of adequate good data and the manipulation of the large quantitie s of dat a necessary. The rainfall data used in this study consisted of point rainfall records, linked with 12 years data at St.Mawgan and 18 years data at Rhoose, combining to form 30 years of records. The two regions are both in the South West of Brit ain and the lengt h of individual rainfall re co rds are in ade qu at e . As a r e su lt it was ne ce ssary t o concat e na t e t h e re cords from st a t io n wit h in t h e se t wo h o m o ge n e o u s precipitation regions. Since the rainfall events within this region were known to be correlated, t h e assumpt ion which is implie d in t h e case whe n rainfall data from different stations for the same ye ar we re concate nated is that the rain fall e ve n t s re corde d at one st at ion are inde pende nt of t hose re corde d at t he ot he r stations.
METHODOLOGY
complete data days. For runoff simulation the rainfall data is transformed to rainfall intensities with a time step of six minutes to determine the 24 hours' hyetographs. These are converted to t h e fo r m o f in flo w h ydr o gr a p h s in t o t h e de tention pond by conside ring two phase s of flow, the overland phase and the pipe phase [5]. T h e da ily in flo w hydr o gr a ph , wa s ro u t e d through the pond and out over the simulat ed t idal t ime se rie s. The t idal t ime se rie s was ge nerate d using the year, the month, the day and the hour of the exact time that the rainfall occurred. That was generated using harmonic analysis wit h t h e t wo main const itue nt t idal e ffe ct s. The pond le vel was de t ermined at 6 minute intervals during the course of each day and the maximum peak pond level in each year stored.
The E xt re me Value ( E V) dist ribut ion is suitable for obtaining the relationship between p e a k p o n d le ve ls a n d t h e p r o ba b ilit y o f occurrence for the annual maximum series. This distribution is give n by t he following formula [6];
_
(1) H = H + k(t)
s
where k(t) is called the frequency factor and is a_ function of the return period, H is the average of all values of annual maximum pond levels, and
s
is t he st andard de viatio n o f the value s. Wit h t he me an and st andard de viat ion of a sa m p le o f a n n u a l m a ximu m p o n d le ve l, anestimate of the pond level for any required r e t u r n p e r io d ca n b e o bt a in e d u sin g t h e appropriate value of k(t).APPLICATION
A 15ha catchment with a general site slope of 1 in 1000 together with a detention pond system o f t rian gu lar se ct ion was se le ct e d wit h t wo outfall se wer le ve ls. The se we r outfall le ve ls were locat e d at M ean Se a Level ( M SL) and
Me an H igh Tide Level ( MH TL) for se parate analyses. Since the structure of the analysis was t he same for any pond shape and cat chment cha ract e r ist ics t he cho se n value s we r e not considered significant in the overall comparison. The pond was de signe d such t hat t he wat e r level was not allowed to reach the ground level at the specified 50 years design return period.
The peak pond level for each of the 30 years of rainfa ll data wa s obtaine d for th e po nd system with two separate outfall levels. These peak levels were grouped for statistical analysis and compared with the growth curves obtained using the joint probability approach.
RESULTS
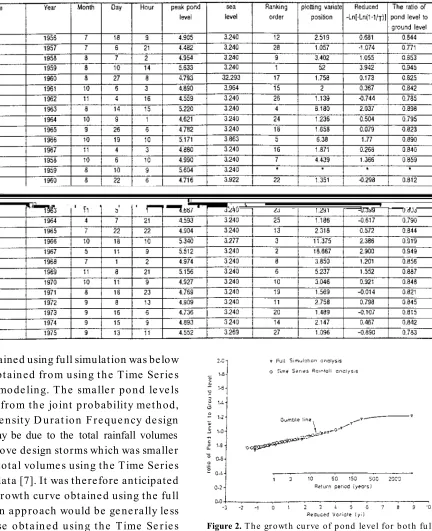
Table 1 shows the annual maximum pond level and its corre sponding date and time for the outfall sewer at Mean Sea Level (MSL).
The highest pond level, with a rank order of 1, is in 1959 in t he St . M awgan re gion. The second peak pond level is for the Rhoose area which also occurred in 1959 on the same day as t he first rank. The site s are in e xce ss of 100 mile s ap ar t an d t he r e gion alisa t ion o f t he rainfall records is based on the assumption that they are sufficiently far enough away from each other that they would not suffer from the same rainfall events. Since the result of the se cond rank peak level is on the same day as the first pe ak le vel, it is highly likely t hat both e vents we re cause d by the same rainfall patt ern and t h us t h e se t wo e vent s are no t inde p e n dent . Th e r e for e , t h e fir st e ve n t is u se d and t he se cond event is reject ed. As a result the first two in t he ranking order are assume d as one event and the second event was not used in the table and is indicated by the asterisk. The total length of t ime serie s rainfall data is therefore reduced to 29 years of records.
TABLE 1. The Different Peak Pond Levels and Plotting Positions for an Outfall at Mean Sea Level.
period is obtained as 5.70m. The 50 year pond level when compared to the result s of the full simulation analysis obtained by joint probability indicates that the value is smaller by only1.97%. Figure 1 shows the growth curve of the pond level for both the full simulat ion analysis and the annual maxima det ermined from t he time Series R ainfall in the case of the outfall sewer As t he figure shows the re is no significant difference between the growth curves for the joint probability method and t he Time Series R a in fa ll mo de lin g ap p r o a ch . T h e r e su lt s indicate that for return periods approaching the 50 ye a r s va lu e t h e sa me gr o wt h cu r ve is obtained, whereas for the smaller return periods a small diffe rence between the growth curves exist s. For smaller return pe riods the growth level at M SL. The straight line obtained from
Figure 1.Th e gr owt h cu rve of p ond level for b ot h fu ll sim u la t io n a n a lysis a n d t h e a n n u a l m a xim u m le ve l determined from the Time Series Rainfall analysis (outfall level at Mean sea level).
TABLE 2. The Different Peak Pond Levels and Plotting Positions for an Outfall at Mean High Tide Level.
curve obtained using full simulation was below t hat of obt ained from using t he Time Serie s R ainfall mode ling. The smalle r pond le ve ls obtained from the joint probability met hod, using Inte nsity D urat ion F re que ncy de sign storms, may be due to the total rainfall volumes for the above design storms which was smaller than the total volume s using the Time Series R ainfall data [7]. It was therefore anticipated that the growt h curve obt aine d using the full simulation approach would be ge ne rally le ss than th ose obt ain e d using the Time Se rie s Rainfall approach which would indicate that the two growth curves should be parallel.
Table 2 shows the highest pond le vels and their corresponding date and time for the pond wit h t h e o u t fa ll a t M e a n H igh t ide le ve l
Figure 2.Th e gr owt h cu rve of p ond level for b ot h fu ll simulation and the annual maximum level determined by Time Series R ainfall in the case of ou tfall level at Mean High Tide Level.
analysis and t he annual maxima de t ermine d from the Time Series Rainfall modeling.
The se results also indicate t hat there is no significant difference between the growth curves fo r t h e po nd le ve ls obtain e d from t he two distinct approache s. The ave rage maximum annual level of the pond obtained by the Time Series R ainfall approach is 4.887m. This value whe n compare d wit h t he ave rage pond le ve l based on the full simulation method give s an increase of 1.03%. The height of the pond level for the 50 years return periods 5.63m. This level wh e n co mp a r e d t o t h e re su lt s o f t h e fu ll simulation indicates a decrease of 3.0%.
THE RAINFALL-TIDECORRELATION
In this paper a study was undertaken in which the Time Series R ainfall coincided exactly with the act ual tidal e le vat ion at t hat time in that ye a r . So , a n y co r r e la t i o n o f ca u sa t ive p a r a me t e r s t h a t e xist in r e a lit y bu t we r e assumed inde pende nt in the joint probability approach are naturally include d in the Time Se r ie s R a in fa ll a n alysis. A s a r e su lt it is ne ce ssary t o st agge r t he st art s of t he Time Se rie s R ainfall. If the timing of the system is offse t by a quart er or half a cycle , all of the existing correlations will remain intact. This is because the correlations between variables are considered to be of a larger time scale. The new growth curve in comparison with the previous gr o wt h cu r ve p ro du ce s a me a su r e o f t h e importance of the lags and will allow a limited determination of the overall tidal significance. The similarity between the growth curves would indicate that t he tide and particularly the lag e ffe ct is not sign ificant , whe re as diffe re nt growt h curves would give a st rong indication that the tide is infact a dominant affect.
Four different tidal offsets at quarter, half,
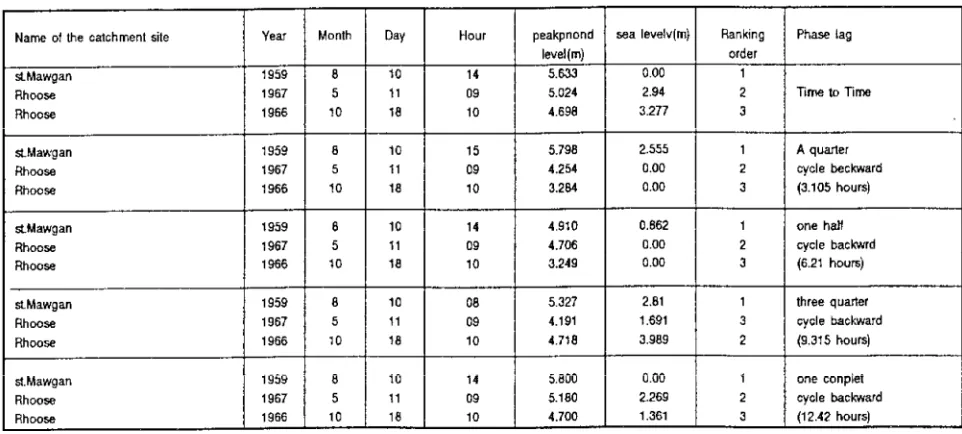
three-quarter and a full cycle in the case of an o u t fall se we r e le vat io n at M e an Se a L e ve l (MSL) were undertaken for the first three peak pond levels in the analysis. Table 3 shows the value of pond level sets for these three cases.
E ach o rdina t e of t h e pe a k po n d le ve ls represent the value for the corresponding cycle. As expected a comparison bet ween the 0 and 360 phase lags (one complete cycle) shows the rank of t he pe ak leve ls t o be t he same . The va r ia t io n in le ve ls is o nly a r e su lt o f t h e amplitude difference and because the two tides have similar heights similar levels are presented. The rank for the quarter and half cycle lags are the same. The ranks of the peak levels for the thre e-quarte r cycle phase lags are, howe ve r, diffe r e n t . T a ble 4 sh o ws t h e me an va lue , standard deviation and coefficient of variation of the pond levels for different phase lags for those three peak pond levels.
To clarify t he result s and to invest igate in de t a il wh e t he r t he t ide is sign ifica nt , it is necessary to consider the actual variation of the pond level and sea leve l wit h respect to time. The first pe ak pond le vel in t he case of the out fall sewer leve l at M ean Sea Level (M SL) was selected for this study. Figure 3 shows these variat ions from 36 hours be fore t o 36 hours after the peak pond level for the five different t idal st arting t ime s. As Figure 3-I shows the initial rise in pond level occurs whilst the tide is out. As the tide comes in, t he rain stops, and t he le ve l drop s a lmost t o se a le ve l, it t he n continue s t o rise t o a pe ak le ve l at 5.633m. After this peak the pond level drops rapidly due to continuing discharge in the tide free period and becomes almost empty at t he start of t he next tide locked period.
TABLE 3. Peak Pond Levels for Different Phase Lags for the Three Most Extreme Events (Outfall Level at Mean Sea Level).
TABLE 4. Mean, Standard Deviation and Coefficient of Variation of the Different Peak Pond Levels for the Three Extreme Events.
obtaine d. In this case the initial rain is almost emptied from the pond before the second main rainfall arrives; this rainfall exists entirely within t he t ide locke d pe riod and a highe r pe ak is obtained at 5.789m when compared to that of Figure 3-I.
A similar result on storage le vel profile is presented in Figure 3-III. This figure is for the case of a complete half cycle whe re the pe ak pond level is substantially lower. The storage l e v e l p r o f i l e i n t h e c a s e o f t h e three-quarter-cycle offset is presented in Figure 3-IV. As the figure shows, since the tide locked p e r iod o ccu r s, a sma ll p e ak p o nd le ve l is achieved. The peak pond level obtained in the final stage is 5.800 m and shows t he highest level. H ere the timings are exactly the same as
the ones shown in Figure 3-I excepting that the tide would be higher and thus would produce a higher pond level. The tides are clearly moving from springs to neaps during the event.
The differe nce in leve l achieve d through t he cycle and t he diffe re nce be t we e n comple t e cycles gives a measure of the tidal influence on this system. Clearly a significantly higher level would be achieved at a spring tide.
The value of pond level se t s for different t idal p h ase lags for t h e t h re e first e xt re me events areshown in the growth curve of Figure 1. As the figure indicates, there is no significant difference between the different growth curves.
CONCLUSION
simu la t io n a p p r o a ch ba se d o n t h e jo in t probability method and Time Se rie s R ainfall mo de lin g via a n n u a l ma ximu m le ve l wa s undertaken. Two different kinds of rainfall data have been used in the investigation :
I - R a infa ll da t a e st ima t e d fro m I nt e n sit y Duration Frequencyrelationship, together with distributions obtained from statistical sampling, and II- Time Series Rainfall data from 30 years of records.
The entire rainfall data was run through the ca tchme nt an d t he inflow hydr ogr ap h was generated. This inflow hydrograph was then run through the pond model to generate the effect of the actual tide series at that exact historical time . The pond le vel time serie s is there fore determined during the course of each day and the maximum peak pond level in each year was finally obt ained. The growt h curve obtaine d from the annual maximum levels was plotted. The result indicated that there are no significant differences be tween t he growth curve for full simu lat io n base d o n t h e jo int pr o babilit y approach, and the growth curve obtained from the Time Series Rainfall modeling analysis. For smaller return period the growth curve obtained by the Time Series R ainfall lies slightly above that obtained using the full simulation approach but this is not considered significant.
The pond level obtained by using The Time Serie s R ainfall is theore tically more accurate but it se ems likely t hat t he de sign simulation which is base d on the full simulation analysis, ca n be u se d wit h lit t le e r r o r . T h e de sign simulation approach has the advantage of being
easy and in expensive to use, whereas the Time Se r ie s R a in fa ll a p p r o a ch is cle a r ly mo r e expensive and complicated.
I n a n e ffo r t t o id e n t ify a n y p r o b le m associated wit h t he lag and t o investigate t he significance of the tide e ffe ct t he start of t he T ime Se r ie s R a in fa ll was st agge r e d. F ou r different start points were allocated for the first three ranked peak pond level events. The result showed that the rainfall was a more significant than either the size of the tide or t he lag. The results indicated that, within the limit ation of the model, the assumption of no co rrelation b e t we e n t h e t id e a n d r a in fa ll e ve n t is reasonable.
REFERENCES
1. Br an , M. A., "E st ima t ion of d esign floo d an d th e pr oblem of e qu a tin g the p rob abilit y of ra infall a nd r u n off",UNESCO-WMO-IAHSCo nf. on D e sign o f W a t e r R e so u r ce s P r o je ct wit h I n a de q u a t e D a t a , Madrid, Vol. 2, 459-471, (1973).
2. Institu te of H ydrolo gy, H ydrological Stu die s; F lood Studies Report, Vol. 1, 41-48, (1993).
3. Hughes, T. G. and Gorgi-Bandpy, M., "The Analysis of su r fa ce wat e r d et e nt io n po n ds fo r tida lly affecte d d ra in a ge o u t fa lls",Proc. Istn. Civil Engrs., W at er , Maritime and Energy, NO.124, 202-211, (1997). 4. Packman, J. C. and Kidd, C. H. R., "A logical approach
to the design storm concept",Water Resources Research, No. 16, 994-1000, (1980).
5. Gringorton, I. I., "A plotting rule for extreme probability paper", J. Geophys. Res., 68, pp. 813-814, (1963). 6. G u m b el, E . J., "Sta t ist ics o f e xt r em e s", Co lu m bia
University Press, New York, (1958).