Table of Contents
Title...2
Introduction...3
Method of Data Collection...4
Instrument Use to Collect Data...5
Students Questionnaire...5
Procedures Use to Collect Data...7
Presentation of Data...8
Appendix I...13
Mathematical Concepts Used for Full-Time Students...13
Appendix II...14
Mathematical Concepts Used for Part-Time Students...14
Analysis of Data...15
Discussion of Findings...16
Title
An investigation on how much money do full-time students spend as opposed to part-time
students on a daily basis at Portmore Community College.
Introduction
The Portmore Community College Old Harbour campus is a small institution that caters for
students who lives within the St. Catherine and other surrounding Parishes. It is the only
Community College within the vicinity of Old Harbour. It was the first school in Old Harbour to
offer full and part-time education to tertiary and Continuing Studies (CSEC) students. Today the
school population is Four hundred (400) students for both full and part-time programs altogether.
This research was chosen to gain an understanding of the daily spending of Full-Time and
Part-Time Students. It is hoped that the information would be helpful in guiding future research as
well as inspire students to find ways they can save monies on a daily basis.
Here are the Objectives to be achieved from this research:
1. To find out the daily spending patterns of Full-Time and Part-time Students
2. To evaluate the greater spending pattern of each group.
Method of Data Collection
In order to collect data, a method of a survey, the researchers have decided to use printed
questionnaires to complete this assignment.
The questionnaire as an instrument for collecting data has a number of advantages:
It requires little time to be completed.
It can be done at the convenience of the person required to have it completed.
It guarantees confidentiality since respondents are not required to attach their names.
Instrument Use to Collect Data
(Questionnaire)
Dear Students,
We are Continuing Studies Evening students at the Portmore Community College, Old Harbour
Campus. We are currently re-sitting the CSEC Mathematics subject for the year academic year
2017 to 2018. We are asking for your cooperation in our investigation on how does college
full-time students spend on a daily basis as oppose to part-full-time students. This survey is for our
School Based Assessment (SBA). The main objective of this questionnaire is to gather
information which is accurate and reliable. We are kindly asking for your cooperation in
successfully completing this questionnaire in which the confidentially of you our respondents are
fully guaranteed.
Students Questionnaire
1. Sex: Male ( ) Female ( )
2. Are you a: Full-time student ( ) Part-time student ( ) Both ( )
3. Do you live in the vicinity of Old Harbour? Yes ( ) No ( )
4. If your answer to the above question was ‘NO’. Do you travel in public transportation to
get to school? Yes ( ) No ( ) Sometimes ( )
5. How much is your daily spending for school? $500-$800 ( ) $900-$1400 ( )
$1500-$1900 ( ) $2000-$2500 ( )
6. How many days of the week do you attend school? 2 days ( ) 3 days ( ) 4 days ( ) 5
7. Are these days inclusive of weekends as well? Yes ( ) No ( ) Sometimes ( )
8. How many hours do you spend at school daily? 4hrs ( ) 5 hrs ( ) 6 hrs ( ) 7 hrs ( )
9. Do you carry lunch to school? Yes ( ) No ( ) Sometimes ( )
10. If you answer to the above question was ‘YES’ do you save back a lot? Yes ( ) No ( )
Sometimes ( )
11. Is that savings use for: School assignments ( ) Personal Use ( )
12. Is your daily spending inclusive of taxi/bus fair? Yes ( ) No ( ) Sometimes ( )
13. If your answer was ‘YES’, by how much? $100 ( ) $150 ( ) $200 ( ) $300 ( ) $1000 ()
14. Do you work and attend school? Yes ( ) No ( ) Sometimes ( )
15. If your answer to ‘question 14’ is ‘YES’, who is your sole provider? Mother ( ) Parents
( ) Yourself ( ) Spouse ( )
Procedures Use to Collect Data
As stated before The Portmore Community College student population's about 400 for both
full-time and part-full-time programs. It was calculated that about 12% of the school population was
necessary to ensure accurate conclusion on how much college students spend on a daily basis.
(7.5% of 400=30)
A total of 30 questionnaires were printed and distributed to the students. It was expected that all
30 questionnaires would be returned as the researchers were the ones who walked and handed
the one to the respondents.
We, therefore, decided to choose the following students by a process of random selection which
caters for all requirements mentioned above. We placed thirty (30) pieces of folded paper in a
bag numbered from one to thirty. The bag was then shaken vigorously to ensure a thorough
mixture of the numbers. We then ask the students to choose a number one at a time after each
Presentation of Data
A total of 30 questionnaires were distributed to the students and all were returned. From these
respondents 50% were male and 50% were females.
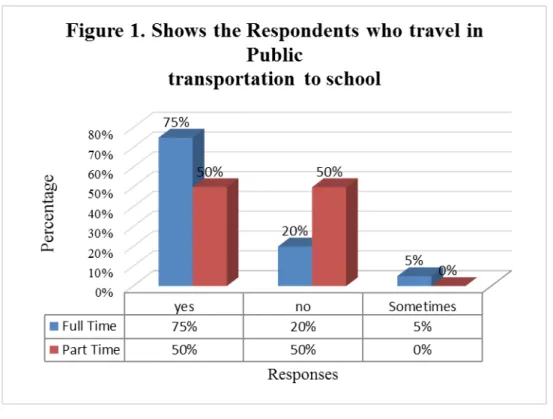
Figure 1. Colum chart showing all respondents who travel in public transportation to school. It
was agreed by the majority of the full-time students that they do travel via transportation to
school. It can be seen that 75% of the students say ‘yes’ they do travel in public transportation to
get to school, 20% say ‘no’ they do not travel in public transportation to get to school and the
remaining 5% say that ‘sometimes’ they do travel in public transportation to get to school. The
part-time student, on the other hand, shares an equal percentage on whether they travel to school
via transportation or not, 50% say ‘yes’ they do travel to school in public transportation and the
remaining 50%say ‘no’ they do not travel to school via public transportation.
Figure 2: Bar Chart showing the daily spending inclusive of taxi fare. In this chart, base on the
data given it can be seen that majority of the full and part-time students daily spending is
inclusive of taxi fare, 85% of the full-time students say ‘yes’ their daily spending is inclusive of
their taxi fare and 80% of the part-time student as well ‘yes’ that their daily spending is also
inclusive of taxi fare. The remaining 20% of the part-time students say ‘sometimes’ their daily
spending is inclusive of taxi fare, as for the full-time students 5% of the students say ‘no’ to their
daily spending having to be inclusive of taxi fare and the remaining 10% say ‘sometimes’ their
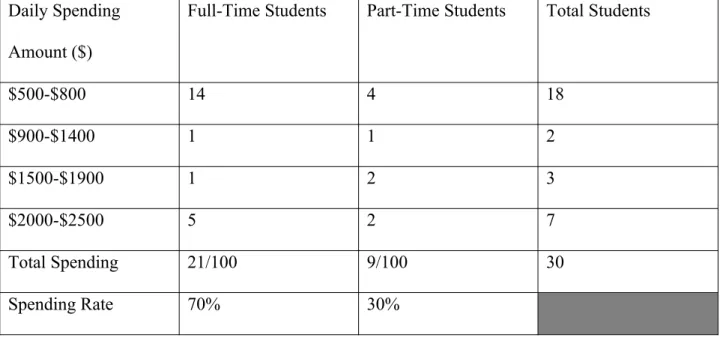
Table 1: Shows the daily spending of the respondents.
Daily Spending
Amount ($)
Full-Time Students Part-Time Students Total Students
$500-$800 14 4 18
$900-$1400 1 1 2
$1500-$1900 1 2 3
$2000-$2500 5 2 7
Total Spending 21/100 9/100 30
Spending Rate 70% 30%
The table above shows the data collected for both full and part-time students’ daily spending
amount. The amount of money, as well as the total amount of students who does their daily
spending, can also be seen. The total percentage rate for both full and part-time student was
calculated by the total amount students that participated in the survey. The majority of students
that does the most spending are the full-time students (70%) and minorities are the part-time
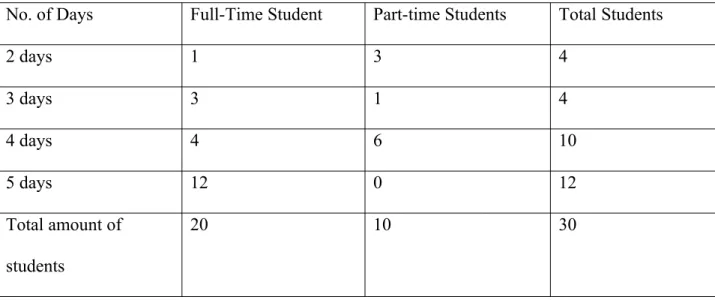
Table 2. Showing the frequency of daily attendance of respondents
No. of Days Full-Time Student Part-time Students Total Students
2 days 1 3 4
3 days 3 1 4
4 days 4 6 10
5 days 12 0 12
Total amount of
students
20 10 30
The table above shows the number of days that full and part-time students attend school. As it
can be seen that a total of twenty(20) full-time students spend the most days at school and the
remaining ten(10) who are Part-time spends the least amount of days at school.
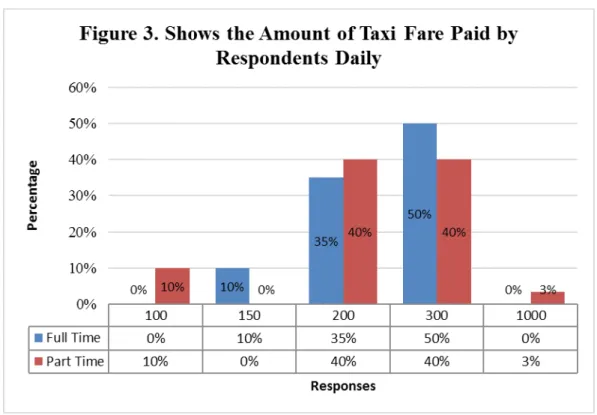
Figure 3. Colum Chart Shows the amount of money spent on taxi fares. From the data below it
can be seen were 50% of full-time students spend $300 on taxi fare from their daily spending,
35% spend $200 from their daily spending on taxi fare and 10% spend $150 on taxi fare from
their daily spending also, as for the part-time students an equal 40% of students spend from
$200-$300 on taxi fare from their daily spending and only 3% spend $1000 on taxi fare from
Appendix I
Mathematical Concepts Used for Full-Time Students
To respond to the research question under investigation, the researcher employs approximation and
estimation by use of sum and average costs to ascertain a more scientific result.
Full-Time Students
EXPENDITURES Maximum Average
Transportation: Take Taxi (Figure 2) 17/20 = 85% -Daily Spending: Per Student
(Lunch, School Supplies)
$650 x 14 = $9,100 $1150 x 1 = $1150 $1700 x 1 = $1700 $2250 x 5 = $11,250 Avg = $23,200/21
= $1104.76
Taxi Fare $300 $100 x 0 = $0
$150 x 2 = $300 $200 x 7 = $1400 $300 x 10 = $3000 $1000 x 0 = $0 Avg. = $4700/19
= $247.37 GRAND TOTAL (values as a group) 17 x $650 = $11,050
17 x $300 = $5,100 $11,050 +$5,130 = $16,180
17 x $1104.76 = $18,780.92 17 x $247.37 = $4205.29 $18,780.92+ $4205.29 = $22,986.21 Total Per Person $16,180/17 = $951.76 $22,986.21/17 =
$1,352.13
Appendix II
Mathematical Concepts Used for Part-Time Students
Part Time Students
EXPENDITURES Maximum Average
Transportation: Take Taxi (Figure 2) 8/10 = 80%
-Daily Spending
(Lunch, School Supplies)
$650 x 4 = $2,600 $1150 x 1 = $1,150 $1700 x 2 = $3,400 $2250 x 2 = $5,500 Avg = $12,650/9
= $1,405.56
Taxi Fare $100 x 1 = $100
$150 x 0 = $0 $200 x 4 = $800 $300 x 4 = $1,200 $1000 x 1 = $1000 Avg. = $3100/10
= $310.00 GRAND TOTAL (values as a group) 8 x $650 = $5200
8 x $250 = $2,000 $5200 +$2000 = $7200
8 x $1104.76 = $8,838.08 8 x $247.37 = $1978.96
$8838.08 +$1978.96 = $10,817.04
Analysis of Data
The analysis of data was conducted using methods of comparison of figures, inequalities,
computation techniques and use of measures of central tendency to determine the results
achieved.
After completing the calculations, the following highlights were observed:
On an average, there is no difference between the amount spent by full-time students and
part-time students. However, when looking at the most frequent response of students the full-part-time
student spends a small difference of $51.76. There is not much difference in the amount spent at
the per person level.
Discussion of Findings
The following findings arrived from the data collected and presented above:
1. No significant difference in monies spent on an average, but a small difference between
the majority groups from full time versus part time of $57.67.
2. Majority of the respondents whether full-time or Part-time emphasized that they spent
Conclusion
The question proposed for this investigation was truly answered through scientific mathematical
means. The process was enlightening since the findings were not as expected. It was assumed
that Full-Time students were spending more money daily than Part-Time Students. However, the
calculations gave an astonishing result that there was little or no significant difference between
the expenditure of Full-Time students and Part-Time Students.