Trust and Tithing: The Relationships between Religious
Social Capital and Church Financial Giving
Dr Darin Freeburg
PhD(Comm&Info)(KentStateUni); MA(TheolStud)(NTS); BA(MNU)
Contact:
Abstract
There are a number of motivations for Christians to give financially to a church. The current study looked at Social Capital—especially as it relates to the concept of trust in God and bonds with a church community—to see if relationships exist that suggest a possible motivation for financial giving. Participants from American Protestant churches in the Midwest completed an online survey intended to elicit responses about their church financial giving and their levels of a specific religious measurement of Social Capital (SC). Analysis showed that increased trust in God, as well as increased sense of bonding with others in the church was significantly related to increased percentages of individual giving. However, increased trust in one’s self—another measure of trust in SC—was only related to an increase in the frequency of giving with no increase in the actual percentage or amount. This study has important implications for churches as it suggests that some of the very ideals that distinguish it from other organizations — trust in God and increased bonding with others — also have positive relationships with its economic stability as people tend to give more financially when they exhibit these characteristics
Introduction
the area of SC and church financial giving is presented. Particular attention is paid to how these two concepts might be related. The next section outlines the methods used in the study, including sample and measurement tools. Finally, an analysis of the data is presented with a discussion of implications.
Literature Reviews - Social Capital
The SC concept has received much attention in the literature, although differing conceptualizations have caused confusion over what is meant by the term. The current study accepts the definition of SC as “features of social life—networks, norms, and trust—that enable participants to act together more effectively to pursue shared objectives” (Putnam 1995, p. 2). It is the social connectedness of individuals within a group, and the levels of trust and cooperation that allow them to do things together. The use of Putnam’s conceptualization of SC is in line with much of the research currently being conducted on SC, as Carpiano noted that recent studies have “almost exclusively relied upon Putnam’s . . . conceptualization of social capital” (2006, p. 165).
SC is embedded in relationships, results from participation in a group, and is a result of the social obligations that arise from these relationships. It is a set of resources that is located in relationship itself; SC is embedded within the relationships among people (Burt 1992, p. 58; Coleman 1988, p. 111; Nahapiet & Goshal 1998, p. 243). Put rather simply, SC is that which allows a community or person within a community to accomplish something that would not be possible to accomplish without SC (Coleman 1988, p. 98). Putnam later defined SC as more directly and explicitly related to
community engagement, and defined it as the “norms and networks of civil society that lubricate cooperative action among both citizens and their institutions.” (1998, p. v). He included “civic engagement, healthy community institutions, norms of mutual reciprocity, and trust” upon which all social institutions rely (p. v).
SC and Churches
Because SC is inherently relational and developed within groups, churches offer important examples of communities where levels of SC can be meaningfully measured. Putnam included churches in his outline of the concept, noting that “Church-related groups constitute the most common type of organization joined by Americans” (1995, p. 14). He even pointed to declining church membership in the United States as an example of declining SC (Putnam 1998, p. v).
There is evidence for these SC assets or outputs within churches. For instance, SC development in churches is evidenced through the development of civic skills (Verba, Brady & Schlozman 1995). These civic skills are often afforded to the disadvantaged or lower socioeconomic classes in churches (Prins & Ewert 2002, p. 18). In this way, churches provide people with resources they would not have had without the church.
Why Putnam’s Conceptualization? Putnam’s focus on trust and community engagement as the defining features of SC has been critiqued (Portes 1998; Carpiano 2006). Portes argued against what he perceived to be a solely positive portrayal of SC, one that does not account for possible abuses of SC, including the use of that capital to exclude people (1998, pp. 15, 18). However, it is difficult to provide in the definition of a term all of its potential uses. Putnam himself acknowledged that SC in gangs lead to effective corporation “to the detriment of the wider community” (1995, p. 665).
networks” (2006, p. 168). Thus, he contended that Putnam’s conceptualization of SC is not actually SC but, rather, social cohesion (p. 168). However, this critique is not considered to be a valid reason not to use Putnam’s definition in the current study. This is because the trust and social ties leading to social cohesion are considered to be resources on their own, rather than mere conditions for resource development. Trust is something one can give or receive, and it is particularly important for the current study in analyzing how this social cohesion affects financial giving. These are the resources that can lead to the transfer of other resources in a church—including financial resources. However, to say that the trust and collaboration allow for resources is not to say that trust and collaboration are not themselves resources.
Observable SC
SC includes three primary types: bonding, bridging, and status bridging SC. Bonding SC describes the ways in which individuals in a group create strong relationships with a select few (Putnam 2000, p. 22). Bridging SC, on the other hand, refers to the ways in which individuals make a broader net of relationships that are not as strongly tied (pp. 22-23). Status bridging SC provides opportunities for people of one group to interact with those in another and is especially important in terms of higher and lower socioeconomic status (Wuthnow 2002, p. 670).
The Williams Religious Social Capital Index (WRSCI) (2008) was used in the current study to measure levels of SC. The WRSCI looks at the horizontal dimensions of bonding and bridging noted by Putnam, but specifically asks about how this occurs in a church context, for example, meeting new people in church. It also includes the vertical upward mobility dimensions noted by Wuthnow (2002), but specifically asks about how the church helps make these links and connections.
The WRSCI also looks at the concept of trust — noted by Putnam (1995) as a defining feature of SC’s role in allowing individuals to act together — in churches, looking at an individual’s trust in God, himself or herself, and other people. These are important distinctions in the way trust operates:
1) Trust in other people is externally oriented, and is the typical conceptualization of trust noted in other SC measurements. Coleman (1990) argued that trust is grounded on the assurance that a given relationship will be beneficial—ideally for both the trustor and trustee.
2) The current study also seeks to understand the role of trust in God. This trust is not as easily and directly observable as trust in other people.
3) Trust in one’s self is internal. Williams does not provide a detailed description of this trust, noting that the SC he measures is based on “a relationship between two or more individuals based on trust” (2008, p. 329). The very idea of trust in one’s self seems conceptually odd in a scale of relationships. Indeed, an arrogant or overconfident individual can trust him or herself and take no part in community.
Financial Giving
that, of the respondents that gave more than $25 to a religious or charitable organization, the median donation to a religious organization was $350 (Connected to Give 2013). The mean donation was $1,500. Yörük (2013) analyzed 2003 and 2005 data from the Center of Philanthropy Panel Study and the philanthropy module of the Panel Study of Income Dynamics. Linking these two data sets, Yörük noted that 50% of respondents gave to religious organizations. The average giving amount was $1,057. However, the standard deviation1
The question of financial giving is especially important given the statistics that show individuals in America are participating less in the organized church. Research from the Barna Group (2013) shows that 59 percent of American Millennials
was $2,909. Such a high standard deviation shows that there were a few high givers that skewed the mean. This is likely due to general income levels, in that higher income individuals give a larger amount but a similar percentage.
2
What encourages people to give money? An important question to consider for the current research is the motivation for individuals to contribute money to the church. This typically centers on notions of tithing and faith. Some point to a belief in the practice of tithing as a motivation for financial giving, which is the common Christian practice of giving 10% of one’s income to the church—although the exact nature of this percentage is not universally accepted (Dahl & Ransom 2002; James & Jones 2011). However, tithing is a complex theological issue outside of the realm of the current research. The theological tradition of the tithe is a contested history (Davis 1987; Brace 1998, pp. 15-18; Kaufman 2015, p. 2), and it is not within the scope of the current research to consider this history in full. Rather, the current research considers levels and behaviors of giving, without a necessary analysis of tithing as a theological concept. The focus of the current study is on possible links between SC and financial giving
who grew up in a Christian church stop attending when they get older. More troubling for American Christian churches is the finding that 52 percent of these Millennials have no church affiliation. This represents a significant potential decrease in overall amounts of financial giving.
Others point to faith as a motivation for financial giving (Davis 1987, p. 94; Showers, et. al. 2011). Showers et al. described a faith factor in financial giving that encompasses “religious values shared by this group of religious givers, regardless of income, race, or education [that] may provide a more plausible explanation of the motivation for charitable giving behavior” (p. 183). In analyzing the development of faith in schools associated with the Council for Christian Colleges and Universities, Holcomb and Nonneman included trust in the Creator as part of the definition of faith (2004, p. 94). Therefore, faith is defined in the current study as identification with others sharing religious values, and identification with God—understanding that a full definition of such a complex concept is beyond the scope of the current research.
Faith so defined could provide an important motivator for financial giving in the current study. Research on church affiliation among Millennials shows the importance of this personal identification with religion. Although showing a decline in organized church affiliation among Millennials, the Barna Group research suggests that facilitating an external connection with God is something that will draw Millennials back to the
1 Standard Deviation is a measure of how spread apart the data is from the average. When this
spread, or dispersion, is large, there are outliers on the high or low end of that spread.
church. The finding that 68% of Millennials who remain active in the church believe that “Jesus speaks to them personally in a way that is real and relevant” supports this (Barna Group 2013). Only 25% of Millennials no longer affiliated with church believe this. This importance for attendance could also show importance for financial giving.
Observable Financial Giving: King and Hunt’s (1975) Index of Attendance and Giving (IAG) was used to provide a measure of financial giving in churches. This 12-item scale includes elements of attendance, church activity, and financial contribution to church—although financial contribution was the primary reason for its inclusion (see Appendix B). Questions of attendance and activity were included to more clearly define the sample, whereas questions of financial giving were directly related to the research questions driving the current study. King and Hunt provide for a deep understanding of financial giving by indicating both percent of total income and the frequency of the giving behavior itself. This is important in understanding whether or not the actual behavior of giving has an impact separate from the amount given.
SC and Financial Giving: A central question for the current research is whether or not SC has any relationship with one’s financial giving behavior. Forbes and Zampelli found that SC had significant positive impacts on charitable giving, such that they argue, “For the philanthropic community, investments in social capital formation should pay clear dividends” (2013, p. 2488). Although SC is clearly related to charitable giving, however, it is not clear that SC is a cause for increased giving. For religious groups in particular, it is possible that the act of giving itself engenders feelings of trust and commitment.
Methodology - Procedures
This study randomly sampled congregations within a specified geographic area in the Midwestern United States.3
A letter of invitation was emailed to the clergy of each congregation, asking each of them to disseminate information with the attendees of their congregation about taking an online survey. Pastors were encouraged to discuss the research from the pulpit as well as distribute information in church bulletins and newsletters. Attendees of each congregation were asked to complete a 15-minute survey about their church behavior. This survey was constructed and completed using the online survey software, Qualtrics. Data from the survey was then exported into the software, SPSS, for statistical analysis. SPSS is commonly used for such analysis.
A list of Christian churches from the Mainline Protestant and Evangelical traditions in America was compiled using distinctions made by the Association of Religion Data Archives (The ARDA 2010a; The ARDA 2010b). This list constituted the sampling frame, and only churches within the Midwestern United States were included. Using a systematic sampling, where every 10th church in the list of churches was selected, five churches were then included in the study. One church from each of the following denominations participated in the study: Presbyterian Church USA (PCUSA), Evangelical Lutheran Church in America (ELCA), North American Lutheran Church (NALC), American Baptist Churches USA (ABCUSA), and United Methodist (UM).
Participants
A total of 81 respondents took the online survey, although eight respondents left many questions unanswered, as they were not forced to answer each question. Thus,
most statistics are based on 73 usable survey answers. Of these, 77% of respondents indicated an affiliation with the PCUSA, and 23% indicated affiliations with the ELCA, NALC, ABCUSA, or UM. Thus, the highest response rate was from the PCUSA church included in the study (see Table 1). Response rates are calculated based on the percentage of potential participants that actually complete the survey. Because exact attendance on a given Sunday at each of these churches was not known, it is not possible to provide exact response rates.
Table 1: Participant Denomination
Denomination Number of
Participants
PCUSA 56
ELCA 7
NALC 3
ABCUSA 2
UM 5
Total Participants* 73
*Based on those completing the majority of the survey.
Gender was equally represented between male (43%) and female (57%) (see Table 2) and the vast majority of respondents (92%) were over the age of 34 (see Table 3). Education levels from high school to professional degrees were equally represented, with 52% having at least a 4-year college degree, and 48% having a Masters Degree or higher (see Table 4). The majority of respondents (63%) had been a member of the congregation for more than six years.
Table 2: Snapshot of Participant Gender
Gender Participants Number of
Male 41
Female 32
Total Participants* 73
*Based on those completing the majority of the survey.
Table 3: Participant Age
Description Participants Number of
Age
18-34 6
35-49 13
50+ 54
Total Participants* 73
*Based on those completing the majority of the survey. Table 4: Participant Education
Education Participants Number of
At least 4-yr college 38
Masters and above 35
Total Participants* 73
Measurement
The survey consisted of 12 items from the WRSCI to measure levels of SC, and 12 items from the IAG to measure levels of attendance, activity, and financial giving. Specifically, the WRSCI measured levels of religious SC; thus, this concept will be referred to as Religious Social Capital (RSC). In SPSS, descriptive statistics were first determined to provide an overview of the participants. Descriptive statistics provide a statistical look at various characteristics of the participants, and include averages, standard deviations, etc. For this study, the descriptive statistics about denomination, gender, age, education level, and length of time at a congregation were important in describing the participants. The researcher also looked at levels of attendance and overall church activity. Because measurements on these items were categorical, meaning they could be grouped into categories of responses rather than on a sliding scale, chi-square tests4 were conducted. These tests provide an indication of whether or not the responses to questions about attendance and church activity differ significantly from the assumption that they will be the same for all participants.5
Next, statistical tests were conducted to analyze the relationships between financial giving and RSC—the primary goal of the research. Because the RSC scales asked respondents to rank their agreement on a 5-point scale, it was necessary to conduct one-way ANOVA tests.
Levels of financial giving were analyzed using the same chi-square tests and assumptions.
6 These tests provide an indication of potential significant differences between the average score on RSC—from 1 to 5—and levels of financial giving, i.e. is RSC significantly different among those participants who gave a little or a lot? Further post-hoc statistical tests were performed if significant differences were found.7 Sometimes respondents will answer a 1 to 5-scale question in similar groupings, i.e. most indicate 1 or 4. In these cases, it makes sense to change this from a 1-5 measurement and into a less than or more than 3 measurement. This provides only two
groups of respondents, rather than seeing them all on a 5-point scale. In these cases, the measurement was re-coded in SPSS. To analyze the differences between measures on the 5-point scale and these categorical measures that are now in two categories, t-tests8
To further explain the various tests used, a helpful example is to consider student ratings of a local restaurant. A one-way ANOVA would be used to identify differences in ratings across a number of different students. A t-test would be used to identify differences in ratings between just males and females. A chi-square test would be used were conducted. These tests provide an indication of potential significant differences between a 5-point measurement like RSC and a measurement that only has two possible answers—such as the recoded measurements just discussed. This differs from the one-way ANOVA that looks at questions that have more than 2 possible answers. Chi-square tests were conducted to note areas where participant characteristics significantly differed from an expected average.
4 A chi-square tests the goodness of fit between the observed values and the expected values.
5 To say a result is significant means that the findings can be attributed to real differences and are
likely not due to chance alone.
6 A one-way ANOVA tests if there are significant differences in the average values across three or
more different groups.
7 A one-way ANOVA is only able to show that there is a difference, but not where these differences
exist. This makes it necessary to conduct post-hoc tests to show what specific groups account for the overall difference noted in the one-way ANOVA.
to find out if a particular student group is more likely than expected to go to a particular restaurant or not.
Results - Sample Group Characteristics
Questions of attendance and church activity were included to provide a more detailed description of the sample group. This helps set the boundaries for what the results can actually say about other groups of people, i.e. the limited generalizability of the results (see Tables 5 & 6).
Attendance: The majority of respondents indicated that they attended church once a week (N = 44), and on 3 or more Sundays per month (N = 64).9 This was originally asked on a 3-point scale, but because participants indicated a wide range of attendance, the attendance variable was re-coded as a 2-condition categorical variable showing more or less attendance. This allows for a more meaningful analysis with more participants in each group, although it limits the specificity of the measurement. A chi-square was conducted to determine if there were significant differences in these levels from the even distribution expected. Analysis shows that, if not prevented by unavoidable circumstances, participants were more likely to attend at least once a week (N = 60) than less than once a week (N = 13), χ2[1, N = 73] = 30.26, p < .001.10
Church Activity: A chi-square was also conducted to determine if there were differences in the overall levels of church activity among participants. This was measured by number of evenings spent at church meetings or in church work. There was no significant difference from the average expected in the number of evenings participants spent at church meetings or church according to the original question, χ2[5, N = 72] = 10.17, p > .05. This was originally asked with six possible answers, from never to more than once a week. However, due to varied responses, level of activity was re-coded as a 2-condition categorical variable showing more or less than once a week at evening church activities. This, again, grouped more individuals into a category allowing a more meaningful analysis, although limiting the scope of the findings. Analysis shows that there are significant differences in levels of activity, χ2[1, N = 72] = 29.39, p < .001. Participants were more likely to spend less than one evening a week at church activities (N = 59) than more than once a week (N = 13). This revealed lower overall evening participation among participants (see Table 5).
Thus, most participants were weekly church attendees (see Table 5).
Next, a chi-square was conducted to determine if there were significant differences in participant’s ratings of their own activity in the congregation. This was originally asked with four potential answers, from inactive to very active. However, responses varied widely, so results were re-coded as a 2-condition categorical variable showing more or less activity. Analysis shows significantly more participants than expected indicated they were very active or somewhat active (N = 67) than indicated they were somewhat inactive or inactive (N = 6), χ2[1, N = 73] = 50.97, p > .001. Thus, participants were more likely to rank themselves as highly active, even though they showed lower levels of evening participation (see Table 5).
9 N shows the number of participants with a particular response.
10 In a chi-square result, this formula shows that the number of participants answering the question
(N) was 73, and that the actual measurement of the chi-square (χ2) was 30.26. The number
A chi-square was then conducted to determine if there were significant differences in the satisfaction that church activities brought to participant’s lives. This was originally asked with four potential answers; from strongly disagree to strongly agree. Responses varied widely, so results were re-coded as a 2-condition categorical variable simply showing agreement or disagreement with the statement, “Church activities (meetings, committee work, etc.) are a major source of satisfaction in my life.” Analysis shows that participants were significantly more likely than expected to agree with this statement (N = 58) than disagree (N = 15), χ2[1, N = 73] = 25.33, p > .001 (see Table 5). The majority of respondents also indicated that they had taken Holy Communion during the past year (N = 55). Both measures indicate high levels of church activity and participation.
Table 5: Analysis of Participant Church Activity
Church Activity Number of
Participants
I attend church activities at least once a week 60*
I spend less than one evening a week at church
activities 59*
I am at least somewhat active in church 67*
Church activities (meetings, committee work, etc.)
are a major source of satisfaction in my life 58*
*Chi-Square significant at the .001 level.
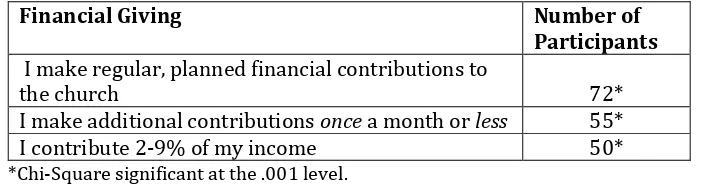
Financial Giving: All but one of the respondents (N = 72) indicated that they make regular, planned financial contributions to the church (see Table 6). Further analysis was conducted, however, to determine the amount and frequency of these contributions. Frequency of giving in addition to the general budget and Sunday School was originally asked with five potential answers, from never to once a week or more. However, responses varied widely, so results were re-coded as a 2-condition categorical variable showing that participants gave once a month or less, or more than once a month. Analysis shows that participants were significantly more likely to contribute this additional money once a month or less (N = 55) than more than once a month (N = 18), χ2[1, N = 73] = 18.75, p > .001 (see Table 6).
A chi-square also shows that the distribution of percentage of income given to the church differed significantly from expected, χ2 [2, N = 71] = 44.48, p > .001. Participants were significantly more likely to indicate giving 2-9% of their income (N = 50) to the church than 1% or less (N = 8) or 10% or more (N = 13) (see Table 6).
Table 6: Analysis of Participant Financial Giving
Financial Giving Number of
Participants
I make regular, planned financial contributions to
the church 72*
I make additional contributions once a month or less 55*
I contribute 2-9% of my income 50*
*Chi-Square significant at the .001 level.
Financial Giving and Religious Social Capital
run for each sub-construct11
Analysis was conducted to determine if there were differences in overall RSC according to the percentage of income dedicated to tithing. Here the entire RSC construct was analyzed, rather than individual components of that construct. Because percentage of income was measured on a 5-point scale, a one-way ANOVA was conducted. Analysis shows that there are significant differences in SC based on percentage of income given to the church, F(2, 68) = 4.02, p < .05
: trust (.84), bonding (.75), bridging (.81), and linking (.73). These sub-constructs outline separate important distinctions in overall social capital, but can also be used as a combined measurement of overall religious social capital. Only the financial giving items on the questionnaire were analyzed for correlations with RSC. These reliability numbers show that individual participants answered similarly on all questions grouped within each of the four constructs, making them reliable measures of the construct they are proposed to measure. The results of the current study validate previous estimates of reliability for the WRSCI.
12. A post-hoc Tukey13 was run—as a means of determining to what these differences could be attributed— showing significant difference between those who gave less than 1% of their income (M = 3.71; SD = 0.93)14
Frequency of Giving: After finding significant differences in overall RSC levels, it was important to determine if specific aspects of RSC contributed to more or less of this difference. Individual parts of the WRSCI were analyzed to determine how the frequency of financial contributions impacted RSC. Respondents were asked how often they made contributions to the church in addition to the general budget and Sunday School. Because results grouped around once a month or less, or more than once a month, an independent t-test was conducted (see Table 7).
and those who tithed between 2% and 9% (M = 4.25; SD = 0.44). Respondents who gave less money to the church as a percentage of income, therefore, showed significantly lower overall RSC levels.
Table 7: Results of independent t-tests of difference between financial giving frequency and RSC.
Description N Mean Std. Deviation Std. Error
Mean Frequency of giving and levels of trust
in myself
More frequent giving 32 3.84 0.81 .14
Less frequent giving 41 4.20 0.72 .11
Post-hoc results are not shown in Table 7, but are reported in the text. Results show that respondents who reported more frequent giving (M = 4.20; SD = 0.72) showed significantly higher agreement with the phrase, “Being in the church builds up my sense of trust in myself,” than those with less frequent giving (M = 3.84; SD = 0.81). This question of trust in myself was part of the trust sub-construct within the RSC scale. Thus, giving more frequently is positively correlated with trust; but, specifically, this
11 The reliability analysis shows how closely grouped together individuals are on specific questions
said to be indicators of a specific concept, like trust. The higher this number, the more consistently individuals scored on this concept. This shows that the individual questions that make up this concept work well together as a measurement of the concept as a whole.
12 In a one-way ANOVA result, the two numbers bracketed after F indicate degrees of freedom. The
actual F measurement is then shown (4.02). The significance is still measured by p.
13 A post-hoc Tukey is a statistical test conducted after the one-way ANOVA to determine where
differences actually occurred.
increased frequency of giving is positively correlated with an individual’s assessment of trust in him or herself. The same levels of significant differences were not found with frequency and other questions in the Trust part of the WRSCI.
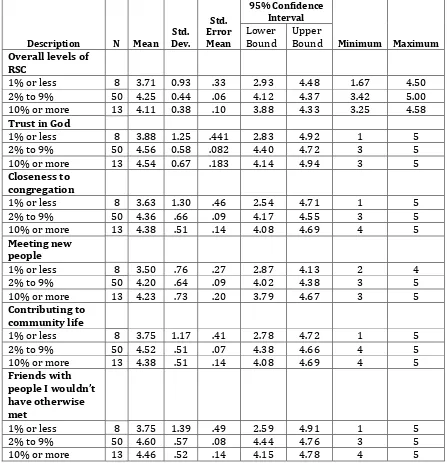
Percentage of Income Given: Individual sub-constructs and measures of the WRSCI were analyzed to determine how the percentage of financial contributions and RSC were related (See Table 8).
Table 8: Results of one-way ANOVA tests of difference between financial giving percentage of income and RSC measures. Independent Variable: Percentage of Income contributed to church.
Description N Mean Dev. Std.
Std. Error Mean
95% Confidence Interval
Minimum Maximum
Lower
Bound Upper Bound
Overall levels of RSC
1% or less 8 3.71 0.93 .33 2.93 4.48 1.67 4.50
2% to 9% 50 4.25 0.44 .06 4.12 4.37 3.42 5.00
10% or more 13 4.11 0.38 .10 3.88 4.33 3.25 4.58
Trust in God
1% or less 8 3.88 1.25 .441 2.83 4.92 1 5
2% to 9% 50 4.56 0.58 .082 4.40 4.72 3 5
10% or more 13 4.54 0.67 .183 4.14 4.94 3 5
Closeness to congregation
1% or less 8 3.63 1.30 .46 2.54 4.71 1 5
2% to 9% 50 4.36 .66 .09 4.17 4.55 3 5
10% or more 13 4.38 .51 .14 4.08 4.69 4 5
Meeting new people
1% or less 8 3.50 .76 .27 2.87 4.13 2 4
2% to 9% 50 4.20 .64 .09 4.02 4.38 3 5
10% or more 13 4.23 .73 .20 3.79 4.67 3 5
Contributing to community life
1% or less 8 3.75 1.17 .41 2.78 4.72 1 5
2% to 9% 50 4.52 .51 .07 4.38 4.66 4 5
10% or more 13 4.38 .51 .14 4.08 4.69 4 5
Friends with people I wouldn’t have otherwise met
1% or less 8 3.75 1.39 .49 2.59 4.91 1 5
2% to 9% 50 4.60 .57 .08 4.44 4.76 3 5
10% or more 13 4.46 .52 .14 4.15 4.78 4 5
To determine more precisely what contributed to this difference, a post-hoc Tukey was conducted, and analysis shows that those who gave 1% or less (M = 3.88; SD = 1.25) were significantly less likely to agree with this statement than those who gave 2% to 9% (M = 4.56; SD = 0.58). Thus, the percentage of income given to the church was significantly related with the specific measurement of trust that related to God. As the percentage increased, participants were more likely to show higher levels of this specific form of trust.
Results also show that there were significant differences in agreement with the statement, “I feel close to the church congregation” among the levels of tithing, F(2, 68) = 3.63, p < .05. This was a measure of bonding SC. Further investigation utilizing a post-hoc Tukey shows that those who gave 1% or less (M = 3.63; SD = 1.31) were significantly less likely to agree with this statement than those who gave 2% to 9% (M = 4.36; SD = 0.66).
There were significant differences in agreement with the statement, “Being in the church helps me to meet new people,” among the levels of giving, F(2, 68) = 3.98, p < .05. This was a measure of bridging SC. Further investigation utilizing a post-hoc Tukey shows that those who gave 1% or less (M = 3.50; SD = 0.76) were significantly less likely to agree with this statement than those who gave 2% to 9% (M = 4.20; SD = 0.64).
The data indicated significant differences in agreement with another measure of bridging SC—“Being in the church helps me to contribute to community life”—among the levels of giving, F(2, 68) = 5.56, p < .01. Further investigation utilizing a post-hoc Tukey shows that those who gave 1% or less (M = 3.75; SD = 1.17) were significantly less likely to agree with this statement than those who gave 2% to 9% (M = 4.52; SD = 0.51).
Furthermore, there were also noteworthy differences in agreement with the third measure of bridging SC—“I have become friends with people in the church I would otherwise not have met” among the levels of giving, F(2, 68) = 5.18, p < .01. Further investigation utilizing a post-hoc Tukey shows that those who gave 1% or less (M = 3.75; SD = 1.34) were significantly less likely to agree with this statement than those who gave 2% to 9% (M = 4.60; SD = 0.57). Thus, the percentage of income given to the church was also significantly related to all 3 bridging sub-construct measures of SC.
Discussion - Church Involvement
activities, they would still indicate only weekly attendance with no night activity. Thus, a different measurement is needed for levels of church activity.
Financial Giving and Social Capital
The significant correlation of financial giving with SC suggests that financial giving has a unique and clear relationship to SC. Thus, the current study affirms the findings of previous researchers that financial giving and SC are related. This does not prove causation, but adds to the understanding of this complex relationship.
Trust: The only significant change in RSC that was related to increased frequency of giving was trust in one’s self. As more-or-less a measure of self-confidence, trust in one’s self seems logically less likely to contribute to the community bonds that SC is said to create. The current study confirms this. So, while an increased percentage of income given was significantly related to increased trust in God and bonding with others in the church, an increase in the behavior of giving was significantly related only to an increase in trust in one’s self. This suggests that either a) a higher percentage of giving requires more trust in God and bonds with the church community, or b) increased trust in God and bonds with the church community enable or motivate an individual to give more. It is possible that this trust makes an individual more confident that the money given will be put to good use. This higher percentage of giving is also more economically beneficial for churches than frequent smaller giving.
These RSC measures of trust in God and bonding with the church community also relate to the definition of faith as one of trust and bonding with other Christians and identification with others and with God (Davis 1987; Showers et al. 2011). The sharing of religious values noted by Showers et al. (2011) cannot happen without the trust measured in the current study. Thus, it is possible that the creation of this trust among attendees in a church can increase levels of financial giving. The trust in God measured in the current study also has important implications given the finding from Barna Group that Millennials are attracted to churches that provide this personal connection with God that results in trust in God. This suggests that trust in God is a particularly powerful motivator for this age group.
The giving that results from—or is impacted by—trust only in one’s self may allow for more consistent giving, but this is done at lower percentages. It is possible that this measurement of trust in one’s self is more related to appearances of consistent giving, as individuals wants others—and themselves—to see that they are giving regardless of the level of this giving. This type of giving would not be as financially beneficial to the church, as it is at a lower percentage level. It would also not be as beneficial to community development, as it requires no trust or bridging with others in the church.
Conclusion
The current research had a limited focus and sample, but provides important information on the relationship between church financial giving by individuals and RSC. It achieves the intended purpose of identifying possible motivations for financial giving. It also extends the understanding of SC by looking at a specific religious definition for observation and measurement, calls for a rethinking of measurements of church activity, and extends the understanding of the church financial giving by analyzing both frequency of giving and percentage of income.
Fostering an environment of trust in any organization can take time and may be marked by serious challenges. The current research shows that the type of trust fostered in churches is important. Rather than merely focusing on trust as a general concept, it is important to make note of the subtle distinctions between internal and external trust. Internally directed self-trust was not related to increased giving percentages in this study, making it essential for increased giving that the environment of trust in churches be purposefully oriented to relationships—with others and with God. Literature in this area tends to provide for general measures of trust, which cannot account for these important distinctions.
The research also shows that there was a similar positive relationship between percentage of giving and both trust in God and closeness to the congregation. This provides important insight into the possible relationship between these two measures of externally oriented trust. In the context of a church, it is reasonable to assume that trust in God and trust in others are related and impact each other. If an individual trusts in, and bonds with, others in the context of a religious environment where God is often discussed, these human bonds are likely to foster a religious connection to some degree that may increase trust in God. In addition, trust in God is likely to increase a shared religious identification among individuals, which increases trust in each other.
This study has other important implications for churches, as it suggests that some of the very ideals that distinguish churches from other organizations—trust in God and increased bonding with others—also have positive relationships with their economic stability. These ideals were measured as elements of social capital and connected to financial giving in the current study. The findings shed empirical light on community development and interdependency within churches, as they suggest that trust and bonding have a reciprocal relationship with the amount of giving rather than the mere appearance of giving.
The motivation to give outlined in the current study is especially important given the increased worry about the decline in church attendance—especially among younger people in America (Barna Group 2013). This decline has significant potential economic impacts for churches. By distinguishing between the frequency of giving and the percentage of giving, the findings of the current study suggest that trust in God and bonds with others are more relevant motivators for an increased percentage of giving than trust in one’s self. The emphasis on others is an important distinguishing factor of churches, and this study shows that it is also an important factor in their economic stability.
might be correlated with things like isolation from the larger community. Further exploration of the question of causation for financial giving and SC will deepen understanding of the possible direction of such an effect, as well as its context-specific factors. It is also important to further develop the conceptualization of trust with SC measurements to determine if self-trust is a valid indicator of overall SC.
Appendix A
Adapted Williams Religious Social Capital Index
Trust
Being in the church:
1. builds up my sense of trust in God 2. builds up my sense of trust in myself 3. builds up my sense of trust in other people
Bonding
4. Being in the church helps me to make friends 5. I feel close to the church clergy
6. I feel close to the church congregation
Bridging
7. Being in the church helps me to meet new people
8. Being in the church helps me to contribute to community life
9. I have become friends with people in the church I would otherwise not have met
Linking
10. Being in the church helps me to establish my place in the community 11. I have met important people through my involvement in the church
12. I have met different community leaders through my involvement in the church
Note. Adapted from “Measuring religious social capital: The scale properties of the Williams Religious Social Capital Index (WRSCI) among cathedral congregations,” by Williams, E, 2008, Journal of Beliefs & Values, 29, pp. 327-332. Copyright 2008 by Taylor & Francis.
Appendix B
Adapted Index of Attendance and Giving
1. If not prevented by unavoidable circumstances, I attend church: (More than once a week to Twice a year or less)
2. How would you rate your activity in your congregation? (Very active to Inactive) 3. How often have you taken Holy Communion (The Lord’s Supper, The Eucharist)
during the past year?
4. During the last year, how many Sundays per month on the average have you gone to a worship service? (Non to Three or more)
5. How often do you spend evenings at church meetings or in church work?
6. During the last year, how many Sundays per month on the average have you gone to a worship service? (None to Three or more)
8. Church activities (meetings, committee work, etc.) are a major source of satisfaction in my life
9. During the last year, how often have you made contributions to the church in addition to the general budget and Sunday School? (Regularly to Never)
10.I make financial contributions to the Church: (In regular, planned amounts to Seldom or never)
11.Last year, approximately what percent of your income was contributed to the church? (1% or less to 10% or more)
12.During the last year, what was the average monthly contribution of your family to your local congregation? (Under $5 to $50 or more)
Note. Adapted from “Measuring the religious variable: National replication,” by King, M.B., & Hunt, R.A., 1975, Journal for the Scientific Study of Religion, 14, 13. Copyright 1975 by JSTOR.
Bibliography
Barna Group. (2013). 5 Reasons Millennials Stay Connected to Church - Barna Group.
Retrieved April 26, 2016 from
Burt, R. S. (1992). Structural holes: The social structure of competition (1st ed.). Cambridge, MA: Harvard University Press.
Carpiano, R. M. (2006). Toward a neighborhood resource-based theory of social capital for health: Can Bourdieu and sociology help? Social Science & Medicine, 62(1), 165– 175. Retrieved April 26, 2016 from
Coleman, J. S. (1988). Social capital in the creation of human capital. Journal of Sociology,
94 (Supplement: Organizations and Institutions: Sociological and Economic Approaches to the Analysis of Social Structure), S95–S120.
___________. (1990). Foundations of social theory. Cambridge, MA: Belknap Press of Harvard University Press.
Connected to Give. (2013). Connected to Give: Faith Communities. Retrieved April 26,
2016 from
Dahl, G. B., & Ransom, M. R. (2002). The 10% flat tax: Tithing and the definition of income. Economic Inquiry, 40(1), 120–137. Retrieved April 26, 2016 from
Davis, G. B. (1987). Are Christians supposed to tithe? Criswell Theological Review, 2(1), 85–97.
Forbes, K., & Zampelli, E. (2013). The impacts of religion, political ideology, and social capital on religious and secular giving: Evidence from the 2006 Social Capital Community Survey. Applied Economics, 45(17), 2481–2490. Retrieved April 26,
2016 from
Institutional Research, Special Issue: Assessing Character Outcomes in College (122), 93-103.
James, R. N., & Jones, K. S. (2011). Tithing and religious charitable giving in America.
Applied Economics, 43(19), 2441–2450. Retrieved April 26, 2016 from
King, M., & Hunt, R. (1975). Measuring the religious variable: National replication.
Journal for the Scientific Study of Religion, 14(1), 13–22. Retrieved April 26, 2016
from
Nahapiet, J., & Ghoshal, S. (1998). Social capital, intellectual capital, and the organizational advantage. Academy of Management Review, 23(2), 242–266.
Retrieved April 26, 2016 from
Portes, A. (1998). Social capital: Its origins and applications in modern society. Annual Review of Sociology, 24, 1–24.
Prins, E., & Ewert, D. M. (2002). Cooperative extension and faith-based organizations: Building social capital. Journal of Extension, 40.
Putnam, R. (1995). Tuning in, tuning out: The strange disappearance of social capital in America. PS: Political Science & Politics, 28(04), 664–683. Retrieved April 26, 2016
from
___________. (1998). Forward. Housing Policy Debate, 9(1). v-viii.
___________. (2000). Bowling alone: The collapse and revival of American community. NY: Simon & Schuster.
Showers, V. E., Showers, L. S., Beggs, J. M., & Cox Jr, J. E. (2011). Charitable Giving Expenditures and the Faith Factor. American Journal of Economics and Sociology,
70(1), 152–186. Retrieved April 26, 2016 from
The ARDA. (2010a). Evangelical Protestant Denominations. Retrieved from
_________. (2010b). Mainline Protestant Denominations: Listing. Retrieved April 26, 2016
from
The Center on Philanthropy at Indiana University, & American Express. (2007).
American Express Charitable Gift Survey. Retrieved April 26, 2016 from
Verba, S., Brady, H., & Schlozman, K. (1995). Voice and equality: Civic voluntarism in American politics. USA: Harvard University Press.
Williams, E. (2008). Measuring religious social capital: The scale properties of the Williams Religious Social Capital Index (WRSCI) among cathedral congregations.
Journal of Beliefs & Values, 29(3), 327–332. Retrieved April 26, 2016 from
Wuthnow, R. (2002). Religious involvement and status-bridging social capital. Journal for the Scientific Study of Religion, 41(4), 669–684. Retrieved April 26, 2016 from
Yörük, B. (2013). The impact of charitable subsidies on religious giving and attendance: Evidence from panel data. Review of Economics and Statistics, 95(5), 1708–1721.