Modeling of flexible wheat straw by discrete element method and
its parameter calibration
Fanyi Liu
,
Jian Zhang
,
Jun Chen
*(College of Mechanical and Electronic Engineering, Northwest A&F University, Yangling 712100, Shaanxi, China)
Abstract: To simulate the bending behavior of wheat straw, a flexible straw model was developed based on the Hertz-Mindlin with bonding model using discrete element method. The proposed model was constructed by bonding straw units (filled by multi-spherical method) through parallel bonding keys. By means of a three-point bending test, single-factor sensitivity analysis and calibration of bonding parameters were performed. Results showed that elastic modulus of the flexible straw enhanced with the increase of bonded disk radius, normal stiffness per unit area and shear stiffness per unit area. The three bonding parameters were respectively calibrated to be 2.11 mm, 9.48×10⁹ N/m3 and 4.67×10⁹ N/m3 by solving the regression equation developed from Box-Behnken design. The simulated elastic modulus (in terms of those three calibrated parameters) exhibited 4.20% difference with the measured one. It proved that the flexible straw could accurately demonstrate bending property of the wheat straw. This would not only help to improve accuracy in simulating wheat straw, but also provide references for flexible straw modeling and parameters calibration of other crops.
Keywords: DEM, flexible straw, three-point bending test, bonding parameters, sensitivity analysis, parameters calibration
DOI: 10.25165/j.ijabe.20181103.3381
Citation: Liu F Y, Zhang J, Chen J. Modeling of flexible wheat straw by discrete element method and its parameters calibration. Int J Agric & Biol Eng, 2018; 11(3): 42–46.
1 Introduction
The discrete element method (DEM), developed by Cundall and Strack in 1979, is an explicit numerical procedure in which particle-particle/wall interactions are calculated contact by contact. With the development of computer technology, DEM has been regarded as a powerful tool to simulate the dynamic behavior of granular materials in agricultural engineering, such as seeding[1-4], tillage[5-7] and grain drying[8-10].
In recent years, research has been conducted to investigate straw-particle/equipment interactions by DEM, which facilitates the design and optimization of agricultural equipment. In order to optimize the cutting device of a combine harvester, Kattenstroth et al.[11] simulated the alignment of straw by DEM. Using the combination of computational fluid dynamic and discrete element method (CFD-DEM), separation of grains and straw in airflow was studied[12-15]. Farman[16] investigated the interaction of straw-soil-disc tool under controlled conditions by DEM, and verified the disc tool’s working performances under different tilling depths and velocities. Ma et al.[17] carried out a DEM investigation of grain-straw separation under horizontal rotational oscillations, and found that both amplitude and frequency showed significant effects. Li et al.[18] studied the separation of threshed rice mixture (rice grains, shriveled grains and straw) on a planar vibration screening device, and found that the velocity of shriveled grains and the vibration parameters could be well represented by a
Received date: 2017-03-29 Accepted date: 2018-03-22
Biographies: Fanyi Liu, PhD candidate, research interests: intelligent agricultural equipment and its numerical simulation, Email: liufanyi@ nwsuaf.edu.cn; Jian Zhang, MS candidate, research interests: screening device and its numerical simulation, [email protected].
*Corresponding author: Jun Chen, PhD, Professor, research interests: intelligent agricultural equipment, vehicle roadworthiness testing, Northwest A&F University, Yangling, Shaanxi 712100, China. Tel: +86-29-87091867, Email: [email protected].
fitting equation.
However, the straw models in all simulations mentioned above were constructed by multi-spherical method[19], and could not simulate deformation behaviors of straw since all primitive elements (spheres) were mutually connected in a rigid way. To overcome the lack of deformation, Lenaerts et al.[20] constructed a segmented bendable straw model with hollow cylinders and spherical joints, and then calibrated its physical properties. Based on aggregate of particles, Liu et al.[21] developed a flexible straw model which could bend and break at nodes.
In this research, a flexible wheat straw model was developed based on the Hertz-Mindlin with bonding model and its bonding parameters were investigated. Comprising straw units bonded through parallel bonding keys, the flexible straw allowed normal and tangential displacements. Therefore, it could simultaneously simulate multiple deformation behaviors (such as bending, stretch and twist). Since the aspect ratio of wheat straw was large, bending deformation would easily occur and was regarded as an important property in straw-particle/tool interactions, such as straw-grain separation[20] and straw-reel interaction[22,23]. In this research, the bending behavior was modeled and the model parameters were studied. The objectives of this study were to:
1) Propose an approach to construct a flexible wheat straw model by DEM and provide references for other crops;
2) Evaluate the effects of bonding parameters on the elastic modulus;
3) Calibrate the bonding parameters according to the bending property of real wheat straw.
2 Materials and methods
2.1 Modeling of flexible wheat straw
the straw units (section 2.1.3). 2.1.1 Wheat straw specimens
The dough stage wheat straw (Xi Nong 223) used in this work was provided by the Wheat Breeding Center of Northwest A&F University. The moisture content of these straw specimens was 58.86% with an average mass per unit length of 1.67×10⁻⁶ kg/mm, an average external diameter of 4.34 mm and an average wall thickness of 0.42 mm.
2.1.2 Unit of flexible straw model
In order to speed up calculations, a two-layer straw unit (Figure 1) was created by multi-spherical method instead of bonding all spherical elements since the Hertz-Mindlin with bonding model had a low computational efficiency. The multi-spherical method was possible to create a clump of spheres, which overlapped to form a desired shape. The spherical elements were connected in a rigid way and contacts within the clump were skipped during calculations, which could speed up simulations[19]. Moreover, the straw wall was thin, thus simulations would be time-consuming if the wall was filled according to its actual thickness. In this research, the wall thickness was enlarged. Considering shape features of the wheat straw and computation intensity, a hollow cylinder template (external diameter: 4.34 mm, inner diameter: 2.34 mm, height: 1.50 mm) was used. The straw unit was uniformly filled with 16 spheres (2 mm in diameter) in its radial direction for each layer using EDEM 2.7 software (DEM Solutions Ltd., Edinburgh, UK).
a. Distribution of spheres in radial direction
b. Distribution of spheres in height direction Figure 1 Schematic of the straw unit
2.1.3 Flexible straw model
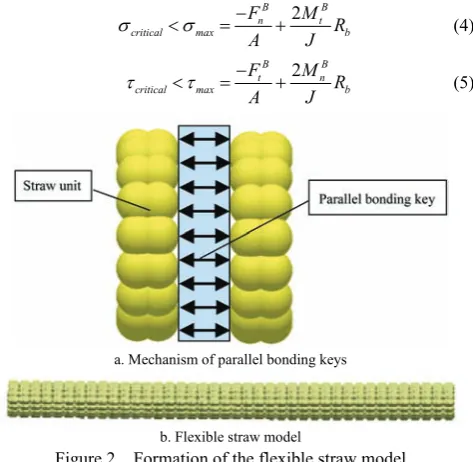
When modeling the flexible straw, 54 straw units were arrayed along their axes by the application programming interface (API) of EDEM software and then bonded by using the Hertz-Mindlin with bonding model (Figure 2). With this contact model, bonding forces and moments between two straw units were added to the standard Hertz-Mindlin contact law through parallel bonding keys and could be calculated through Equation (1)[24]:
B rel n n nb
B rel t t tb
B rel n n nb
B rel t t tb
F v k A t
F v k A t
M k J t
M k J t
ω ω
⎧ Δ = − Δ
⎪ Δ = − Δ
⎪ ⎨
Δ = − Δ
⎪
⎪Δ = − Δ
⎩
(1)
where, rel/ rel n t
v v and rel/ rel n t
ω ω are the relative velocities and angular velocities (the subscripts n and t respectively denote the normal and tangential directions); Δt is the time step; knb and ktbare
the normal and shear stiffnesses per unit area; the area and polar moment of inertia of the bonding key’s cross section (A and J) are related to the bonded disk radius Rb and can be calculated as Equation (2) and (3):
2 b
A=
π
R(2)
4
1
2 b
J=
π
R(3)
In addition, the flexible straw would be broken when the maximum normal or tangential bonding stresses (σmax, τmax) exceeded their critical values (σcritical, τcritical):
2
B B
n t
critical max b
F M
R
A J
−
< = +
σ
σ
(4)2
B B
t n
critical max b
F M
R
A J
−
< = +
τ
τ
(5)
a. Mechanism of parallel bonding keys
b. Flexible straw model
Figure 2 Formation of the flexible straw model
2.2 Three-point bending test
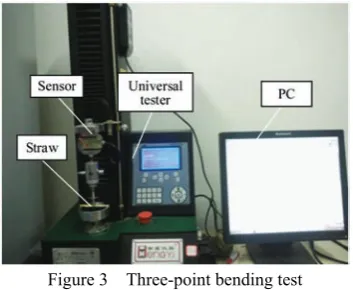
For crop straw, most researchers used three-point bending tests to study on its bending property[25-27]. In this research, a three-point bending test was carried out and elastic modulus of the wheat straw was calculated. The straw had a length of 81 mm and its two ends were placed on steel supports with contact lengths of 5 mm, as shown in Figure 3. The straw was loaded at its center using a universal tester (HengYi Precise Instrument co., Ltd., Shanghai, China). The loading was performed through a cylinder indenter (diameter: 8 mm) at a speed of 10 mm/min. According to force-displacement curves measured in this test, the elastic modulus Eb could be calculated according to Equation (6)[28]:
3
48
b
FL E
SI
=
(6)
where, F is the loading force, N; L is the distance between the two supporters (also known as gauge length), mm; S is the straw deflection (deformation), mm; I is the inertia moment of the cross-section to its neutral axis, mm4. Since the cross-section of wheat straw can be approximated as an annulus, the inertia moment I can be written as:
(
)
44
π
2 64
I= ⎡⎣D − D− t ⎤⎦
(7)
differences of biologic materials.
Figure 3 Three-point bending test
2.3 Sensitivity analysis of bonding parameters
To study the effect of bonding parameters on elastic modulus, the three-point bending test was simulated, as shown in Figure 4. Settings in all simulations were the same as those in the test, except bonding parameters. Time steps were set as 6×10⁻⁸ s and cell grids were 3 times as the radius of the spherical element for all simulations.
a. Flexible straw shown as spheres
b. Flexible straw shown as hollow cylinder Figure 4 Simulated three-point bending test
The simulation parameters of the Hertz-Mindlin with bonding model were divided into 3 classes: material, interaction and bonding parameters. As the straw wall was enlarged, the straw density (density of the spherical element which made up the straw unit) was recalculated according to Equation (8):
ml v
=
ρ
(8)
where, m is the average mass per unit length (measured in section 2.1.1), kg/mm; l is the length of the straw unit, mm; v is the volume of the straw unit which can be calculated automatically by EDEM software, m3.
In this work, the density was calculated to be 215 kg/m3. Except density, the material and interaction parameters were in accordance with those used by Li et al.[12], as shown in Table 1.
The bonding parameters of the Hertz-Mindlin with bonding model include: bonded disk radius, normal stiffness per unit area, shear stiffness per unit area, critical normal stress and critical shear stress. Since deflections of all straw were small and no breakage happened, only the bonded disk radius, normal and shear stiffnesses per unit area were analyzed. Meanwhile, the critical normal and shear stresses were respectively set as 0.05 GPa and 0.025 GPa in order to make sure that the straw model would not be broken. Design of single-factor sensitivity analysis for the three bonding parameters is listed in Table 2.
Table 1 Lists of the simulation parameters
Item Simulation parameters Values
Material parameters
Density of steel/kg·m-3 7800
Density of straw/kg·m-3 215
Poisson’s ratio of steel 0.3 Poisson’s ratio of straw 0.4 Shear modulus of steel/GPa 10 Shear modulus of straw/GPa 0.001 Interaction
parameters
Straw-steel restitution coefficient 0.2 Straw-steel static friction coefficient 0.8 Straw-steel rolling friction coefficient 0.01
Table 2 Design of the single-factor sensitivity analysis
No. Factors Levels Conditions
1-5 Bonded disk radius Rb/mm 1, 2.5, 5, 7.5, 10 knb=108, ktb=108 6-10 Normal stiffness per unit area
knb/(N·m-3) 10
6, 107, 108, 109, 1010 R
b=5, ktb=108 11-15 Shear stiffness per unit area
ktb/(N·m-3) 10
6, 107, 108, 109, 1010 R
b=5, knb=108
2.4 Calibration of bonding parameters
To calibrate the three bonding parameters, a Box-Behnken design (BBD) was used to determine simulations of the three-point bending test. As shown in Table 3, there were three levels for each bonding parameter, coded as high (+1), middle (0) and low (–1). Based on the simulation results, a quadratic regression model describing the relationship between the elastic modulus and bonding parameters was developed, as shown follows[29]:
3 3 2 3
2 0
1 1 1 1
i i ii i ij i j
i i i j i
Y β βX β X β X X
= = = = +
= +
∑
+∑
+∑ ∑
(9)where, Y is the response value (elastic modulus Eb); β0 is the constant term; βi, βii and βij respectively represent the coefficients of linear, interaction and quadratic terms; Xi and Xj are the independent variables.
Finally, the optimal combination of bonding parameters which made the simulated elastic modulus closest to the experimental one could be determined by solving the regression equation. Design Expert 7.0 software (State-Ease, Inc., MN, USA) was used in test design and data processing.
Table 3 Levels of factors for the BBD
Factors
Coded levels
Low (–1) Middle (0) High (+1)
Rb/mm 1 5.5 10
knb/N·m-3 106 5×10⁹ 1010
ktb/N·m-3 106 5×10⁹ 1010
3 Results and discussion
3.1 Elastic modulus of wheat straw
Based on the force-deformation curves measured in the three-point bending test, the real straw’s elastic modulus was calculated to be 1.9363 GPa with a standard deviation of 0.7615 GPa. The elastic modulus calculated in this research was close to those in literatures[28,30,31]. The large standard deviation was attributed to the large individual differences between the test specimens.
3.2 Effect of bonding parameters on elastic modulus
stiffness per unit area, which implied that the elastic modulus was sensitive to all three bonding parameters.
From Figure 5a, the elastic modulus was found to enhance with the increase of bonded disk radius. Specifically, with the bonded disk radius rising from 1 mm to 10 mm, the elastic modulus increased from 0.0107 GPa to 0.6912 GPa. Figure 5b and Figure 5c show how the elastic modulus varies with the normal and shear stiffnesses per unit area plotted on logarithmic scales, respectively. With the normal stiffness per unit area (Figure 5b), the elastic
modulus increased slowly (106<knb<108 N/m3), and then had a sharp enhancement (108<knb<1010 N/m3). The elastic modulus with shear stiffness per unit area followed the trend for the one with normal stiffness per unit area (the critical point also located at 108 N/m3). Differently, the elastic modulus with normal stiffness per unit area (0.0819-4.6593 GPa) varied more largely than that with shear stiffness per unit area (0.1848-3.1294 GPa). This indicated that the normal stiffness per unit area had a larger effect on the elastic modulus.
a. bonded disk radius b. Normal stiffness per unit area c. Shear stiffness per unit area Figure 5 Changes of the elastic modulus with the bonding parameters
3.3 Parameters calibration
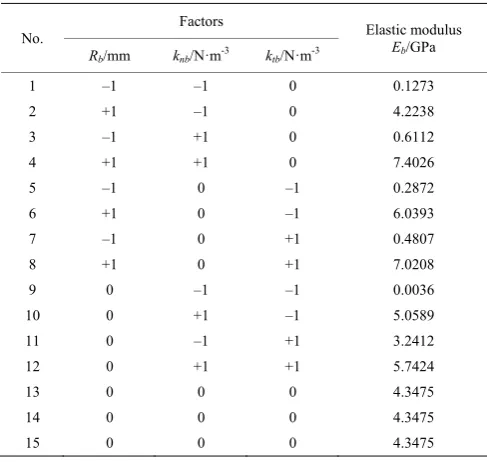
Table 4 lists the design matrix and results of the BBD. Since ratio of the maximum to minimum elastic modulus was far larger than 10 (1950.22>>10), a square root transformation was performed. The final quadratic regression model was written as Equation (10):
2
2 0.1271 0.2754 1.6441E-10 1.1706E-10
4.5068E-12 1.0739E-12 0.0125
b b nb nb
b nb b tb b
E R k k
R k R k R
+ = + + +
+ + −
(10)
Table 4 Design matrix and results of the BBD
No.
Factors Elastic modulus
Eb/GPa
Rb/mm knb/N·m-3 ktb/N·m-3
1 –1 –1 0 0.1273
2 +1 –1 0 4.2238
3 –1 +1 0 0.6112
4 +1 +1 0 7.4026
5 –1 0 –1 0.2872
6 +1 0 –1 6.0393
7 –1 0 +1 0.4807
8 +1 0 +1 7.0208
9 0 –1 –1 0.0036
10 0 +1 –1 5.0589
11 0 –1 +1 3.2412
12 0 +1 +1 5.7424
13 0 0 0 4.3475
14 0 0 0 4.3475
15 0 0 0 4.3475
Table 5 shows the results of analysis of variance (ANOVA) of the regression model. It was found that p-value of the regression model was 0.0067 (p<0.01), indicating that the model was significant when used to describe the relationship between the bonding parameters and elastic modulus. No p-value of the lack-of-fit was given because pure error caused by three-time repetition of the central points (No.13-15 in Table 4) was zero. The coefficient of determination (R2) assess the goodness-of-fit,
and a value close to 1 is desired. The R2 in this study was 0.9561, indicating that the regression model could match the BBD results well. Moreover, the Adeq Precision was 11.1700 (Adeq Precision measures the signal-noise ratio and a value greater than 4 is commonly required), which further showed the regression model had a good precision and could be used to navigate the design space.
Table 5 ANOVA of quadratic polynomial model
Soruce of variation Sum of squares Freedom Mean square p-value
Model 6.3442 9 0.7049 0.0067*
Rb 4.4807 1 4.4807 0.0003*
knb 0.9924 1 0.9924 0.0091*
ktb 0.2643 1 0.2643 0.0864
Rbknb 0.0411 1 0.0411 0.4391
Rbktb 0.0023 1 0.0023 0.8492
knbktb 0.2127 1 0.2127 0.1142
2 b
R 0.2347 1 0.2347 0.1010
2 nb
k 0.1216 1 0.1216 0.2081
2 tb
k 0.0378 1 0.0378 0.4572
Residual 0.2912 5 0.0582
Lack of fit 0.2912 3 0.0971
Pure error 0 2 0
Sum 6.6354 14
R2=0.9561; Adeq Precision=11.1700
Note: * shows the significant at p<0.01.
By solving the regression model from initial design points, the optimal bonding parameters combination was determined. Specifically, when the material and interaction parameters were the same as those shown in Table 1, the three bonding parameters making the simulated elastic modulus closed to the measured one were:
1) 2.11 mm for the bonded disk radius;
2) 9.48×10⁹ N/m3 for the normal stiffness per unit area; 3) 4.67×10⁹ N/m3 for the shear stiffness per unit area.
optimal parameters combination. The elastic modulus calculated from this simulation was 1.8548 GPa, relatively close to the value measured in the experiment (1.9363 GPa). The small difference (4.20%) between the simulated and measured elastic modulus showed that the regression model could well predict the elastic modulus. Meanwhile, the model could well simulate the bending property of the wheat straw.
4 Conclusions
In this research, a flexible wheat straw model was proposed based on the Hertz-Mindlin with bonding model by DEM. The proposed flexible straw could bear normal and tangential displacements, which allowed simulating deformation properties of crop straw.
The single-factor sensitivity analysis showed that the elastic modulus increased with the three bonding parameters. The calibration and validation of parameters indicated that when using the optimal bonding parameters combination (bonded disk radius: 2.11 mm, normal stiffness per unit area: 9.48×10⁹ N/m3 and shear stiffness per unit area: 4.67×10⁹ N/m3), the simulated elastic modulus was 1.8548 GPa. This was close to the measured value (1.9363 GPa) with a relative error of 4.20%, indicating that the regression model could accurately predict the elastic modulus.
The flexible wheat straw proposed in this research could be applied in DEM models to simulate straw-particle/equipment interactions, and the modeling and parameters calibration methods could also be used for other crops. In future work, stretch, twist and break behaviors would be studied besides bending according to practical operating conditions.
Acknowledgements
This research was financially supported by Research Fund for the Doctoral Program of Higher Education of China (Grant No. 20130204110020).
[References]
[1] Li Z Q, Yu J Q, Zhang W L, Fu H. Simulation analysis of working process and performance of inside-filling seed metering device by discrete element method. Transactions of the CSAE, 2011; 27(11): 32–36. [2] Qiu B J, Jiang G W, Yang N, Guan X P, Xie J J, Li Y M. Discrete
element method analysis of impact action between rice particles and impact-board. Transactions of the CSAE, 2012; 28(3): 44–49. (in Chinese) [3] Lu F Y, Ma X, Qi L, Tan S Y, Tan Y X, Jiang L K, et al. Parameter
optimization and experiment of vibration seed-uniforming device for hybrid rice based on discrete element method. Transactions of the CSAE, 2016; 32(10): 17–25. (in Chinese)
[4] Wang J W, Tang H, Wang J F, Li X, Huang H N. Optimization design and experiment on ripple surface type pickup finger of precision maize seed metering device. Int J Agric & Biol Eng, 2017; 10(1): 61–71. [5] Chen Y, Munkholm L J, Nyord T. A discrete element model for
soil–sweep interaction in three different soils. Soil & Tillage Research, 2013; 126: 34–41.
[6] Li B, Liu F Y, Mu J Y, Chen J, Han W T. Distinct element method analysis and field experiment of soil resistance applied on the subsoiler. Int J Agric & Biol Eng, 2014; 7(1): 54–59.
[7] Li B, Xia R, Liu F Y, Chen J, Han W T, Han B. Determination of the draft force for different subsoiler points using discrete element method. Int J Agric & Biol Eng, 2016; 9(3): 81–87.
[8] Khatchatourian O A, Binelo M O, de Lima R F. Simulation of soya bean flow in mixed-flow dryers using DEM. Biosyst Eng, 2014; 123: 68–76. [9] Iroba K L, Mellmann J, Weigler F, Metzger T, Tsotsas E. Particle
velocity profiles and residence time distribution in mixed-flow grain dryers. Granul Matter, 2011; 13(2): 159–68.
[10] Weigler F, Mellmann J. Investigation of grain mass flow in a mixed flow dryer. Particuology, 2014; 12(1): 33–9.
[11] Kattenstroth R, Harms H H, Lang T. Alignment of straw to optimize the cutting process in a combine’s straw chopper. Landtechnik, 2011; 66(5): 354–357.
[12] Li H C, Li Y M, Gao F, Zhao Z, Xu L Z. CFD–DEM simulation of material motion in air-and-screen cleaning device. Comput Electron Agric, 2012; 88: 111–119.
[13] Ueka Y, Matsui M, Inoue E, Mitsuoka M, Okayasu T. Shape model of grain and straw using coupling elements and flight simulation of threshing unit of combine by discrete element method. Engineering in Agriculture Environment & Food, 2014; 7(1): 34–39.
[14] Jiang E C, Sun Z F, Pan Z Y, Wang L J. Numerical simulation based on CFD-DEM and experiment of grain moving laws in inertia separation chamber. Transactions of the CSAM, 2014; 45(4): 117–122. (in Chinese) [15] Wang L J, Li Y, Liang C, Ma J Q, Zhou W X. Motion law of maize
mixture in cross air-and-screen cleaning device. Transactions of the CSAM, 2015; 46(9): 122–127. (in Chinese)
[16] Farman A C. Interaction of straw-soli-disk tool under controlled conditions. PhD dissertation. Nanjing: Nanjing Agricultural University, 2013.
[17] Ma X D, Zhang Y B, Liu Y, Zheng X W. Simulation of grain segregation under horizontal rotational oscillations. Granul Matter, 2016; 18(1): 1–6.
[18] Li H, Wang J S, Yuan J B, Yin W Q, Wang Z M, Qian Y Z. Analysis of threshed rice mixture separation through vibration screen using discrete element method. Int J Agric & Biol Eng, 2017; 10(6): 231–239. [19] Favier J F, Abbaspour-Fard M H, Kremmer M. Modeling nonspherical
particles using multisphere discrete elements. Journal of Engineering Mechanics, 2001; 127(10): 971–977.
[20] Lenaerts B, Aertsen T, Tijskens E, Ketelaere B D, Ramon H, Baerdemaeker J D, et al. Simulation of grain–straw separation by discrete element modeling with bendable straw particles. Comput Electron Agric, 2014; 101(7441): 24–33.
[21] Liu L. The research on modeling method of wheat plants and implementation of threshing simulation software. MS dissertation. Jilin: Jilin University, 2014. (in Chinese)
[22] Hirai Y, Inoue E, Mori K, Hashiguchi K. Investigation of Mechanical Interaction between a Combine Harvester Reel and Crop Stalks-. Biosystems Engineering, 2002; 83(3): 307–317.
[23] Oduori M F, Mbuya T O, Sakai J, Inoue E. Modeling of crop stem deflection in the context of combine harvester reel design and operation. Agricultural Engineering International Cigr Journal, 2012; 14(2): 21–28. [24] Potyondy D O, Cundall P A. A bonded-particle model for rock.
International Journal of Rock Mechanics & Mining Sciences, 2004; 41(8): 1329–1364.
[25] Annoussamy M, Richard G, Recous S, Guérif J. Change in mechanical properties of wheat straw due to decomposition and moisture. Applied Engineering in Agriculture, 2000; 16(6): 657–664.
[26] Wright C T, Pryfogle P A, Stevens N A, Steffler E D, Hess J R, Ulrich T H. Biomechanics of Wheat/Barley Straw and Corn Stover. Applied Biochemistry and Biotechnology, 2005; 124(1): 5–19.
[27] Guo Y M, Yuan H M, Yin Y, Liang L, Li H. Biomechanical evaluation and grey relational analysis of lodging resistance of straw crops. Transactions of the CSAE, 2007; 23(7): 14–18. (in Chinese)
[28] Li H B. Experimental study of the mechanical properties of wheat stems. M. S. dissertation. Taiyuan: Taiyuan University of Technology, 2005. (in Chinese)
[29] Wu M, Liu Y, Wang L J, Li D, Mao Z H. Effects of extrusion parameters on physicochemical properties of flaxseed snack and process optimization. Int J Agric & Biol Eng, 2015; 8(5): 121–131.
[30] Wang F E, Huang G B, Guo W J, Zhang F W, Wu J M, Zhao D J. Properties and Micro-structure of Wheat Stems. Transactions of the CSAM, 2009; 40(5): 92–95. (in Chinese)