Thermal analysis of a solar air heater for drying purposes
Z.Deniz ALTA
1, Nuri ÇAĞLAYAN
2*,Mehmet Akif EZAN
3, Can ERTEKİN
1(1. Department of Farm Machinery, Faculty of Agriculture, Akdeniz University, 07058 Antalya – Turkey;
2. Technical Sciences of Vocational Training School, Akdeniz University, 07058 Antalya – Turkey;
3.Department of Mechanical Engineering, Dokuz Eylül University, Buca,35397Izmir – Turkey. )
Abstract: In this study, energetic efficiency of a solar air heater with aluminum flat plate absorber was examined experimentally for airflow velocity of 2, 3 and 4 m/s. An experimental setup was built-up and experiments were compared with the results of the analysis performed by using computational fluid dynamics (CFD) software. Results were also evaluated based on thermographic camera images.
Keywords:Solar air heater, energy efficiency, absorber plate
Citation: Alta,Z. D., N.Çağlayan, M. A.Ezan, and C.Ertekin. 2015. Thermal analysis of a solar air heater for drying purposes. Agric Eng Int: CIGR Journal, Special issue 2015: 18th World Congress of CIGR: 193-199.
1 Introduction
1The solar energy collection as a renewable energy
resource has been the primary interest of many engineers
and researchers for the last two centuries due to its
widespread applications (Selmi et al., 2008). In this
context, solar air heaters are implemented in many
different practices, which require low to moderate
temperatures below 60C (Esen, 2008).They are generally
used for space heating, drying for industrial & agriculture
purposes (Gupta and Kaushik, 2008). The main
disadvantage of solar air heaters is possessing lower
thermal efficiency in consequence of inherently low heat
transfer capability between the absorber plate and air
flowing in the duct (Kumar and Saini, 2009). On the other
hand, the most important advantages for air-type solar
heaters include: no freezing, boiling or pressure problems;
generally lower weight and low construction cost (Selcuk,
1977).
Computational fluid dynamics (CFD) is used as
powerful simulation technique to observe the collector
efficiency with less time and cost consuming in recent
Received date: 2014-12-02 Accepted date:2015-01-07 *Corresponding author:Nuri ÇAĞLAYAN, Technical Sciences of Vocational Training School, Akdeniz University,07058 Antalya – Turkey. Email: [email protected].
years. Many experimental studies have been carried out
to evaluate performance of solar air heaters but very few
attempts of CFD investigation have been made so far due
to complexity of flow pattern and computational
limitations (Yadav and Bhagoria, 2013; Wang et al.,
2006).With the development of computer, hardware and
numerical methodology, applications of CFD are being
used to carry out critical investigations in the field of
solar air heaters.
The work presented in this paper aims to analyze the
heat exchange process inside the solar air heater and
evaluate the energy efficiency.
2 Material and method
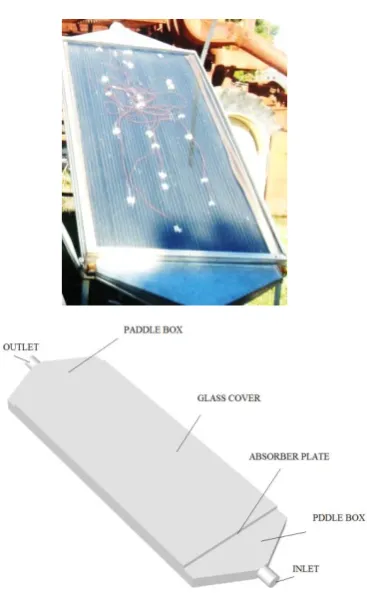
The experimental setup and schematic diagram of the
solar air heater was shown in Figure 1. In addition, the
design parameters of the heater are summarized in Table
1. A single glazing was chosen in order to maximize the
radiation impact on the absorber and reduce convective
losses. Dimensions of the air heater are1.92 x 0.82 x 0.10
m, in length, width and height, respectively. The heater
has an insulation thickness of 0.05 m onthe bottom and
lateral surfaces. The gap between the absorber plate and
194 May, 2015 Agric Eng Int: CIGR Journal Open access at http://www.cigrjournal.org Special issue 2015
absorber plate is 2 mm and its surface is painted matt
black.
Figure 1 Experimental setup and the cross section of the
solar air heater
Table1 Main properties solar air heater
Parameters Value
Absorber material Aluminum
Plate thickness 2 mm
Absorber coating Dull black paint
Glazing Single glass
(thickness 4 mm) Workingfluid in flow ducts Air
Width of the duct, W 0.82 m
Collector side wall height, he 0.1 m
Air flow duct height, D 43 mm Length of the collector, L 1.9 m Emissivity of the glass cover, εg 0.85
Emissivity of the absorber plate, εp 0.95
Emissivity of the bottom plate, εb 0.95
Tilt angle, β 35
Insulation thicknesses, tb, te 50 mm
Thermal conductivity of insulation, 0.043 W/m.K Heat transfer coefficient of aluminum, Al 210 W/m.K
Heat capacity of aluminum, cp,Al 0.90 J/g.C
In this study, inlet and outlet air temperatures of solar
air heater, ambient temperature, airflow rate, solar
radiation, pressure drop and wind velocity was measured
and all of data were recorded by a data logger. A radial
fan with a capacity of 0.41 m3/s was used for solar air
heater to provide the airflow. A controller unit was used
to adjust the fan speed and airflow rate.
Inlet and outlet air temperature, absorber plate surface
and ambient temperature were measured by using K-type
thermocouples. Wind speed was measured using a cup
anemometer (Delta-T A100 R, accuracy: 1% ±0.1 m/s).
Anemometer was placed about 1 m above the solar air
heater. A flow meter [Testo 405, accuracy: (±0.1 m/s ±5%
of m.v.) at 0-2 m/s and (±0.3 m/s ±5% of m.v.) at 2.01-10
m/s] was used to measure the inlet air velocity for the
solar air heater. The amount of global incident solar
radiation on the heater was measured using a solar sensor
(Delta-T ES2, accuracy: ±3% at 20C). The solar sensor
was placed on the glass cover of the heater. All of sensors
were connected to a data logger (Delta-T, DL2e) and the
measurements were recorded 5 min interval.
3 Results
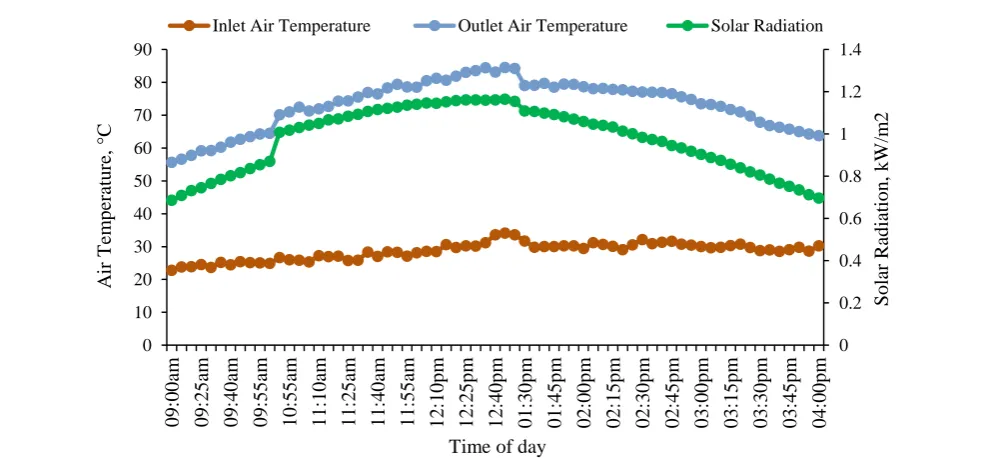
Figure 2 presents a typical day for solar radiation,
inlet and outlet air temperatures between 09.00 am and
04.00 pm. The ambient temperature was considered to be
the same as the inlet air temperature. It seems that inlet,
outlet air temperatures increase with increasing solar
The energy efficiency of the solar air heater was
calculated using Equation1:
= ṁcp(Tout− Tin)/(GTAc) (1)
Where𝑚̇is mass flow rate (kg/s), cp is specific heat of air
(J/kg.K), Tin is inlet temperature (C), Tout is outlet
temperature (C), GT is solar radiation intensity (W/m 2
)
and Ac is collector surface area (m 2
).
Figure 3 shows energy efficiency for solar air heater.
According to Equation 1, energy efficiency calculated
and it was found approximately =0.25.
3.1 CFD simulation
ANSYS Release 15.0 software was used for CFD
simulations.To gain simulation results using CFD
software, a simulation procedure has to be followed. The
procedure requires setting the boundary and volume
conditions of the simulated module. Assuming that the
collector is a simple flat plate solar air heater, boundaries
should have both convection and radiation heat transfer
mechanisms. In our system two different convection
mechanisms takes place.While natural convection occurs Figure 2 A typical experimental day for solar air heater
0 0.2 0.4 0.6 0.8 1 1.2 1.4 0 10 20 30 40 50 60 70 80 90 0 9 :0 0 am 0 9 :2 5 am 0 9 :4 0 am 0 9 :5 5 am 1 0 :5 5 am 1 1 :1 0 am 1 1 :2 5 am 1 1 :4 0 am 1 1 :5 5 am 1 2 :1 0 p m 1 2 :2 5 p m 1 2 :4 0 p m 0 1 :3 0 p m 0 1 :4 5 p m 0 2 :0 0 p m 0 2 :1 5 p m 0 2 :3 0 p m 0 2 :4 5 p m 0 3 :0 0 p m 0 3 :1 5 p m 0 3 :3 0 p m 0 3 :4 5 p m 0 4 :0 0 p m So lar R ad iatio n , k W /m 2 A ir T em p er atu re, ° C
Time of day
Inlet Air Temperature Outlet Air Temperature Solar Radiation
Figure 3 Energy efficiency of the solar air heater.
0.21 0.22 0.23 0.24 0.25 0.26 0.27 0.28 0 9 :0 0 am 1 0 :0 0 am 1 1 :3 5 am 1 2 :2 5 p m 0 1 :5 0 p m 0 2 :4 0 p m 0 3 :3 0 p m E n er g y E ff icien cy ,
196 May, 2015 Agric Eng Int: CIGR Journal Open access at http://www.cigrjournal.org Special issue 2015
in the region between glass and absorber plate there is a
mixed convection between absorber and bottom plate.
Streamlines in the solar air heater for three different
inlet air velocities are shown in Figure4. It seems that, a
circulation zone occurs near the sidewall of the collector
and the zone grows with increasing the inlet velocity of
air.
The effect of inlet air temperature on the outlet
temperature were investigated and compared with the
experimental data. The comparative data is given on
Table 2. Increasing the inlet air temperature causes an
increase on the outlet air temperature (Figure5). Table 2
also shows the maximum deviation between the predicted
and measured outlet temperature is less than 5%, which
means that the accuracy of the numerical analysis is quite
acceptable for parametric survey. Figure4 Streamlines of air in the solar air heater a) v=2 m/s, b) v=3 m/s, c) v=4 m/s
Case #1
Case #2 Case #3
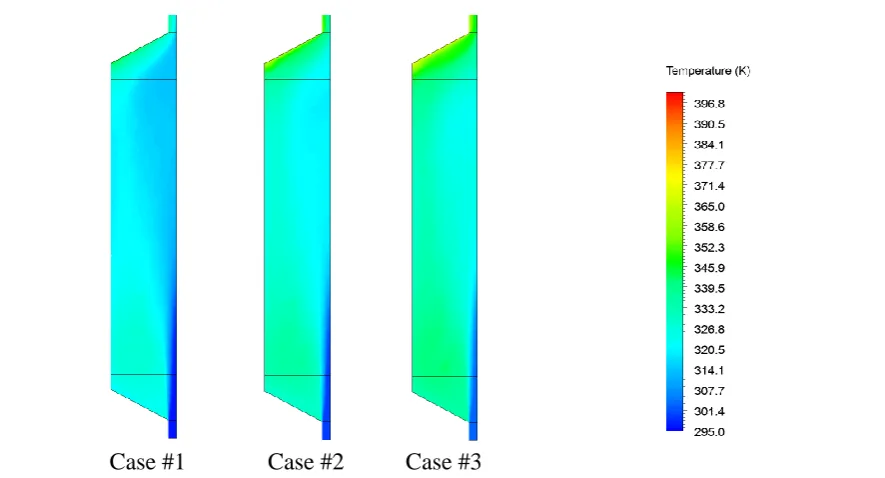
Temperature distributions of air depending on the
airflow rate are consistent with the streamlines (Figure6).
Solar air collectors can heat upthe air much more at the
lower air rates, because the air have more time to get hot
inside the heater (Alta et al., 2010). As the air velocity
increases, the air movement at the edge of the paddle box
also increases and the hot air cannot accumulate here.
These results also decrease the outlet temperature
(Table3). InFigure 7, location of the thermocouples for
experiments and the results of the thermal images were
given. Temperature values of the defined locations on the
absorber plate were also measured from the thermal
images. Experimental measurements and the temperature
values obtained from thermal images were symbolized as
P and M, respectively. Glass cover was removed before
the measurements. The results of the comparison of each
five measurements were shown in Figure 8. The
difference between the results could be caused from the
heat loss while removing the glass cover. Table 2 Comparison of the experimental and predicted data in terms of outlet air temperature
Experimental Data Predicted Data
Deviation Case Inlet Air
Temperature
Solar Radiation
Outlet Air Temperature
Outlet Air Temperature
(#) (°C) (kW/m2) (°C) (°C) (%)
#1 23.9 0.7312 57.8 55.19 -4.45
#2 26.6 1.0184 70.1 69.74 -0.5
#3 30.2 1.1296 75.8 78.19 3.1
Vin = 2 m/s Vin = 3 m/s Vin = 4 m/s
198 May, 2015 Agric Eng Int: CIGR Journal Open access at http://www.cigrjournal.org Special issue 2015
4 Conclusion
In this study, there is a good agreement between the
experimental and simulated results for outlet air
temperatures.The main conclusions drawn from the
results of the present study are given as follows:
Increasing the inlet air temperature causes an
increase in the outlet air temperature,
Since the heat transfer period increases for lower
air flow rates, the outlet temperature increases for lower
inlet velocity values,
Thermographic camera could be used to define the
temperatures of locations on the absorber plate. Table 3 Effect of inlet air velocity on the outlet air temperature
Case (#)
Inlet Air Temperature
Inlet Air Velocity
Solar Radiation
Outlet Air Temperature
(°C) (m/s) (kW/m2) (°C)
#1
30.2
2
1.1296
78.19
#2 3 64.72
#3 4 56.85
(a) (b) (c) (d)
Figure 7 The thermocouple junction placements (P1-P5) (a), thermal images at 10:00 (b), 13:00 (c) and 16:00 (d) on the absorber plate.
Figure8 Comparison of the temperatures obtained from experimental and thermal images
Time
20 40 60 80 100 120
P1 M1 P2 M2 P3 M3 P4 M4 P5 M5
10:00 52.72 52.90 40.90 53.20 52.96 55.30 46.72 50.50 47.28 47.90 13:00 111.84 96.30 106.96 86.00 101.36 86.80 91.52 81.70 86.24 77.90 16:00 49.76 52.60 52.40 55.80 55.76 52.00 45.76 50.10 44.24 45.90
T
em
p
er
atu
re
(
C)
P: Measured values from Thermocouples M: Measured values from thermographic camera
References
Alta, Z.D., E.Bilgili, C.Ertekin, and O. Yaldiz. 2010.Experimental investigation of three different solar air heaters: Energy and exergy analyses.Applied Energy, 87(10): 2953-2973. Esen, H.2008.Experimental energy and exergy analysis of a
double-flow solar air heater having different obstacles on absorber plates.Building and Environment,43 (6):1046–54.
Gupta, M.K., and S.C.Kaushik.2008. Exergy performance evaluation and parametric studies of solar air heater.Energy, 33(11):1691–702.
Kumar, S., and R.P.Saini.2009. CFD based performance analysis of a solar air heater duct provided with artificial roughness.
Renewable Energy, 34(5): 1285-1291.
Selcuk, M. K. 1977. Solar air heaters and their applications. Solar energy engineering (A78-27852 10-44):155–82. New York: Academic Press Inc.
Selmi, M., M.J.Al-Khawaja, andA. Marafia. 2008.Validation of CFD simulation for flat plate solar energy collector.
Renewable Energy, 33(3): 383–387.
Yadav, A.S., andJ.L.Bhagoria. 2013. Heat transfer and fluid flow analysis of solar air heater: A review of CFD approach.Renewable and Sustainable Energy Reviews,23(2013):60–79.
Wang, C., Z. Guan,X. Zhao, and D.Wang.2006. Numerical simulation study on transpired solar air collector. In:
Proceedings of the sixth international conference for