Optimization of extrusion point pressure of pineapple pomace
based mash
Oduntan, O. B., A. I. Bamgboye
(Department of Agricultural and Environmental Engineering, University of Ibadan, Ibadan. Nigeria)
Abstract: The effect of pre-processing conditions such as heating temperature (60°C, 80°C, 100°C, and 120°C), moisture content (50%, 55%, and 60%), die size (4, 6 and 8 mm) and pomace ratio (5:1, 6:1 and 7:1) on the extrusion point pressure of pineapple pomace based mash were investigated using a laboratory press. Pineapple pomace flour was produced by drying and grinding fresh pomace from a juice processing plant. The flour was mixed with cassava flour and water at different blend ratio to form mash of different moisture contents. Response surface method was applied to optimize the operating variables. Experimental extrusion point pressure varied from 6.09 to 8.69MPa with an average value of 7.51MPa. Temperature, die sizes and pomace ratio significantly influenced (P < 0.05) extrusion point pressure. Significant regression models were established with the coefficient of determination, R2 greater than 0.72. The optimum conditions for the extrusion point pressure were 100°C temperature; 4 mm die size, 55% moisture content and 6:1 pomace ratio at maximum desirability of 1:00. The effect of preprocessing conditions (temperature, die size, moisture content and pomace ratio) was significant (p < 0.05) on extrusion point pressure.
Keywords: temperature, moisture content, die size, pomace ratio, optimize
Citation: Oduntan, O. B., and A. I.Bamgboye. 2015. Optimization of extrusion point pressure of pineapple pomace based mash. AgricEngInt: CIGR Journal, 17(2):151-159.
1 Introduction
1Pineapple (Ananascomosus) is one of the commercially important fruit crops in the world; with the total annual world production of 14.6 million tonnes of fruits (Heuze et al, 2013). Thailand is the largest producer, accounting for 16 percent of global output, followed by the Philippines (12%) and Brazil (10%). Nigeria produced about six per cent out of the total 14.220 metric tonnes world production of pineapple in 2010, taking the lead as the highest producer in Africa (Heuze et al, 2013). Although only a third of its output is utilized for processing and the rest are consumed fresh. Commercial processing of pineapple into fruit juice is becoming popular in Africa producing countries, especially in Nigeria. They are now building capacity for local processing in order to increase obtainable revenue from
Received date: 2014-03-27 Accepted date: 2015-03-29
*Corresponding author: Anisur Rahman, Department of Farm Power and Machinery, Bangladesh Agricultural University, Mymensingh, Bangladesh. Email: [email protected].
pineapple when it is exported as processed fruit juice. The increased production in Nigerian has led to an increased agro-industrial residue production. These residues known as pomace constitute a heterogeneous mixture of husks and skins and account for the 34.7% of the whole fruit mass constituting disposal problems. However, there is a great interest in utilizing this biomass as a source of feed ingredient for feeding to livestock (Mantovaniet al., 2004; Rogérioet al., 2007). Pomace generated at the fruit juice industries has increased from negligible amounts to almost 300 tons per week (Olosunde, 2010). Disposal of this solid waste become more difficult as the growth of the industry continues. Azevêdo et al., (2011) reported that pomace were found to have a higher energy value than maize silage and were able to partly replace energy concentrates in diets for ruminants
152 March, 2015 AgricEngInt: CIGR Journal Open access at http://www.cigrjournal.org Vol. 17, No. 2
usually expressed from moisturized feed known as mash by mechanical expression (Oduntan and Koya, 2013; Enweremadu and Alamu, 2010). Mechanical pellet extrusion process involves the application of pressure (using hydraulic or screw presses) to force pellet out of the mash. The applied pressure at the point that pellet comes out of the feed mash is regarded as the extrusion point pressure (Oduntan and Koya, 2013). The extrusion point pressure, therefore, is the minimum pressure that must be applied before pellet extrusion commences. Identification of the extrusion point pressure in mechanical pellet extrusion is an important step in operation. Certain pre-treatment operations known to influence pellet yield in mechanical extrusion include heat treatment, moisture conditioning, die size, mash formulations and size reduction (Adeeko and Ajibola, 1990; Ajibolaet al., 2002; Oyinlola and Adekoya, 2004; Ogunsinaet al., 2008; Aregbesola et al., 2012).
The aim of study is to investigate the effect of some pre-processing conditions on extrusion point pressure of pineapple pomace based mash.
2 Materials and methods
2.1 Source of materials and moisture content
determination
The fresh pineapple pomace sample was obtained from a juice processing plant in Ibadan, Nigeria. Moisture content was determined using the American Society of Agricultural Engineers Standard S410.1 Dec. 1997 (ASABE Standards, 2003).
2.2 Preparation of samples
The sample was dried in a fluidized bed dryer (Fexod AS 230, Nigeria) at temperatures below 65°C to avoid changes in the functional properties and proteins with air velocity of 5.0 m/s in a forced convection dryer as thin layer with thickness of between 10 - 15 mm. The samples were ground to powder through a 0.5 mm screen
using a disc mill (Fedek 200, Nigeria) to prevent adverse effect on the hydration characteristics on the textures of the fibre concentrates (Sacilik and Unal., 2005). The samples were mixed with cassava flour in three different ratios (4:1, 5:1, 6:1). The mixture were conditioned by adding water to the sample to raise the moisture from the initial value (10%) to the required level of 20%, 22% and 24% for 10 minute in a batch mixer (Fexod AS 170, Nigeria). The amount of water that was added was determined using equations 1 and 2.
𝑀𝐶𝑑𝑏= [𝑀𝐶𝑤𝑏⁄(100 − 𝑀𝐶𝑤𝑏)]100% (1)
𝑚𝑤= 𝑀𝐶𝑑𝑏× 𝑚𝑑 (2)
where: 𝑀𝐶𝑑𝑏– moisture content (dry basis), 𝑀𝐶𝑤𝑏–
moisture content (wet basis), 𝑚𝑑 – mass of dry matter,𝑚𝑤– mass of water to be added.
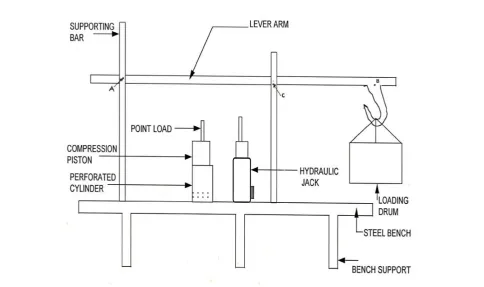
2.3 Extrusion of sample mash
The resulting mash cooked at three predetermined temperatures was compressed in a laboratory press. The laboratory equipment to produce pellet included a hydraulic press and an open-end die (Figure 1). The die used includes a pre-compression section with the compression ratio 5:1. The die temperature was controlled through the use of an electrical heater fitted around the die. A type-K thermocouple was placed in a hole made in the die and it was used to control the die to four predetermined temperature (60°C, 80°C, 100°C, 120°C). The mash was allowed to project well inside the cylinder so as to extrude mash when the extrusion point was attained. The pressure applied to each sample through the point load was varied by moving the cylinder and contents across the lever (Ajibolaet al., 2002; Ogunsinaet al., 2008; Aregbesolaet al., 2012). The results of the pressure were used to determine the optimum parameters. The data obtained was analyzed using Fisher’s test for ANOVA and response surface
2.4 Statistical optimization of factors affecting
extrusion pressure point by RSM
The relationship between the variable (temperature, die sizes, moisture content and pomace ratio) and the important design process response (pressure) for the extrusion pressure point in the design of the extruder process was analyzed using response surface methodology (RSM). The D- Optimized was used to develop mathematical equations where predicted results (y) were assessed as a function of temperature (x1), die
sizes (x2), moisture content (x3) and pomace ratio (x4) and
calculated as the sum of a constant, four first-order as shown in equation 3.
𝑦 = 𝑏0+ 𝑏1𝑥1+ 𝑏2𝑥2+ 𝑏3𝑥3+ 𝑏4𝑥4+ 𝑏12𝑥1𝑥2+ 𝑏13𝑥1𝑥3+ 𝑏14𝑥1𝑥4+ 𝑏23𝑥2𝑥3+ 𝑏24𝑥2𝑥4+ 𝑏34𝑥3𝑥4+ 𝑏11𝑥12+ 𝑏22𝑥22+ 𝑏33𝑥32+ 𝑏44𝑥42+ (3)
The predicted response (Y) for the extrusion point pressure of samples treated was obtained using Equation 1 (Demirel and Kayan, 2012). The results obtained were then analyzed by ANOVA to assess the “goodness of fit”
using Fisher's test for ANOVA (Nordin et al., 2004)..
Equations from the first ANOVA analysis were modified by eliminating the terms found statistically insignificant. The calculated F value was compared with the tabulated
F value at a significance level of 0.05, when the df for the
model was 14 and n = 25.
3 Results and discussion
3.1 Optimization of extrusion conditions using the
RSM approach
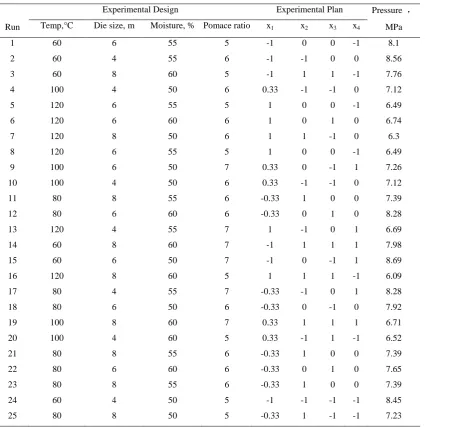
Table 1 depicts a complete 4*33 factorial design with average extrusion point pressure for pineapple pomace at different expression conditions (heating temperatures die size, moisture content and pomace inclusion ratio). The results showed that the extrusion point pressure reduced with increase in heating temperature and die sizes at all moisture levels. The Table showed the design of experiment (DOE) matrix generated through the use of RSM; having actual and coded values of the input variables along with one output response effects (terms in
x1, x2, x3and x4), four second-order effects (x1
2
, x2
2
, x3
2
and
x4
2
) and six interaction effect (x1x2, x1x3, x1x4, x2x3, x2x4and
x3x4,) as shown in equation 3. A reduced quadratic
154 March, 2015 AgricEngInt: CIGR Journal Open access at http://www.cigrjournal.org Vol. 17, No. 2
model in terms of coded factors was observed and all the models were significant (p < 0.05). It can be seen that extrusion point pressure increase with increase in pineapple pomace inclusion rate. The extrusion point
pressure varied in the range of 6.09 to 8.69 MPa with an average value of 7.51 MPa. The maximum extrusion point pressure was about 1.4 times more than the minimum extrusion point pressure at the coded point.
The following coded response equation was obtained for variation of extrusion point pressure.
Extrusion point pressure = 7.17 − 1.01𝑥1− 0.19𝑥2−
0.15𝑥3+ 0.078𝑥4+ 0.34𝑥12− 0.13𝑥22− 0.038𝑥32−
0.041𝑥42+ 0.02𝑥1𝑥2+ 0.055𝑥1𝑥3+ 0.048𝑥1𝑥4+
0.11𝑥2𝑥3+ 0.14𝑥2𝑥4− 0.054𝑥3𝑥4 (4)
It is observed from Equation 4 that coefficients of x1,
x2 and x3 are negative, but that of x4 is positive. Therefore,
increase in temperature, die size and moisture content
may reduce the extrusion point pressure, whereas increase in pomace inclusion ratio may increase the extrusion point pressure. Since coefficient of x1
2
is positive, a minimum extrusion point pressure will occur in the range of die size selected for the experimentation, whereas coefficient of x2
2
, x3 2
, x4 2
are negative, a maximum extrusion point pressure will be in the range of die size, moisture content and pomace inclusion rate respectively.
The quadratic regression models obtained from D-optimal employed in the optimization of extrusion
Table 1D-optimal design experiments and experimental results.
Run
Experimental Design Experimental Plan Pressure ,
MPa Temp,°C Die size, m Moisture, % Pomace ratio x1 x2 x3 x4
1 60 6 55 5 -1 0 0 -1 8.1
2 60 4 55 6 -1 -1 0 0 8.56
3 60 8 60 5 -1 1 1 -1 7.76
4 100 4 50 6 0.33 -1 -1 0 7.12
5 120 6 55 5 1 0 0 -1 6.49
6 120 6 60 6 1 0 1 0 6.74
7 120 8 50 6 1 1 -1 0 6.3
8 120 6 55 5 1 0 0 -1 6.49
9 100 6 50 7 0.33 0 -1 1 7.26
10 100 4 50 6 0.33 -1 -1 0 7.12
11 80 8 55 6 -0.33 1 0 0 7.39
12 80 6 60 6 -0.33 0 1 0 8.28
13 120 4 55 7 1 -1 0 1 6.69
14 60 8 60 7 -1 1 1 1 7.98
15 60 6 50 7 -1 0 -1 1 8.69
16 120 8 60 5 1 1 1 -1 6.09
17 80 4 55 7 -0.33 -1 0 1 8.28
18 80 6 50 6 -0.33 0 -1 0 7.92
19 100 8 60 7 0.33 1 1 1 6.71
20 100 4 60 5 0.33 -1 1 -1 6.52
21 80 8 55 6 -0.33 1 0 0 7.39
22 80 6 60 6 -0.33 0 1 0 7.65
23 80 8 55 6 -0.33 1 0 0 7.39
24 60 4 50 5 -1 -1 -1 -1 8.45
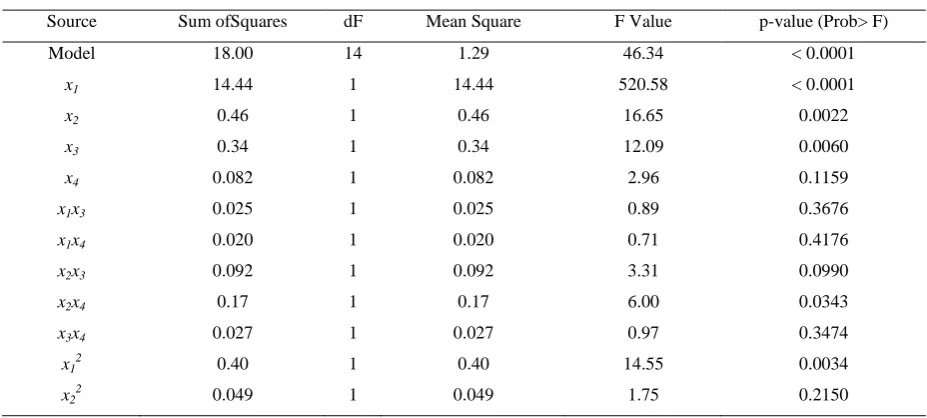
point pressure are shown in Table 2. The statistical significance of the second-order equation was observed from the Table; showing that the regression is statistically significant (P < 0.0001); however, the lack of fit is not
statistically significant at 99% confidence level. The significance of the regression coefficients and ANOVA for the regression model, respectively were also observed from the table. The results indicated that the response equation proved to be suitable for the D-optimal experiment (Guttorp and Lindgren, 2009; Demirel and Kayan, 2012). The model's F value of 46.34 in these tables implies that the model is significant for the
extrusion point pressure of the pomace. If the model has a very high degree of adequacy for predicting the experimental results, the computed F value should be greater than the tabulated F value at a level of significance α. It can be observed that the tabular F
value (F0.05,14,10 = 2.85) is clearly less than the calculated
F value of 46.34. Adequate precision measures of the signal to noise ratio, and a ratio value greater than 4 is desirable. Therefore, in the quadratic model extrusion point pressure of pineapple pomace, an adequate precision of 22.26 indicates an adequate signal for extrusion process.
The values of R2 (98.48%) and Adj-R2 (96.36%) are close to 1.0, which is very high, indicating a high correlation between the observed values and the predicted values. This indicates that the regression model provides an excellent explanation of the relationship between the independent variables and the response (Mason et al., 2003; Demirel and Kayan, 2012). In addition, the p-values for the interaction term between temperature and moisture content; temperature and pomace ratio; are high (0.3676 and 0.4176 respectively) and hence insignificant.
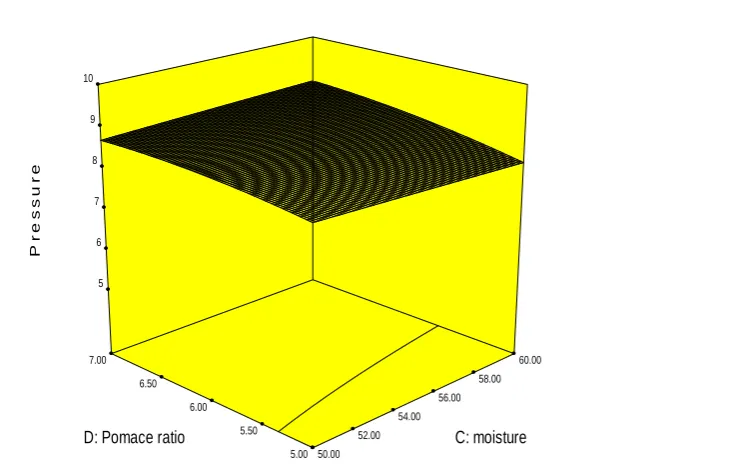
Response surface curves for variation in extrusion pressure point were shown in Figures 2 and 3. In each set, two variables varied within the experimental range, while the other two variables remained constant at zero level.
These two figures show the extrusion pressure point with respect to temperature versus die sizes and pomace versus moisture content respectively. It was observed from Figure 2that increase in temperature resulted in quadratic decrease in pressure in the production up to 120oC and 8 mm respectively. Oduntan and Koya (2013) also reported similar behavior due to competition of absorption of water between pomace and available starch. Pressure decreased with increase in moisture content, which may be attributed to the reduction of elasticity of dough through plasticization of melt at higher moisture content (Ding et al., 2005). The extrusion point pressure increases, but at a point on 6 mm die, it began to fall. From Figure 3, it was seen that extrusion point pressures increased with
Table 2: ANOVA Regression Coefficient of Second order polynomial and their significance for
Extrusion Point Pressure.
Source Sum ofSquares dF Mean Square F Value p-value (Prob> F)
Model 18.00 14 1.29 46.34 < 0.0001
x1 14.44 1 14.44 520.58 < 0.0001
x2 0.46 1 0.46 16.65 0.0022
x3 0.34 1 0.34 12.09 0.0060
x4 0.082 1 0.082 2.96 0.1159
x1x3 0.025 1 0.025 0.89 0.3676
x1x4 0.020 1 0.020 0.71 0.4176
x2x3 0.092 1 0.092 3.31 0.0990
x2x4 0.17 1 0.17 6.00 0.0343
x3x4 0.027 1 0.027 0.97 0.3474
x1 2
0.40 1 0.40 14.55 0.0034
156 March, 2015 AgricEngInt: CIGR Journal Open access at http://www.cigrjournal.org Vol. 17, No. 2
pomace ratio and this may be attributed to high mechanical shear. Extrusion point pressures decreased with the increase in moisture content probably due to increased dextrinization at higher temperature (Frame, 1994).
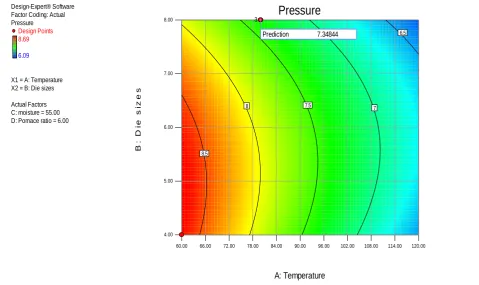
The contour plot in Figure 4, show points where all parameters simultaneously meet the desirable extrusion point pressure criteria. The maximum value of extrusion point pressure determined was 8.5 MPa at 66oC and 5.5 mm die size.
Figure 2 Design-expert plot; response surface plot for pressure as a function of temperature and die sizes at moisture content of 50% and pomace ratio 5:1
Figure 3 Design-expert plot; response surface plot for pressure as a function of moisture and pomace ratio at moisture content of 60% and die sizes 6mm.
Design-Expert® Software Factor Coding: Actual Pressure
X1 = A: Temperature X2 = B: Die sizes
Actual Factors C: moisture = 50.00 D: Pomace ratio = 5.00
4.00 5.00 6.00 7.00 8.00
60.00 66.00
72.00 78.00
84.00 90.00
96.00 102.00
108.00 114.00
120.00 5
6 7 8 9 10
P
r
e
s
s
u
r
e
A: Temperature B: Die sizes
Design-Expert® Software Factor Coding: Actual Pressure
X1 = C: moisture X2 = D: Pomace ratio
Actual Factors A: Temperature = 60.00 B: Die sizes = 6.00
5.00 5.50 6.00 6.50 7.00
50.00 52.00
54.00 56.00
58.00 60.00 5
6 7 8 9 10
P
r
e
s
s
u
r
e
As shown in Table 5, the optimum preliminary experimental process was found to be at 100oC of
temperature with 4 mm die size, 55% moisture content and 6:1 pomace ratio at maximum desirability of 1.00. Figure 4 Design-expert plot; contour plot for pressure as a function of temperature and die sizes at moisture
content of 55% and pomace ratio 6mm
Design-Expert® Software Factor Coding: Actual Pressure
Design Points 8.69
6.09
X1 = A: Temperature X2 = B: Die sizes
Actual Factors C: moisture = 55.00 D: Pomace ratio = 6.00
60.00 66.00 72.00 78.00 84.00 90.00 96.00 102.00 108.00 114.00 120.00
4.00 5.00 6.00 7.00
8.00
Pressure
A: Temperature
B
:
D
ie
s
iz
e
s
6.5
7 7.5
8
8.5
3
Prediction 7.34844
Figure 5 Design-expert plot; response surface plot for optimum extrusion point pressure as a function of temperature and die sizes at moisture content of 55% and pomace ratio 6mm
Design-Expert® Software Factor Coding: Actual Desirability
X1 = A: Temperature X2 = B: Die sizes
Actual Factors C: moisture = 55.00 D: Pomace ratio = 6.00
4.00 5.00 6.00 7.00 8.00
60.00 66.00 72.00 78.00
84.00 90.00 96.00 102.00
108.00 114.00 120.00 0
0.2 0.4 0.6 0.8 1 1.2
D
e
s
i
r
a
b
i
l
i
t
y
158 March, 2015 AgricEngInt: CIGR Journal Open access at http://www.cigrjournal.org Vol. 17, No. 2
4 Conclusions
The effect of preprocessing conditions (temperature, moisture content, die size and pomace ratio) were significant (P < 0.05) on extrusion point pressure.
The optimum conditions were 100oC temperature 4 mm die size, 55% moisture content and 6:1 pomace ratio at maximum desirability of 1.00.
Acknowledgements
Appreciation is extended to the management and staff of Fexod Fedek Engineering and Funman Agricultural products, Ibadan, Oyo state for granting access to their facilities during this investigation.
List of abbreviations
𝑀𝐶𝑑𝑏= moisture content (dry basis), % 𝑀𝐶𝑤𝑏= moisture content (wet basis) % 𝑚𝑑= mass of dry matter, g
𝑚𝑤= mass of water to be added, g
References
Adeeko, K. A., and O. O. Ajibola. 1990. Processing factors affecting yield and quality of mechanically expressed groundnut oil. Journal Agricultural Engineering Research, 45(1), 31-43.
Ajibola, O. O., D. A. Okunade, and O. K. Owolarafe. 2002. Oil point pressure of soybean. Journal Food Process
Engineering,25(1), 407-416.
ASABE Standards.2003. S269.4. Cubes, pellets and
crumbles-definitions and methods for determining density, durability, and moisture content. St. Joseph, M1.
Aregbesola, O. A., G. A. Olatunde, S. S Esuola, and O. K.Owolarafe.2012. Oil point pressure of Indian almond kernel. International Agrophysics, 26(3), 225-228. Azevêdo, J. A. G., S. C. Valadares Filho., D. S. Pina., E. Detmann,
R. F. D., Valadares, L. G. R., Pereira, N. K., Souza, and L. F. Costa e Silva. 2011. Intake, total digestibility, microbial protein production and the nitrogen balance in diets with fruit by-products for ruminants. Journal Brazilian
Zootechnology, 40(5): 1052-1060.
Demirel, M., and K. Kayan. 2012. Application of response surface methodology and central composite design for the optimization of textile dye degradation by wet air oxidation, International Journal of Industrial Chemistry,3(1):24.
Ding, Q. B., P. Ainsworth., G. Tucker, and H. Marson. 2005. The effect of extrusion conditions on the physicochemical properties and sensory characteristics of rice based expanded snacks, Journal of Food Engineering, 66(3):283-289.
Enweremadu, C. C., and O. J. Alamu. 2010. Development and characterization of biodiesel from shea nut butter.
International Agrophysics, 24(1), 29-34.
Fasina, O.O. 2008. Physical properties of peanut hull pellet.
Journal Bioresource Technology, 99(5): 1259-1266.
Frame, N. D.1994.InThe Technology of Extrusion Cooking. New York: Blackie Academic and Professional.
Guttorp, P., and G. Lindgren. 2009. "Karl Pearson and the Scandinavian school of statistics". International Statistical Review77: 64.
Heuze, V., G. Tran, and S. Giger-Reverdin. 2013. Pineapple by-products. Feedipedia.org. A programme by INRA, CIRAD, AFZ and FAO. Available
at:http://www.feedipedia.org/node/676, 16:46.
Kumar, N., B. C. Sarkar, and H. K. Sharma.2010. Development and characterization of extruded productof carrot pomace, rice flour and pulse powder. African Journal of Food Science,4(11): 703 – 717.
Mantovani, J. R., M. C. M. Corrêa, M. C. P. Cruz, M. E. Ferreira, and W. Natale. 2004. Agronomic use of by-product of guava processing industry - II - nutritional status and production. Journal of BraziliansFruticultural, 26(1):339-342.
Mason, R. L., R. F. Gunst, and J. L. Hess. 2003. In Statistical Design and Analysis of Experiments, Eighth Applications
to Engineering and Science, second ed. New York: Wiley.
Nordin, M. Y., V. C. Venkatesh, S. Sharif, S. Elting, and A. Abdullah. 2004. Application of response surface methodology in describing the performance of coated carbide tools when turning AISI 104 steel.Journal
Material Processing Technology, 145(1):46–58.
Oduntan, O. B., O. A. Koya., M. O. Faborode, and A. O. Oduntan. 2012. The performance evaluation of a cassava pelletizer.
Canadian Journal on Science and Industrial Research, 3 (2):83 -91.
Oduntan, O. B, and O. A. Koya. 2015. Effect of speed, die sizes and moisture contents on durability of cassava pellet in pelletizer. Research in Agricultural Engineering,61 (1): 35-39.
Ogunsina, B., O. Owolarafe, and G. Olatunde. 2008. Oil point pressure of cashew (Anacardiumoccidentale) kernels.
International Agrophysics, 22(1):53-59.
OyinlolaA, and L. Adekoya. 2004. Development of a laboratory model screw press for peanut oil expression. Journal of
Food Engineering, 64(2): 221-227.
Rogério, M. C. P., I. Borges, J. N. M. Neiva, J. C. M. Pimentel, F. C. Carvalho, T. R. Ponte, T. O. Gomes, and Santos, S. F. 2007. Nutritive value of pineapple by-product (Ananascomosus L.) in diets for sheep. 1. Intake, apparent
digestibility, energetic and nitrogenous balance. Journal
Brazilian Veterinary Medicine Zootechnology, 59 (3):
773-780.