RESEARCH
In silico evo-devo: reconstructing stages
in the evolution of animal segmentation
Renske M. A. Vroomans
*, Paulien Hogeweg and Kirsten H. W. J. ten Tusscher
Abstract
Background: The evolution of animal segmentation is a major research focus within the field of evolutionary–devel-opmental biology. Most studied segmented animals generate their segments in a repetitive, anterior-to-posterior fashion coordinated with the extension of the body axis from a posterior growth zone. In the current study we ask which selection pressures and ordering of evolutionary events may have contributed to the evolution of this specific segmentation mode.
Results: To answer this question we extend a previous in silico simulation model of the evolution of segmenta-tion by allowing the tissue growth pattern to freely evolve. We then determine the likelihood of evolving oscillatory sequential segmentation combined with posterior growth under various conditions, such as the presence or absence of a posterior morphogen gradient or selection for determinate growth. We find that posterior growth with sequential segmentation is the predominant outcome of our simulations only if a posterior morphogen gradient is assumed to have already evolved and selection for determinate growth occurs secondarily. Otherwise, an alternative segmenta-tion mechanism dominates, in which divisions occur in large bursts through the entire tissue and all segments are created simultaneously.
Conclusions: Our study suggests that the ancestry of a posterior signalling centre has played an important role in the evolution of sequential segmentation. In addition, it suggests that determinate growth evolved secondarily, after the evolution of posterior growth. More generally, we demonstrate the potential of evo-devo simulation models that allow us to vary conditions as well as the onset of selection pressures to infer a likely order of evolutionary innovations.
Keywords: Segmentation, In silico evolution, Axis extension, Posterior signalling, Determinate growth, Bilaterian evolution
© 2016 The Author(s). This article is distributed under the terms of the Creative Commons Attribution 4.0 International License (http://creativecommons.org/licenses/by/4.0/), which permits unrestricted use, distribution, and reproduction in any medium, provided you give appropriate credit to the original author(s) and the source, provide a link to the Creative Commons license, and indicate if changes were made. The Creative Commons Public Domain Dedication waiver (http://creativecommons.org/ publicdomain/zero/1.0/) applies to the data made available in this article, unless otherwise stated.
Background
Segmentation, the division of the animal body plan into multiple, repeating units, has fascinated evolutionary and developmental biologists alike. Only the vertebrates, arthropods and annelids display overt body segmenta-tion, while several other clades show intermediate levels of segmentation in only a subset of tissues or organs, a property called metamerism [1–3]. Repetitive patterning is studied in most detail in overtly segmented animals. In these clades, segments are typically laid down in a regu-lar anterior–posterior sequence, via a process involving
posterior growth (also called terminal addition) and peri-odic, sequential generation of segments [3, 4]. A famous exception is the fruit fly Drosophila in which segments are laid down simultaneously across a preformed body axis.
It is currently unresolved why segmented animals mostly display this superficially similar, sequential mode of segmentation. This issue is partly related to the question of whether segmentation was present in the bilaterian ancestor, either as overt segmentation or as metamerism, or rather that it evolved multiple times in parallel in the different lineages [1, 2, 4–13]. Arguments in favour of a single origin of segmentation include the prevalence of sequential segmentation [3,
Open Access
4]. Studies using ancestral state reconstruction sug-gest that this mode of segment addition via posterior outgrowth represents ancestral bilaterian properties [9, 14]. In addition, the three segmented lineages have shared genes involved in segmentation, such as Notch, Engrailed and Wnt [4, 8, 15, 16]. Arguments in favour of parallel evolution of segmentation instead put for-ward that there are also large differences in the genes responsible for segmentation and that the limited observed overlap in gene usage could be explained by parallel recruitment from the limited developmental genetic toolbox [12]. The precise mechanisms of cell division, axial elongation and sequential segmentation also differ substantially between these lineages, ranging from teloblastic growth and stereotyped cell divisions in annelids and some crustaceans [17, 18], to poste-rior growth zones in most insects and vertebrates [19,
20] with variable roles of cell division versus cell rear-rangement [21, 22]. Furthermore, multiple segmenta-tion processes can take place in different body regions or tissue types even within a single organism, each with their own evolutionary origin [23], which further sup-ports (partial) parallel evolution.
Still, independent of whether sequential segmentation evolved once or multiple times, we can ask whether cer-tain factors or conditions may have contributed to this particular evolutionary outcome. Earlier evo-devo simu-lation studies have demonstrated that sequential segmen-tation represents a robust evolutionary outcome with high future evolutionary potential [24–26], suggesting evolutionary advantages of this particular segmentation mode. In addition, prior evolutionary events may have generated biases or constraints that influenced the like-lihood of the evolution of sequential segmentation. For example, evolutionary comparisons show that a posterior signalling region characterised by caudal, Wnt and FGF signalling predates the origin of the bilaterians [27]. Fur-thermore, it was recently suggested that posterior growth through terminal addition was already present in the bilaterian ancestor [14]. Thus, we may ask whether these properties have played a decisive role in sending evolu-tion down the path of evolving sequential segmentaevolu-tion.
In the current study we aim to answer these questions. For this we substantially extended a previously used in silico model [26]. Rather than superimposing a particu-lar growth pattern, we incorporate a gene controlling cell division and let evolution determine the type of tissue growth dynamics that arises. Then, by varying whether or not a stable posterior signalling centre is present in simulations, we can investigate the role of such a signal-ling centre on the type of growth and segmentation that evolves. We thus substantially expanded the degrees of freedom available to the evolutionary process, allowing
us to investigate under which conditions sequential seg-mentation is the most likely evolutionary outcome.
We observe two predominant evolutionary outcomes: sequential segmentation with posterior growth and simultaneous segmentation involving tissue-wide bursts of divisions. We find that the likelihood with which the strategies evolve depends on the type of imposed morph-ogen dynamics and the strength and timing of an evolu-tionary pressure for determinate growth. We show that a self-organised posterior signal is more difficult to evolve than a developmental strategy which does not rely on such a posterior centre. From this we conclude that the prior evolution of a posterior signalling centre has played a decisive role in determining the evolution of sequential segmentation. Furthermore, we demonstrate that an evo-lutionary pressure for determinate growth reduces the likelihood of evolving sequential segmentation. When we apply this evolutionary pressure after sequential growth and segmentation have evolved, a mechanism to stop growing can evolve which is coordinated with the pre-existing sequential segmentation. We therefore propose that the order of evolutionary events is key to inferring the likelihood of particular developmental strategies. Reversing the argument, our work strongly suggests that a posterior signalling zone evolved prior to segmentation and that sequential growth and segmentation evolved prior to determinate growth.
Methods The model
General set‑up
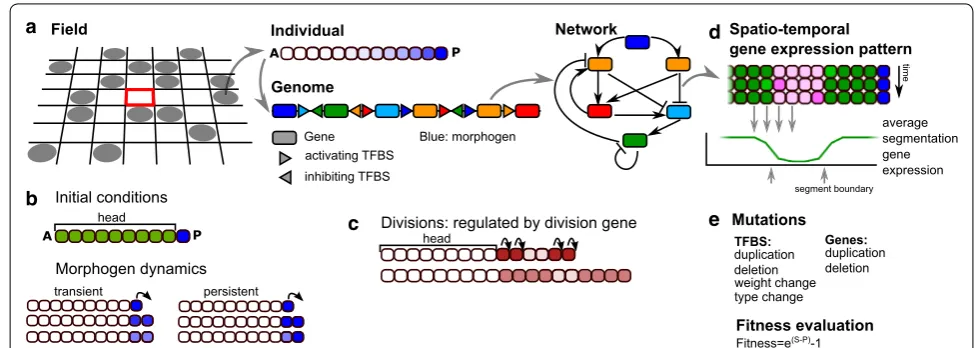
We extend an existing individual based model of a pop-ulation of organisms evolving on a lattice [26] (Fig. 1a). Each organism possesses a so-called pearls-on-a-string genome consisting of genes encoding transcription fac-tors (TFs) and upstream regulatory regions with tran-scription factor binding sites (TFBS) [28]. At birth, organisms consist of a short one-dimensional row of cells which grows through the course of the individual’s development. An individual’s probability of reproduction (fitness) depends on the number of segments present in its gene expression pattern after a predefined amount of developmental time.
Individuals Genome, network
Transcription of a gene is determined by the summed input of all activating and repressing TFBS regulating this gene, where the influence of each individual TFBS is assumed to depend on TF concentration in a saturat-ing manner. Ei is the maximum expression level of gene i and di is the degradation rate of the resulting protein;
both values can evolve. wj is the weight determining the
strength with which TF j influences the expression of gene i; this weight is negative (−1) for repressing TF and positive (+1) for activating TF; the sign of these weights is subject to evolution. Hj represent the evolvable Hill constants of the TFBS, where the Hill constant corre-sponds to the level of the TF at which half-maximal acti-vation or repression occurs. The expression of all genes of the same type (see below) is summed into a single pro-tein level.
Developmental tool kit and initial conditions There are 16 types of genes, indicated with a number from 0 to 15.
Gene 0 is the morphogen unless indicated differently, it is not regulated by any of the other genes, thus corre-sponding to a maternal input. It is kept at a high expres-sion level in the posterior-most cell, while decaying with
(1) dGi/dt=
input2 input2+1
∗Ei−di∗Gi
input=MAX
0.,
�
j
wj∗G2j
Gj2+Hj2
a predefined rate in the rest of the embryo (Figs. 1b, 2). In a subset of simulations instead, this high posterior expression is only used as an initial condition and is thus not automatically maintained in the posterior-most cell, and the gene may become regulated by other genes.
Gene 1 and gene 2 are signalling genes, responsible for direct, membrane bound cell–cell signalling (similar to e.g. Delta–Notch signalling). This direct cell–cell sig-nalling is implemented as follows: if a gene has TFBS of type 1 or 2 in its upstream region, the expression of that gene in a particular cell is regulated by the levels of pro-tein type 1 or 2 in its directly neighbouring cells, while its own intracellular levels of these proteins have no impact on the expression of that gene but only on that of genes in neighbouring cells. If cell–cell signalling is switched off in a simulation, genes 1 and 2 function as normal genes.
Gene 4 is the division gene when it is highly expressed (protein level >80. a.u.), the cell may divide with high probability (p=0.975). Upon division, the level of only
the division gene is halved in the resulting two daughter cells (Fig. 1c).
Gene 5 is the segmentation gene, whose final pattern of gene expression along the body axis determines the fit-ness of the organism.
Individuals start their development with a short row of 10 cells, where the posterior cell forms the primordial “growth zone” in which the morphogen level is high; in the remaining nine cells (the “head” that is assumed to
a
b
c
d
e
have evolved prior), the morphogen is absent (Fig. 1b). At the start of development genes 6 and 7 are uniformly expressed in the zygote, while other genes have an initial expression level of 0. Throughout development, the pro-tein levels are updated according to the network (Eq. 1).
Fitness evaluation At the end of development (after a fixed number of time steps), the number of well-formed segments determines an individual’s fitness. A segment is defined by the average expression pattern of the seg-mentation gene over the last 20 or 40 developmental steps (Fig. 1d). This averaging helps ensure the evolution of temporally stable segmental patterning, as it will not reward oscillatory segmentation that fails to converge on a constant spatial pattern (as occurred in [25]). Seg-ments should be at least seven cells wide, and bounda-ries between segments should consist of a clear transition of the expression of the segmentation gene from a high to a low level, or vice versa, within five cells (similar to earlier definitions [24, 26]. The number of too narrow segments is subtracted from the number of well-formed ones, reducing the fitness. To further ensure stability of the final developmental pattern, we apply an additional fitness penalty for the amount of variance of the pattern from the average (pattern instability) within the final 20 developmental steps.
In a subset of simulations, some fitness can also be obtained by reaching a target tissue size. This fitness bonus is independent from the number of segments, ena-bling sequential as well as simultaneous evolution of tis-sue size and segmentation. We also apply some penalties unrelated to the segments. First, we require that at least one gene of each type is present in the genome; if this requirement is not met, the individual is not allowed to reproduce. Second, a penalty is applied when the individ-ual grows larger than the target final tissue size. Finally, small fitness penalties are used for gene and TFBS num-bers in order to prevent excessive genome growth. The fitness then becomes eF −1.
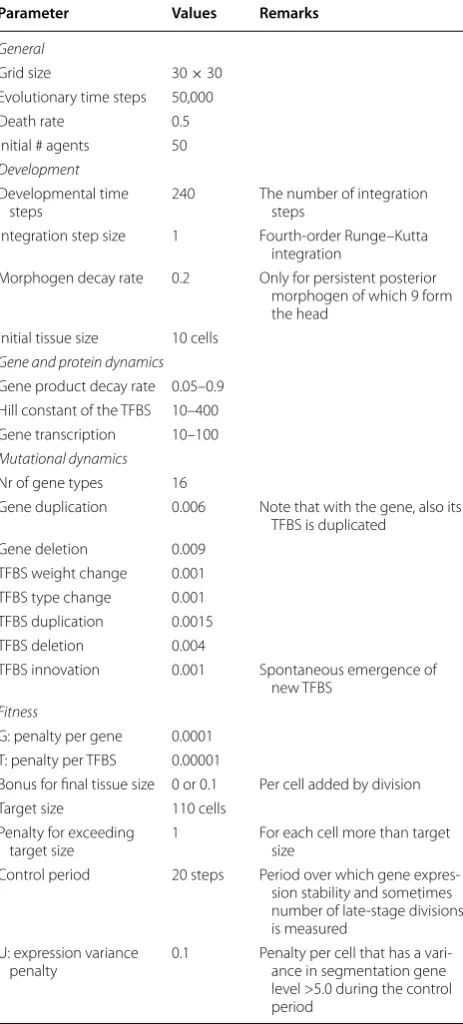
See Table 1 for all parameter values.
Evolution
Initial conditions, mutations and simulations The popula-tion is initialised with 50 genetically identical individuals. The population resides in a grid of size 30 × 30, imposing a maximum to the population size of 900 individuals. The (2) F =nr good segments
−nr narrow segments
+proximity to target size
−G∗gene nr
−T ∗TFBS nr
−U∗nr unstable cells
genome of the initial individuals contains a single copy of each gene, in randomised order and with an average of 2 TFBS of random type upstream. Individuals compete for reproduction into a neighbouring empty spot. Those with a higher fitness have a larger probability of being selected. Specifically, an individual’s chance to reproduce is pro-portional to its fitness divided by the sum over the fitness of itself and the other individuals neighbouring the empty position. Death occurs with a constant probability. Upon reproduction, the genome is mutated via duplications and deletions of both genes and TFBS (Fig. 1d). TFBS may also mutate their type (which protein binds), weight (activating or repressing) and Hill constant, and new TFBS may appear de novo as an innovation. Genes may mutate their maximum activation level E and decay rate d. Gene duplication also copies the associated TFBS and results in multiple genes of the same type. The expression of all genes of the same type therefore contributes to the expression level of a single protein. Note that since there are no mutations that change the gene type, gene dupli-cation cannot be followed by subsequent divergence in our model.
Analysis
For each set of model settings and parameter values, we run 50 simulations. Each simulation yields one particular growth and segmentation strategy with only minor vari-ations within the population. Therefore, we only assess one fit individual per simulation. We consider a simula-tion successful when the fittest individuals at the end of the simulation can generate more than three segments.
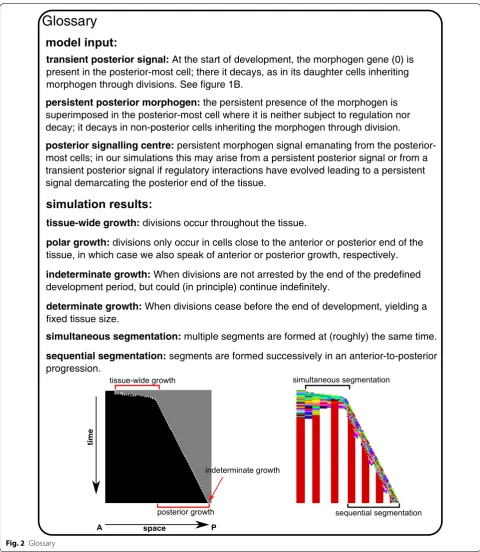
Space–time plots We use space–time plots as a first impression of the developmental mechanisms that evolved. Because we simulate 1D tissues, we can simply place snapshots of the tissue at many consecutive time points below each other, while keeping the position of the head fixed at the anterior. We display two types of space–time plots; in one, we denote the cell type of each cell with a colour, which represents a unique combina-tion of gene expression values; in the other, cell divisions are depicted by making the newest cells white (in a divi-sion, we always consider the posterior daughter cell as the newest, so the anterior daughter stays black), see for example Fig. 3.
Assessment of phenotypic variability We have only one source of noise in our simulations, namely the small probability that a cell with high division gene expression does not immediately divide. Still, this noise may cause some variability in the number of segments that are
repeated development in a histogram, where we indicate the number of malformed segments with lighter bars. When an individual evolved a mechanism that makes the same number of good segments in 40 or more times out of 50 repeated developments, we call it “developmen-tally robust”. Note that this differs from the probability of breeding true (mutational robustness): we do not assess
how mutations influence the likelihood of producing the same number of segments, as done in [29].
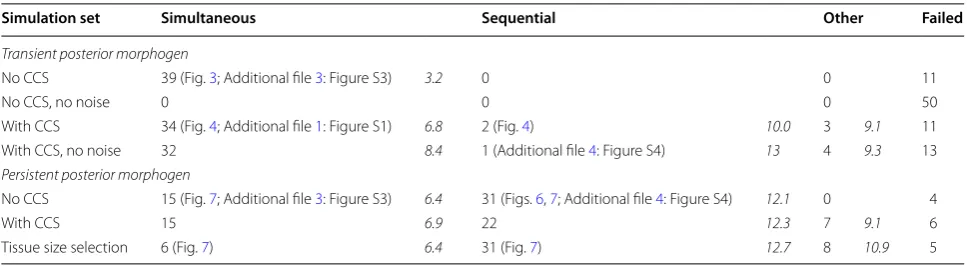
In Table 2, we display the number of times certain seg-mentation strategies evolve, and the average number of segments made per strategy. We take the phenotypic variability of an individual into account by averaging number of segments it makes during the repeated devel-opment mentioned above. These average numbers for single simulations are then averaged over all simulations in which the same developmental strategy evolved.
Division gene dynamics In some figures, we display the dynamics of the division gene in the posterior-most cell (containing a high morphogen level). These dynamics result from regulation of the division gene by other genes and from halving of the division gene upon division. In order to see the effect of regulation more clearly, we also show the network dynamics when the halving of the divi-sion gene is left out.
Modelling choices
Body axis segmentation is, like most developmental pat-terning, a complex phenomenon involving processes ranging from the subcellular to the organism level scale. In this study we simulate the evolution of body axis seg-mentation and therefore need to simulate development in a population of individuals across many generations. To keep our model tractable both in terms of simulation time and for analysing the evolutionary trajectories of the developmental processes, we substantially simplify the developmental processes in our model relative to real-world developmental processes, but incorporate those properties we deem necessary for studying the evolution of segmentation. Below we detail the three major simpli-fications, their potential consequences, and why we think these simplifications are justified.
The most obvious simplification is the 1D nature of the model, so that cell divisions automatically lead to an elon-gated body axis regardless of where they occur in the tis-sue basically assuming that the axiality is already defined. In reality, developmental patterning occurs in a 2D or 3D tissue, where complex symmetry-breaking events during early development are essential for setting up the ante-rior–posterior and dorsal–ventral axis. Furthermore, ani-mal axis elongation often involves cellular motility and adhesion properties that are not included in this model. This limits the self-organisation potential of the develop-mental processes evolving in our model. However, since symmetry breaking is an ancestral property preceding bilaterian evolution [27], we can safely assume that it already existed before segmentation evolved.
We model a cellularised environment in which mor-phogen gradients are set up through decay dynamics, and signalling is limited to direct receptor–ligand type Table 1 Parameter values
Parameter Values Remarks
General
Grid size 30 × 30 Evolutionary time steps 50,000 Death rate 0.5 Initial # agents 50
Development
Developmental time
steps 240 The number of integration steps Integration step size 1 Fourth-order Runge–Kutta
integration
Morphogen decay rate 0.2 Only for persistent posterior morphogen of which 9 form the head
Initial tissue size 10 cells
Gene and protein dynamics
Gene product decay rate 0.05–0.9 Hill constant of the TFBS 10–400 Gene transcription 10–100
Mutational dynamics
Nr of gene types 16
Gene duplication 0.006 Note that with the gene, also its TFBS is duplicated
Gene deletion 0.009 TFBS weight change 0.001 TFBS type change 0.001 TFBS duplication 0.0015 TFBS deletion 0.004
TFBS innovation 0.001 Spontaneous emergence of new TFBS
Fitness
G: penalty per gene 0.0001 T: penalty per TFBS 0.00001
Bonus for final tissue size 0 or 0.1 Per cell added by division Target size 110 cells
Penalty for exceeding
target size 1 For each cell more than target size Control period 20 steps Period over which gene
expres-sion stability and sometimes number of late-stage divisions is measured
U: expression variance
cell–cell signalling. Neither the morphogen nor any of the other gene products are subject to diffusion. Diffu-sion plays an important role in Turing-type patterning [30] and in setting up the morphogen gradients dictat-ing early Drosophila segmentation [31]. Still, in Dros-ophila genes downstream of the morphogen gradients do not require diffusion, and so far no Turing patterns have been found to underlie animal segmentation. Segmen-tation usually takes place in a cellularised environment, in which the role of diffusion is necessarily restricted to short distances or combined with other gradient estab-lishing mechanisms such as slow mRNA and protein decay [32]. Thus, we are confident that we do not exclude any major real-world segmentation mechanisms from evolving in our model and that leaving out diffusion is justified.
Finally, our model only incorporates gene expression regulation through combinatorial TF regulation on a single regulatory region, ignoring several other factors that may influence gene expression. In vertebrates for instance, the timing of Hox gene mediated axial pattern-ing, and its coordination with segmentation, involves chromosome looping, epigenetic histone and DNA modifications, and cluster level gene regulation [33]. Still, the goal of our study is to explore the evolution of gene expression dynamics, rather than to mimic how these dynamics are precisely regulated. The transcription
factor-based regulatory network has sufficient degrees of freedom to allow the evolution of the diverse gene expression dynamics (such as oscillations) that under-lie real-world segmentation processes, while supporting computational efficiency and analytical tractability.
Results
Evolutionary strategies with transient posterior signal To investigate the relevance of the prior existence of a stable posterior signalling centre and the morphogen gradients emanating from it for the evolution of poste-rior growth and sequential segmentation, we performed simulations that do and simulations that do not super-impose the existence of such a signalling centre. We start with an exploration of evolving segmentation strategies in the absence of a superimposed morphogen gradient (Fig. 3a, inset). Instead, we assume transient expression of gene 0 (the “morphogen”), restricted to the posterior-most cell of the embryo, and subject to decay in all cells. As a consequence, this gene will have the same level in the posterior cell as in all cells that descended from it and information on tissue polarity becomes quickly diluted. Under these conditions, a stable posterior signal-ling centre would have to evolve from scratch by evolv-ing regulation of this transient signal to generate a stable posterior morphogen gradient (rather than being auto-matically present [24, 26]). Alternatively, a segmentation Table 2 Evolved developmental strategies
Left number: number of simulations yielding this mechanism (figure number). Right number (italic): average number of segments generated with this mechanism
Simulation set Simultaneous Sequential Other Failed
Transient posterior morphogen
No CCS 39 (Fig. 3; Additional file 3: Figure S3) 3.2 0 0 11
No CCS, no noise 0 0 0 50
With CCS 34 (Fig. 4; Additional file 1: Figure S1) 6.8 2 (Fig. 4) 10.0 3 9.1 11 With CCS, no noise 32 8.4 1 (Additional file 4: Figure S4) 13 4 9.3 13
Persistent posterior morphogen
No CCS 15 (Fig. 7; Additional file 3: Figure S3) 6.4 31 (Figs. 6, 7; Additional file 4: Figure S4) 12.1 0 4
With CCS 15 6.9 22 12.3 7 9.1 6
Tissue size selection 6 (Fig. 7) 6.4 31 (Fig. 7) 12.7 8 10.9 5
(See figure on next page.)
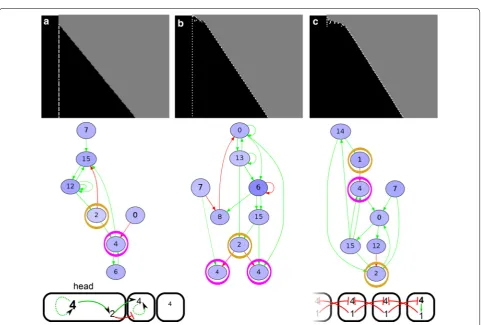
Fig. 3 Transient posterior signal without CCS yields only simultaneous segmentation. a Space–time plots of successfully evolved individuals, who mainly differ in the timing and number of tissue-wide division bursts. The right-most case only occurred once. The colour coding in the top row indi-cates cell type (based on the levels of all proteins); the white dots in the bottom row indicate new (just-divided) cells (see also “Methods”). Inset The initial conditions of the morphogen dynamics used in these simulations. The head cells do not divide. The posterior-most cell has high morphogen concentration, which is inherited by its daughters. The morphogen gene can be regulated by the evolving network, just like any other gene, but is not regulated initially. b The development of evolved individuals is not robust. The histogram depicts the number of bands generated when the development of a single evolved individual is repeated 50 times (see “Methods”). Lighter bars indicate the number of too short segments. Examples of the resulting development shown above with space–time plots of the divisions, with as inset the expression pattern of the segmentation gene.
a
b
c
mechanism could evolve which does not rely on a persis-tent posterior signal.
We perform four sets of 50 simulations: with/with-out cell–cell signalling (CCS) and with/withwith/with-out division noise (first four rows in Table 2). The simulations with-out CCS and withwith-out noise form a negative control group which does not have any symmetry-breaking mechanism: indeed, segmentation never evolves. In the remaining sets with either noise, CCS or both, segmentation does evolve. The vast majority of successful simulations (yield-ing more than three segments) evolves a segmentation strategy in which the tissue grows via one or more short-lived tissue-wide burst of divisions (Fig. 3a). The seg-ments all appear roughly at the same time after the burst of divisions; we call this simultaneous segmentation.
In the absence of CCS and presence of division noise, this simultaneous segmentation mechanism typically yields high phenotypic variability, often generating few segments and only occasionally producing many seg-ments (e.g. Fig. 3b, see “Methods”). The segments are often irregular in size, with some much wider than oth-ers. The segmentation mechanism uses the stochas-tic delay of division in a few cells early in development, which changes the dynamics in those cells sufficiently to differentiate them from their neighbours (Fig. 3c, d). This mechanism therefore does not resemble Drosophila-type simultaneous segmentation but rather reflects the fact that the evolutionary process is free to evolve any possi-ble growth and patterning modes.
In the presence of CCS instead, simultaneous seg-mentation does not require cell division noise: 37 out of 50 simulations with CCS and without noise evolve seg-ments, while 39 simulations with both CCS and noise yielded segmentation (see Table 2). In simulations with CCS, the average number of segments is doubled com-pared with the simulations without CCS. Moreover, 13 out of the 39 successful simulations with noise and CCS yield low phenotypic variability, meaning that they are able to make the same number of segments in more than 40 out of 50 repeated developments; we call this develop-mentally robust (Fig. 4a). Six of the simulations with CCS evolve simultaneous segmentation which uses cell–cell signalling to split developing segments in two (Fig. 4a). This is an alternative to the wave-splitting mechanism observed in Turing pattern systems [34], as the evolved segment-splitting mechanism only relies on signals from direct neighbours rather than feedbacks between dif-fusive substances. In the presence of CCS, we also find the rare evolution of polarised growth: in two cases the head region is used as a signalling centre for divisions and gene expression oscillations (Fig. 4b). One simula-tion with CCS and without division noise evolves divi-sions that are restricted to a broad posterior zone, from
which a number of segments appears sequentially (Addi-tional file 2: Figure S2). This mechanism uses signalling from the formed segments to an undifferentiated zone to initiate localised division bursts which then yield new segments.
Altogether, without a superimposed posterior morpho-gen gradient we obtain a nearly 100 % bias towards simul-taneous growth and patterning, with the rare appearance of polarised growth. We therefore next test whether a polarised growth dynamics evolves more frequently if we select for tissue size but not for segmentation, thereby reducing the complexity of the selection target.
By only selecting for tissue size, the majority of simu-lations still evolves tissue-wide division bursts as with simultaneous segmentation. We observe anterior growth (with or without initial division burst) in six out of 50 simulations, posterior growth in four cases (in two of which posterior growth is combined with a large initial tissue-wide division burst) and a combination of ante-rior and posteante-rior growth in two out of 50 simulations (Fig. 5). In these cases, divisions are restricted to the pos-terior cell because it has only one neighbouring cell and thus receives less inhibitory signal, and a morphogen gra-dient never evolves. Polarised growth on one end of the tissue thus seems a rare evolutionary outcome, given its low frequency even for a simpler selection target.
Our results show that without a superimposed poste-rior morphogen gradient, evolution is unlikely to result in posterior growth and sequential segmentation.
Evolutionary strategies with persistent posterior signal Next, we performed two sets of simulations with a per-sistent posterior signal, in the form of a superimposed posterior morphogen gradient: one set with and one without cell–cell signalling, and both with division noise (Table 2). To achieve this, the posterior-most cell now receives a morphogen that is subject to decay in all cells except this posterior-most cell. In these simulations, we find two qualitatively different strategies. The majority of simulations (53 out of 100) evolves a posterior growth zone combined with sequential segmentation, while the tissue-wide burst with simultaneous segmentation observed in the previous section is now less common (30 out of 100). In the simulations with CCS we also find combinations of the simultaneous and sequential mecha-nism, where the first few segments are generated using a simultaneous mechanism and the remaining segments arise through posterior growth combined with gene expression oscillations (5 simulations).
a
Typically, gene expression oscillations in the growth zone are used to pattern the segments, resembling the mech-anism in vertebrates and arthropods. We distinguish three common variations, differing in the distribution of divisions in space and time (Fig. 6b–d). When growth
proceeds smoothly, the division gene is only regulated (directly or indirectly) by the morphogen (Fig. 6b). Other variants of posterior growth and sequential segmentation show a wavy or even stair-like growth pattern, reflect-ing non-continuous, burst-like division dynamics of the Fig. 5 Selection only for tissue size occasionally yields anterior or posterior growth (transient signal, CCS). Examples of individuals which evolved anterior growth (a), posterior growth (c) or a combination of the two (b) in the absence of selection for segments (as described in the main text). a Anterior growth exploits the fact that the head does not express gene 0 (morphogen) and does not divide; therefore, it accumulates division protein (4). The head thus functions as a signalling centre. c Posterior growth uses the fact that the posterior-most cell has only one neighbouring cell and thus receives less cell–cell signalling. In the networks, the signalling genes 1 and 2 are circled in yellow and the division gene in magenta
(See figure on previous page.)
Fig. 4 With CCS, different segmentation mechanisms can evolve (transient signal, CCS). a This individual uses cell–cell signalling at the boundaries of an emerging segment to split the segments into two. The segmentation gene and the division gene are maintained only in the two boundary cells of this primordial segment, because they receive different inputs from their neighbours. The division gene then generates a new burst of divi-sions in that cell, expanding the single cell into a new segment. This mechanism piqued our interest because it superficially resembles the splitting of the odd stripes in Tribolium [42]. It provides an alternative to Turing-like wave splitting in growing media [34], which uses diffusive signalling over longer distances, while this segment-splitting mechanism uses only direct CCS. Another difference is that in the Turing mechanism, the wave split-ting results from growth, while here segment-splitsplit-ting directs divisions. Although cell divisions are thought to play a minor role in the axis exten-sion of Tribolium, tissue-wide divisions have been observed that could support the segment-splitting mechanism we find here [22]. In Tribolium, however, segment addition happens sequentially, while segment splitting here occurs in simultaneously generated segments. Furthermore, the mechanism in Tribolium is distinctly asymmetric: the secondary stripe that splits off is considerably narrower than the primary stripe. It thus remains an open question which mechanism causes segment doubling in Tribolium: Turing-like, the mechanism described here, or an as yet unidentified mechanism. b This individual uses signalling cues emanating from the static head to stimulate divisions in the cell adjacent to the head. The graph
posterior growth zone. In these cases the division gene itself oscillates, with low amplitude in the wavy pattern or high amplitude in the stair-like pattern (Fig. 6c, d). These oscillations are caused by regulation of the division gene by other genes in the network that are part of the segmentation oscillator. In Additional file 4: Figure S4 we discuss some non-robust cases of sequential segmenta-tion; there, the division gene is itself a part of the oscil-lator, making the oscillator sensitive to the stochastic nature of the divisions.
In the absence of CCS, a posterior morphogen gra-dient improves the developmental robustness of the evolved simultaneous patterning mechanisms (examples in Additional file 3: Figure S3; see Table 2). Cells may use differences in morphogen concentration rather than the differences arising through stochastic cell division for segmental patterning (in fact, now division noise is the source of phenotypic variability, not the patterning mech-anism). While adding CCS to simulations with transient
posterior morphogen decreased phenotypic variability, in the presence of persistent posterior morphogen no fur-ther improvement was observed upon addition of CCS.
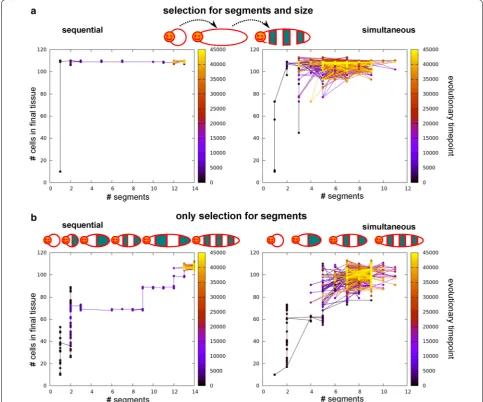
So far, we selected for increasing numbers of seg-ments, thus only implicitly selecting for tissue growth. However, it can be hypothesised that body axis elon-gation—even in the absence of subdivision into seg-ments—already confers an evolutionary advantage. We therefore compare the previously described simulations in which we selected only for segmentation (the set without CCS), to simulations in which we independently select for both axial elongation (to a particular target size) and segmentation. While the number of simula-tions yielding sequential mechanisms is the same (31), we now find that eight simulations yield the combined simultaneous and sequential strategy, and only six simu-lations yield fully simultaneous segmentation. Thus, the bias towards sequential segmentation has become some-what stronger.
a
b
c d
(Fig. 7b). In the simultaneous case, tissue size increases concurrently with segment number, although the evo-lutionary sequence is erratic due to the high phenotypic variability of the segmentation mechanism. At later evo-lutionary time points, we observe a decrease in the vari-ation in tissue size and segment number (Fig. 7b). In the case of sequential segmentation, we instead observe a repeated sequence of first evolving a certain tissue size and subsequently evolving the subdivision of this tissue with an increasing numbers of segments (Fig. 7).
We conclude that, of the possible evolutionary options to segment a tissue, posterior growth coupled Fig. 7 The order of evolutionary events differs between simulations with and without selection for axial extension (persistent signal, no CCS).
Graphs depict the evolution of final tissue size and segment number for one simulation. Left column sequential segmentation, right simultaneous segmentation. The colour of the nodes indicates the evolutionary time point. a Evolutionary trajectories when selecting for axial extension and seg-mentation: tissue size evolves first to target size before segmentation evolves. b Only selection for segments. For sequential segmentation, growth happens in phases. First the available tissue evolves to be filled with segments before tissue size increases further. For simultaneous segmentation, tissue size and number of segments evolve concurrently, but the process is noisy. Note the increased robustness towards the end of the simulation
to sequential segmentation has a higher potential to be a robust patterning mechanism and is capable of gen-erating more and more regularly shaped segments. In addition, when incorporating an ancestral posterior sig-nalling centre involved in body axis polarity, it is also the most likely evolutionary outcome. This likelihood slightly increases when body axis extension evolves prior to segmentation.
Evolving determinate growth
From the previous section, it is clear that posterior growth with sequential segmentation is the most suc-cessful of the possible developmental strategies: it evolves more often, it is able to form many and regularly shaped segments, and it has the potential to be developmen-tally robust. So far, we did not take into account that the evolved sequential segmentation mechanisms do not ter-minate growth at the end of development. Instead they evolve a growth rate that is tuned to allow them to grow to the target size within the constant, superimposed duration of development. If this duration of develop-ment were to be extended, larger individuals with a larger number of segments would automatically arise. While there are indeed bilaterian animals (like many annelids) which do continue growing indefinitely [18], most ani-mals stop growing and making segments, for instance vertebrates and insects have a determinate number of segments and roughly determinate growth. We therefore decided to include selection for determinate growth, by applying a fitness penalty for division during the last 20 time steps (no CCS). (Note that the definition applied here for determinate and indeterminate growth is some-what different from definitions used elsewhere [35]. See also the Fig. 2).
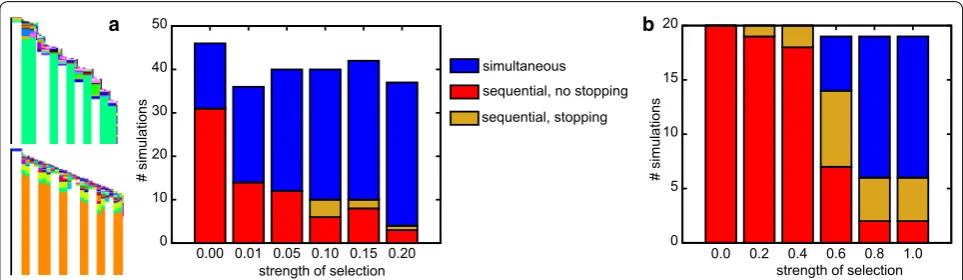
With increasing strength of this evolutionary pres-sure, a larger fraction of simulations yields simultaneous growth and segmentation, until the bias is completely reversed (Fig. 8a). In a subset of simulations stair-like sequential growth evolves, which allows for sequential growth while circumventing the fitness cost of late-stage divisions. Only very rarely (max 4 out of 50) does a simu-lation yield sequential segmentation with a mechanism that leads to the controlled halting of growth (Fig. 8a, example space–time plots).
We reason that by applying the selection for deter-minate growth from the start of the simulation, we implicitly select for simultaneous growth, which is indeed determinate. To prevent this bias, sequential segmentation would have to have evolved before the appearance of this selection pressure. It also seems biologically reasonable to assume that determinate growth is a secondary trait: when comparing seg-mented animals with indeterminate and determinate
growth, it seems that at least in arthropods the clades with determinate growth have more evolutionary derived, complex body plans. We speculate that deter-minate growth becomes more important upon evolu-tion of segment specificaevolu-tion, where e.g. locomotive appendages are limited to trunk segments and the abdomen is unsupported. To test the idea of second-ary selection for determinate growth, we extract indi-viduals from 20 earlier simulations in which sequential segmentation evolved without the pressure to stop growing; then we continue their evolution in the pres-ence of this pressure. The outcome of these continued simulations depends on the strength of the evolution-ary pressure to stop growing. If the pressure is too low, determinate growth does not evolve often (Fig. 8b). If instead the pressure is too high, the potential for growth and segmentation is often transiently lost after which a simultaneous mechanism evolves instead; we do not observe smooth transitions from sequen-tial to simultaneous segmentation (Fig. 8b). However, between these two extremes lies a parameter region in which one-third of simulations evolve the capacity to stop growing while maintaining posterior growth and sequential segmentation (Fig. 8b). Thus, our hypoth-esis is confirmed, delaying selection for determinate tissue growth to a later evolutionary stage does indeed more often yield the evolution of sequential growth and segmentation combined with determinate growth.
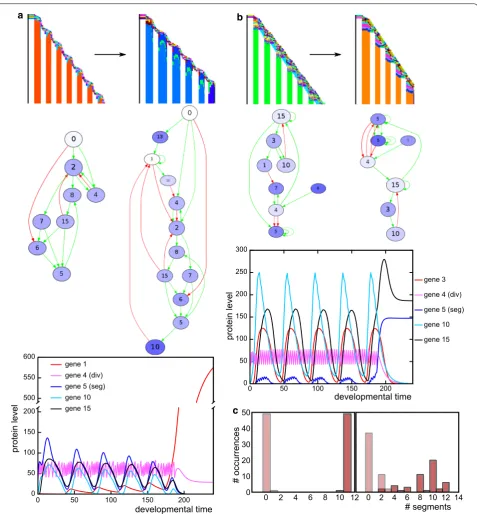
In some of the cases where determinate growth evolves, the functional gene regulatory network expands to include a control gene. The expression of this con-trol gene slowly increases over time until it passes a threshold and shuts down the division gene (Fig. 9a). This becomes evident in the different gene expres-sion pattern in the last segment (Fig. 9a). More often, however, the stopping mechanism relies on an oscillat-ing gene that passes a threshold due to the slight sto-chasticity in divisions and shuts down the division gene (Fig. 9b). This latter mechanism yields large phenotypic variability, while the former mechanism is more reliable (Fig. 9c).
Discussion
A number of previous modelling studies have looked into the evolution of segmentation (see [36] for review) [24,
25, 29]. These studies mainly focused on the evolution of sequential segmentation (as in vertebrates or short-germ insects) versus simultaneous segmentation (long-germ insect, Drosophila-like), investigating their similarities and suggesting potential evolutionary transitions. In the current study, we took a somewhat different approach, focusing on factors that may have contributed to the like-lihood of evolving sequential segmentation. We aimed to explain its dominance as a segmentation mechanism and the order of events through which it arose. Taking a “worse-case approach”, we maximally allowed alternative mechanisms to evolve and then determined under which conditions posterior growth and sequential segmentation predominates (Fig. 10).
We found one main alternative developmental strategy besides sequential segmentation: simultaneous segmen-tation, in which after a short tissue-wide burst of divi-sions all segments appears roughly at the same time. This simultaneous mechanism is not similar to Drosophila -like segmentation, where a hierarchy of gene regulation robustly creates regular-sized segments. Note that the Drosophila strategy likely evolved secondarily, from an initial sequential segmentation mode, so one should nei-ther aim nor expect a Drosophila-like segmentation to evolve from scratch in our simulations. Rather, the evolu-tion of a quite different type of simultaneous segmenta-tion in our simulasegmenta-tions is a result of the freedom of the evolutionary process, which we use to distinguish evolu-tionary scenarios. The simultaneous strategy that evolved in our simulations generates irregularly sized segments, and the number of segments in genotypically identical
individuals tends to be variable. In contrast, the evolved sequential segmentation generates a large number of reg-ularly sized segments in a robust, reproducible manner, thus leading to larger fitness values at the end of evolu-tionary simulations. A number of subtypes of posterior growth and sequential segmentation evolved; the most notable mechanism involves regular, segmental oscilla-tion-dependent bursts of cell division in which two seg-ments are down simultaneously—another benefit of the larger degrees of freedom of the model.
Stable posterior signalling is a prerequisite for sequen-tial segmentation We showed that evolution of terminal addition type posterior growth is highly unlikely in the absence of persistent posterior signalling, independ-ent of whether we selected for segmindepend-entation or body axis elongation. Under these conditions, the potential for symmetry breaking is restricted to the early phases of development, generating a bias in favour of an early tissue-wide burst of divisions and against posterior growth. In the absence of cell–cell signalling, simula-tions relied on the stochasticity of divisions to generate segments. In the presence of cell–cell signalling, lateral inhibition type patterning is used to pattern segments during the tissue-wide division burst. Our results thus suggest that the evolution of a posterior signalling cen-tre is a crucial prerequisite for the evolution of posterior growth and sequential segmentation. Given the pres-ence of a posterior signalling centre in all bilaterians as well as cnidarians, it can be safely assumed to represent an ancestral property [27, 37, 38]. Thus, we can reformu-late our findings and state instead that the prior evolution of a posterior signalling centre provided a strong bias towards the evolution of posterior growth and sequential segmentation.
a b
a b
c
Fig. 10 Summary of conclusions. Flowchart summarising the results of different simulations. Note that the arrows only indicate the majority of simulations in a set, e.g. persistent posterior signal without determinate growth selection occasionally yields simultaneous growth as well
Determinate growth as a secondary trait In simulations incorporating a persistent posterior morphogen signal, selection for determinate growth completely reversed the evolutionary bias from sequential to simultaneous seg-mentation. We found that to evolve posterior yet deter-minate growth, the selection for deterdeter-minate growth had to occur secondarily, after the evolution of posterior growth and sequential segmentation. Simple segmented animals such as millipedes and annelids contain large numbers of highly similar segments, and many anne-lids appear to keep adding segments throughout their life [18]. In contrast, insects and vertebrates develop a smaller, constant number of highly specialised segments after which posterior growth is terminated. We thus hypothesise that a constant segment number evolved secondarily and was only selected for once segment spe-cialisation arose and locomotive capabilities became restricted to a limited number of segments. Consistent with this, HOX genes, which are crucial in segment spe-cialisation, appear to be involved in terminating posterior growth [39]. As an intermediate form, myriapods and the
extinct trilobites stop adding segments when reaching maturity, but the final number of segments is variable [9]. This has been linked to their limited segment speciali-sation, where the exact number of segments is not that important. This is reminiscent of the form of determi-nate growth that evolves in our simulations, which is not robust and yields variable segment numbers.
of determinate growth in unsegmented and metameric organisms can be explained by the presence of a bilaterian ancestor displaying terminal addition, sequential segmen-tation and determinate growth with many lineages subse-quently completely or partly losing segmentation. Finally, a less parsimonious scenario involves an unsegmented, indeterminately growing bilaterian ancestor, with parallel evolution of either determinate growth alone, or following sequential segmentation in several lineages.
In our current model we observed two mechanisms to stop posterior growth: one depending on stochastic changes in an oscillating gene, making it very non-robust, and the other depending on the gradual build-up of a slowly decaying gene, yielding lower phenotypic variabil-ity. This latter strategy resembles a hypothetical mecha-nism proposed by Meinhardt for the sequential activation of HOX genes [30, 40]. Considering the origin of the HOX cluster from tandem duplication of an early HOX gene [41], it can be envisioned that an early gene involved in regulating growth became transformed through dupli-cation into a sequentially activated HOX cluster in which gene order (i.e. posterior-most HOX gene active) rather than level of a single gene now can act as a robust growth termination criterion. An interesting subject for future studies would thus be to investigate whether under com-bined selection for both segmentation and HOX-like specialisation domains, a HOX-type control of growth evolves. Such evolutionary outcomes may provide impor-tant answers in the puzzle of how the complex hierarchi-cal network of Drosophila evolved from a sequentially segmenting predecessor; given the relatedness of gap and HOX genes and the suggested ancestral role for gap genes in growth control.
Conclusions
In summary, we proposed an order of evolutionary events and selection pressures involved in generating poste-rior growth, sequential segmentation and determinate growth. First, we provided evidence that the prior evo-lution of a stable posterior signalling centre has played a decisive role in evolving terminal addition and sequen-tial segmentation. Then, we showed that the evolution of sequential segmentation combined with determinate growth can only take place by adding the selection pres-sure for determinate growth secondarily. Our study dem-onstrates that varying the onset of selection pressures
can be a powerful tool in investigating the likely order of evolutionary events.
Additional files
Additional file 1: Figure S1. Cell-cell signalling allows for robust development in the absence of posterior morphogen (but not always) (transient signal, CCS). A) This individual evolved to be very robust. It usu-ally makes eight segments and only in rare cases seven good segments and one short segment. B) This individual did not evolve to become very robust despite the presence of cell–cell signalling genes. Nevertheless, it is usually able to make many more segments than the individuals evolved without cell–cell signalling. The histograms represent the variation in phe-notypic outcome when an individual{\rsquo}s development is repeated 50 times. In the histograms, the dark bars represent the good segments and the lighter bars the too short segments. See “Methods” for further explanation.
Additional file 2: Figure S2. Very rare evolution of posterior growth in the absence of persistent posterior signal (CCS, no noise) A) This individual first creates a small pool of five cells in an initial burst, which subsequently become completely inert (the black cells in the left space–time plot). The sixth cell, which is still in contact with the head, gets induced via CCS (gene 1, circled in yellow in the network) to initiate another burst of divisions, and these cells form the first two segments (high -> green; and low -> blue) next to the head (see cartoon). When these new segments mature, there is a short time window in which the most anterior of the five posterior inert cells gets induced to initiate a new burst. Thus, the posterior pool gets depleted by one cell with each burst, putting a stop to the growth process. (Note the shortening of the dark, non-dividing region in the space-time plots) In the network, the division gene is circled in magenta and the segmentation gene in blue. B) This mechanism arises very late in evolution, from a simultaneously segmenting individual. Additional file 3: Figure S3. Simultaneous segmentation with persistent posterior morphogen can be more robust than with transient signal (no CCS) A comparison between transient and persistent posterior morphogen on the evolved simultaneous mechanisms. Those evolved with persistent signalling are capable of making more segments and are sometimes very robust. When they are not robust, they still manage to make more segments on average. Note that the second individual with transient signalling may be robust, but this means it usually makes just two segments.
Abbreviations
CCS: cell–cell signalling; TF: transcription factor; TFBS: transcription factor binding site.
Authors’ contributions
RMAV and KHWJT designed the study, RMAV performed the simulations, and RMAV, PH and KHWJT analysed the results and wrote the manuscript. All authors read and approved the manuscript.
Acknowledgements
We thank Enrico Sandro Colizzi, Hilje Doekes, Bram van Dijk, Rutger Hermsen and Thomas Cuypers for helpful suggestions and discussion of the manuscript.
Competing interests
The authors declare that they have no competing interests.
Funding
RMAV was supported by the “Focus en Massa” program from Utrecht Univer-sity. The funding body had no role in the design of the study, collection and analysis of the data, or writing of the manuscript.
Received: 21 April 2016 Accepted: 13 July 2016
References
1. Davis GK, Patel NH. The origin and evolution of segmentation. Trends Genet. 1999;15(12):68–72. doi:10.1016/S0168-9525(99)01875-2. 2. Balavoine G, Adoutte A. The segmented urbilateria: a testable scenario.
Integr Comp Biol. 2003;43(1):137–47. doi:10.1093/icb/43.1.137. http://icb. oxfordjournals.org/content/43/1/137.full.pdf+html.
3. Peel A, Akam M. Evolution of segmentation: rolling back the clock. Curr Biol. 2003;13(18):708–10. doi:10.1016/j.cub.2003.08.045.
4. Couso JP. Segmentation, metamerism and the Cambrian explosion. Int J Dev Biol. 2009;53:1305–16. doi:10.1387/ijdb.072425jc.
5. Budd GE. Why are arthropods segmented? Evol Dev. 2001;3(5):332–42. doi:10.1046/j.1525-142X.2001.01041.x.
6. Seaver EC. Segmentation: mono- or polyphyletic? Int J Dev Biol. 2003;47:583–95.
7. Minelli A, Fusco G. Evo-devo perspectives on segmentation: model organisms, and beyond. Trends Ecol Evol. 2004;19(8):423–9. doi:10.1016/j. tree.2004.06.007.
8. Tautz D. Segmentation. Dev Cell. 2004;7(3):301–12. doi:10.1016/j. devcel.2004.08.008.
9. Jacobs DK, Hughes NC, Fitz-Gibbon ST, Winchell CJ. Terminal addition, the cambrian radiation and the phanerozoic evolution of bilaterian form. Evol Dev. 2005;7(6):498–514. doi:10.1111/j.1525-142X.2005.05055.x.
10. Blair SS. Segmentation in animals. Curr Biol. 2008;18(21):991–5. doi:10.1016/j.cub.2008.08.029.
11. Wanninger A, Kristof A, Brinkmann N. Sipunculans and segmentation. Commun Integr Biol. 2009;2(1):56–9. doi:10.4161/cib.2.1.7505. 12. Chipman AD. Parallel evolution of segmentation by co-option of
ances-tral gene regulatory networks. BioEssays. 2010;32(1):60–70. doi:10.1002/ bies.200900130.
13. Richmond DL, Oates AC. The segmentation clock: inherited trait or universal design principle? Curr Opin Genet Dev. 2012;22(6):600–6. doi:10.1016/j.gde.2012.10.003 (Genetics of system biology).
14. Gold DA, Runnegar B, Gehling JG, Jacobs DK. Ancestral state reconstruc-tion of ontogeny supports a bilaterian affinity for Dickinsonia. Evol Dev. 2015;17(6):315–24. doi:10.1111/ede.12168.
15. Rivera A, Weisblat D. And Lophotrochozoa makes three: Notch/Hes signaling in annelid segmentation. Dev Genes Evol. 2009;219(1):37–43. doi:10.1007/s00427-008-0264-6.
16. Williams T, Blachuta B, Hegna TA, Nagy LM. Decoupling elongation and segmentation: Notch involvement in anostracan crustacean segmenta-tion. Evol Dev. 2012;14(4):372–82. doi:10.1111/j.1525-142X.2012.00555.x.
17. Shankland M, Seaver EC. Evolution of the bilaterian body plan: what have we learned from annelids? Proc Natl Acad Sci. 2000;97(9):4434–7. doi:10.1073/pnas.97.9.4434. http://www.pnas.org/content/97/9/4434.full. pdf.
18. Balavoine G. Segment formation in annelids: patterns, processes and evolution. Int J Dev Biol. 2014;58:469–83. doi:10.1387/ijdb.140148gb. 19. Peel A. The evolution of arthropod segmentation mechanisms. BioEssays.
2004;26(10):1108–16. doi:10.1002/bies.20097.
20. Bénazéraf B, Pourquié O. Formation and segmentation of the verte-brate body axis. Annu Rev Cell Dev Biol. 2013;29(1):1–26. doi:10.1146/ annurev-cellbio-101011-155703.
21. Mayer G, Kato C, Quast B, Chisholm RH, Landman KA, Quinn LM. Growth patterns in onychophora (velvet worms): lack of a local-ised posterior proliferation zone. BMC Evol Biol. 2010;10(339):1–12. doi:10.1186/1471-2148-10-339.
22. Nakamoto A, Hester SD, Constantinou SJ, Blaine WG, Tewksbury AB, Matei MT, Nagy LM, Williams TA. Changing cell behaviours during beetle embryogenesis correlates with slowing of segmentation. Nat Commun. 2015;6(6635):1–9. doi:10.1038/ncomms7635.
23. Graham A, Butts T, Lumsden A, Kiecker C. What can vertebrates tell us about segmentation? EvoDevo. 2014;. doi:10.1186/2041-9139-5-24. 24. François P, Hakim V, Siggia ED. Deriving structure from evolution:
meta-zoan segmentation. Mol Syst Biol. 2007. doi:10.1038/msb4100192. 25. Fujimoto K, Ishihara S, Kaneko K. Network evolution of body plans. PLoS
One. 2008;3(7):2772. doi:10.1371/journal.pone.0002772. 26. ten Tusscher KH, Hogeweg P. Evolution of networks for body plan
patterning; interplay of modularity, robustness and evolvability. PLoS Comput Biol. 2011;7(10):1002208. doi:10.1371/journal.pcbi.1002208. 27. Niehrs C. On growth and form: a cartesian coordinate system of wnt
and bmp signaling specifies bilaterian body axes. Development. 2010;137(6):845–57. doi:10.1242/dev.039651. http://dev.biologists.org/ content/137/6/845.full.pdf.
28. Crombach A, Hogeweg P. Evolution of evolvability in gene regula-tory networks. PLoS Comput Biol. 2008;4(7):1–13. doi:10.1371/journal. pcbi.1000112.
29. Salazar-Ciudad I, Newman SA, Solé RV. Phenotypic and dynami-cal transitions in model genetic networks I. Emergence of patterns and genotype–phenotype relationships. Evol Dev. 2001;3(2):84–94. doi:10.1046/j.1525-142x.2001.003002084.x.
30. Meinhardt, H.: Models of biological pattern formation. London: Academic Press; 1982. http://www.eb.tuebingen.mpg.de/research/emeriti/hans-meinhardt/82-book/bur82.html
31. Pankratz MJ, Jäckle H. Making stripes in the drosophila embryo. Trends Genet. 1990;6:287–92. doi:10.1016/0168-9525(90)90234-W.
32. Aulehla A, Pourquié O. Signaling gradients during paraxial meso-derm development. Cold Spring Harbor Perspect Biol. 2010;2(2):1–17. doi:10.1101/cshperspect.a000869. http://cshperspectives.cshlp.org/ content/2/2/a000869.full.pdf+html.
33. Mallo M, Alonso CR. The regulation of hox gene expression during animal development. Development. 2013;140(19):3951–63. doi:10.1242/ dev.068346. http://dev.biologists.org/content/140/19/3951.full.pdf. 34. Crampin EJ, Hackborn WW, Maini PK. Pattern formation in reaction– diffusion models with nonuniform domain growth. Bull Math Biol. 2002;64(4):747–69. doi:10.1006/bulm.2002.0295.
35. Harper JL, Rosen BR, White J. Growth and form of modular organisms. Philos Trans R Soc Lond. 1986;313(1159):1–250.
36. ten Tusscher KHWJ. Mechanisms and constraints shaping the evolution of body plan segmentation. Eur Phys J E. 2013;36(5):1–12. doi:10.1140/ epje/i2013-13054-7.
37. Petersen CP, Reddien PW. Wnt signaling and the polarity of the primary body axis. Cell. 2009;139(6):1056–68. doi:10.1016/j.cell.2009.11.035. 38. Martin BL, Kimelman D. Wnt signaling and the evolution of embryonic
posterior development. Curr Biol. 2009;19(5):215–9. doi:10.1016/j. cub.2009.01.052.
39. Young T, Rowland JE, van de Ven C, Bialecka M, Novoa A, Carapuco M, van Nes J, de Graaff W, Duluc I, Freund J-N, Beck F, Mallo M, Deschamps J. Cdx and hox genes differentially regulate posterior axial growth in mammalian embryos. Dev Cell. 2009;17(4):516–26. doi:10.1016/j. devcel.2009.08.010.
• We accept pre-submission inquiries
• Our selector tool helps you to find the most relevant journal • We provide round the clock customer support
• Convenient online submission • Thorough peer review
• Inclusion in PubMed and all major indexing services • Maximum visibility for your research
Submit your manuscript at www.biomedcentral.com/submit
Submit your next manuscript to BioMed Central
and we will help you at every step:
semcdb.2015.06.005 (Claudins and time, space and the vertebrate body axis).
41. Kappen C, Schughart K, Ruddle FH. Two steps in the evolution of Antennapedia-class vertebrate homeobox genes. Proc Natl Acad Sci USA. 1989;86:5459–63.