Has Business Segment Disclosures under SFAS
No. 131 Improved in the Last Ten Years? (2013-2004)
Robert D Bell1
1 Accounting and Finance Department, College of Saint Benedict/Saint John's University, United States
Correspondence: Robert D Bell, Accounting and Finance Department, College of Saint Benedict/Saint John's University, United States. E-mail: rbell@csbsju.edu
Received: February 24, 2015 Accepted: March 28, 2015 Online Published: April 5, 2015 doi:10.5430/afr.v4n2p78 URL: http://dx.doi.org/10.5430/afr.v4n2p78
Abstract
The purpose of the paper is to determine if business segment disclosures under SFAS No. 131 has improved in the last ten years. The paper analyzes ten years (2013-2004) of segment disclosures of 200 of the Fortune 500 listed companies reporting under SFAS No. 131. For each of these ten years, the analysis specifically includes the number of segments reported; the number of companies which changed the name of one or more of their segments; the number of actual line-items reported for each segment; the general category of line-items reported for each segment; the number of geographic areas reported; the names of geographic areas reported; and the names of countries reported. The paper finds that segment disclosure practices have remained virtually unchanged over this ten year period—thus calling into question whether SFAS No. 131 is truly achieving its purposes, as the Financial Accounting Foundation (FAF) stated it is in its January of 2013 post-implementation review (PIR) of SFAS No. 131.
Keywords: Segment disclosure, SFAS No. 131, Separate lines of business, Line of business reporting 1. Introduction
In June of 1997, the Financial Accounting Standards Board (FASB) issued Statement of Financial Accounting Standards (SFAS) No. 131, Disclosures about Segments of an Enterprise and Related Information, to improve the way public companies report financial information about their business segments. SFAS No. 131 became effective for fiscal years beginning after December 15, 1997 and superseded FASB’s prior pronouncement on segment reporting disclosure, SFAS No. 14, Financial Reporting for Segments of a Business Enterprise.
SFAS No. 131 established standards for the way public companies report information about operating segments in annual financial statements and requires that those companies report selected information about operating segments in interim financial reports issued to shareholders. It also established standards for related disclosures about products and services, geographic areas, and major customers.
SFAS No. 131 was codified by the FASB in Accounting Standards Codification (ASC) 280, Segment Reporting, and became effective for interim and annual periods beginning after September 15, 2009.
In January 2013, the Financial Accounting Foundation (FAF) completed a post-implementation review (PIR) of SFAS No. 131 and concluded that SFAS No. 131 generally achieves its purposes. The FAF concluded that SFAS No. 131 provides more information about companies’ different business activities than the prior segment reporting standard did, and overall, SFAS No. 131 enhanced the relevance of segment disclosures.
In particular, the FAF’s PIR of SFAS No. 131 stated that: Since companies adopted Statement 131:
Companies are reporting segment information in interim financial statements, enhancing the timeliness of segment disclosures.
The amount of disaggregated segment information has increased. Many companies report more segments than they did prior to Statement 131 (although there are indications that some companies might not report a sufficient number of segments).
2. Review of Literature on Segment Disclosures
Much of the prior research on the effectiveness of SFAS No. 131 focuses on analyzing segment disclosure under SFAS No. 14 compared to disclosure under SFAS No. 131. Berger and Hann [2003] find that SFAS No. 131 increased the number of reported segments and provided more disaggregated information, which resulted in a significant improvement in analysts’ ability to forecast earnings.
Herrmann and Thomas [2000] find that when comparing disclosure under SFAS No. 14 to disclosure under SFAS No. 131, two-thirds of the 100 companies in their sample redefined their primary operating segments. They also find an increase in the number of companies providing segment disclosures; companies are disclosing more items for each segment; the proportion of country-level geographic segment disclosure increased, while the proportion of broader geographic area segment disclosures has decreased; the number of companies reporting earnings by geographic area has declined greatly as the item is no longer required to be disclosed for companies reporting under SFAS No. 131 on a basis other than geographic area.
Street, Nichols, and Gray [2000] compares disclosure under SFAS No. 14 to disclosure under SFAS No. 131 to determine if SFAS No. 131 has resulted in (1) a greater number of line-of-business segments, (2) more items of information for each segment, and (3) improved consistency of segment information with other parts of the annual report. They find that the number of segments reported and the consistency of information increased significantly in the year the company adopted SFAS No.131.
This research differs from prior research by focusing exclusively on reporting of business segment disclosure under SFAS No. 131 over the last ten years (2013-2004). SFAS No. 131 was implemented in 1998 and prior research, as well as the FAF’s PIR, largely focuses on enhancements in disclosure from SFAS No. 14 to SFAS No. 131, rather than whether SFAS No. 131 has improved business segment disclosure of the last ten years.
3. Research Questions
To determine whether business segment disclosures under SFAS No. 131 have improved over the last ten years (2013-2004), the current study addresses the following research questions:
How many segments were reported by companies over each of the previous ten years?
How many companies changed the name of one or more of their segments over each of the previous ten years?
How many actual line-items were reported for each segment by companies over each of the previous ten years?
How many general line-items were reported for each segment by companies over each of the previous ten years?
How many geographic areas were reported by companies over each of the previous ten years? Which specific geographic areas were reported by companies over each of the previous ten years? Which specific countries were reported by companies over each of the previous ten years? 4. Sample Selection and Methodology
Segment disclosure was collected from 200 of the Fortune 500 listed companies. Initial companies selected for the sample included companies with (1) a December 31 year-end; (2) ten years of reporting on Form 10-K with the U.S. Securities and Exchange Commission’s (SEC) Electronic Data Gathering, Analysis, and Retrieval (EDGAR) system; and (3) excluded financial institutions such as traditional banks, investment banks, and mortgage companies. Subsequent research to arrive at 200 companies included companies with 2013 fiscal year-ends falling within 2014 and who file their annual report on Form 10-K with the SEC. This research continued to exclude financial institutions such as traditional banks, investment banks, and mortgage companies.
To determine the number of business segments for each company, research looked to the disclosure required in the notes to the financial statements under Rules 3-03 and 12-16 of Regulation S-X, as well as in the business section under Item 1 of Form 10-K as required by Items 101 and 102 of Regulation S-K.
5. Findings and Discussion
5.1 How many segments were reported by companies over each of the previous ten years?
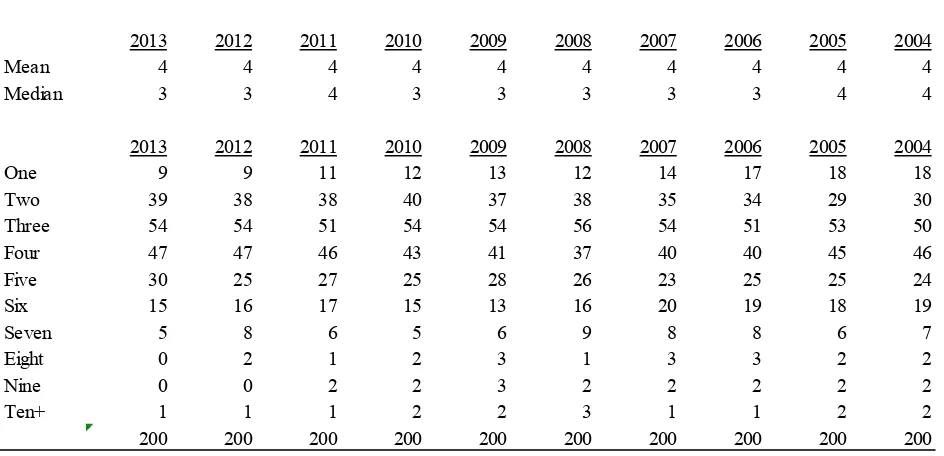
Table 1 indicates that the mean and median number of segments disclosed under SFAS No. 131 has remained virtually unchanged over the previous ten years. Companies reported a mean of four segments every year for the past ten years, and a median of three segments per year every year, save for 3 years (2011, 2005 and 2004) when they reported a median of four segments.
Table 1 also provides the specific number of segments disclosed by each of the 200 companies over the previous ten years. Analysis of this table reveals that while there has been some fluctuation and improvement in the specific number of segments reported by companies over the last ten years, the overall number of segments reported has remained virtually unchanged.
For example, 18 of the 200 companies provided segment disclosure on only one segment in 2004 (meaning they provided no segment disclosure) whereas that number dropped to 9 companies in 2013. This drop appears to supports the argument that SFAS No. 131 has worked to provide more segment disclosure over the past ten years. When looking at the overall trends, however, companies disclosing three or four segments have remained virtually unchanged, and the number of companies disclosing six or more segments have all declined.
Table 2 provides the specific number of segments disclosed by each of the 200 companies over the previous ten years as a percentage of the 200 companies. Analysis of this table reveals that the percentage of companies disclosing three or four segments has remained virtually unchanged. In 2004, 25% of companies in the sample disclosed three segments, and in 2013 that number increased only 2% to 27%. Similarly, in 2004, 23% of companies in the sample disclosed four segments, and in 2013 that number increased only 1% to 24%.
Table 1. Specific Number of Segments Disclosed
2013 2012 2011 2010 2009 2008 2007 2006 2005 2004
Mean 4 4 4 4 4 4 4 4 4 4
Median 3 3 4 3 3 3 3 3 4 4
2013 2012 2011 2010 2009 2008 2007 2006 2005 2004
One 9 9 11 12 13 12 14 17 18 18
Two 39 38 38 40 37 38 35 34 29 30
Three 54 54 51 54 54 56 54 51 53 50
Four 47 47 46 43 41 37 40 40 45 46
Five 30 25 27 25 28 26 23 25 25 24
Six 15 16 17 15 13 16 20 19 18 19
Seven 5 8 6 5 6 9 8 8 6 7
Eight 0 2 1 2 3 1 3 3 2 2
Nine 0 0 2 2 3 2 2 2 2 2
Ten+ 1 1 1 2 2 3 1 1 2 2
And while companies in the sample reporting only one business segment (meaning no segment disclosure) decreased from 9% in 2004 to 5% in 2013, the percentage of companies reporting six or more segments all declined.
Tables 1 and 2 therefore indicate that SFAS No. 131 is not working because the number of segments disclosed under has remained virtually unchanged over the previous ten years.
5.2 How many companies changed the name of one or more of their segments over each of the previous ten years? Tables 3 and 4 indicate the number of companies that changed the name of one or more of their segments over each of the previous ten years. Table 4 provides this information on a numbers basis, and Table 5 provides this information on a percentage basis, based on the 200 companies in the sample.
Analysis of Tables 3 and 4 reveals that the number of companies that changed the name of one or more of their segments over each of the previous ten years has remained virtually unchanged. Table 4 shows that 49 companies in the sample 200 companies changed the name of one or more of their segments in 2004, and 53 companies changed the name of at least one of their segments in 2013, with only modest fluctuation over the years. The greatest fluctuation was in 2005 and 2006 where 64 and 65 companies, respectively, changed the name of one or more of their segments.
Table 4 shows that on a percentage basis, however, the number of companies that changed the name of at least one segment has remained virtually unchanged over the past ten years. In 2004, 25% of companies changed the name of one or more of their segments in that year, and in 2013, that number changed by only 2% to 27%, with 76% in 2004 of companies not changing the names of one or more of their segments, and only 2% decline to 74% doing so in 2013.
Tables 3 and 4 indicate that SFAS No. 131 is not working because the number companies that have changed the name of one or more of their segments over each of the previous ten years has remained virtually unchanged.
Table 2. Specific Number of Segments Disclosed (as a percentage)
2013 2012 2011 2010 2009 2008 2007 2006 2005 2004
One 5% 5% 6% 6% 7% 6% 7% 9% 9% 9%
Two 20% 19% 19% 20% 19% 19% 18% 17% 15% 15%
Three 27% 27% 26% 27% 27% 28% 27% 26% 27% 25%
Four 24% 24% 23% 22% 21% 19% 20% 20% 23% 23%
Five 15% 13% 14% 13% 14% 13% 12% 13% 13% 12%
Six 8% 8% 9% 8% 7% 8% 10% 10% 9% 10%
Seven 3% 4% 3% 3% 3% 5% 4% 4% 3% 4%
Eight 0% 1% 1% 1% 2% 1% 2% 2% 1% 1%
Nine 0% 0% 1% 1% 2% 1% 1% 1% 1% 1%
Ten+ 1% 1% 1% 1% 1% 2% 1% 1% 1% 1%
100% 100% 100% 100% 100% 100% 100% 100% 100% 100%
Table 3. Changed of at Least One Segment Name from Prior Year
2013 2012 2011 2010 2009 2008 2007 2006 2005 2004
Yes 53 56 54 40 51 55 55 65 64 49
No 147 144 146 160 149 145 145 135 136 151
200 200 200 200 200 200 200 200 200 200
Table 4. Changed of at Least One Segment Name from Prior Year (as a percentage)
2013 2012 2011 2010 2009 2008 2007 2006 2005 2004
Yes 27% 28% 27% 20% 26% 28% 28% 33% 32% 25%
No 74% 72% 73% 80% 75% 73% 73% 68% 68% 76%
5.3 How many actual line-items were reported for each segment by companies over each of the previous ten years? Tables 5 and 6 indicate the actual line-items reported for each segment by companies over each of the previous ten years. Table 5 provides the mean and median actual line-items reported for each segment by companies over each of the previous ten years, and Table 6 provides this information on a percentage basis based on the 200 companies in the sample.
Analysis of Table 5 reveals that the mean and median actual line-items reported for each segment by companies over each of the previous ten years has remained unchanged at a mean of seven and a median of six actual line-items reported. In 2004, 45 companies disclosed five line-items in the notes to their financial statements on their Form 10-K, and in 2013 the number remained the same at 45 companies.
Similarly, Table 6 shows that on a percentage basis, 23% of companies in 2004 disclosed five line-items in the notes to their financial statements on their Form 10-K, and in 2013 the number remained the same at 23%.
Table 5. Actual Number of Line-Items Disclosed for Each Segment
2013 2012 2011 2010 2009 2008 2007 2006 2005 2004
Mean 7 7 7 7 7 7 7 7 7 7
Median 6 6 6 6 6 6 6 6 6 6
2013 2012 2011 2010 2009 2008 2007 2006 2005 2004
One 12 10 12 14 14 14 15 16 17 19
Two 7 6 5 5 5 5 4 4 4 5
Three 3 3 3 2 4 3 4 6 5 6
Four 8 10 9 6 5 5 6 6 6 5
Five 45 46 48 50 52 50 47 49 45 45
Six 29 30 32 28 29 31 32 30 35 35
Seven 26 25 24 25 23 17 18 20 22 17
Eight 14 13 13 14 13 17 20 18 15 16
Nine 10 9 11 10 13 17 12 11 11 16
Ten 12 11 9 11 10 9 8 7 9 10
Eleven 12 15 12 9 9 10 11 10 9 4
Twelve 4 3 4 6 5 4 4 4 5 6
Thirteen 8 7 7 8 9 7 4 5 3 3
Fourteen 3 5 5 5 2 2 2 4 4 6
Fifteen 2 1 0 2 1 1 4 2 5 1
Sixteen 2 1 1 1 1 1 3 1 3 2
Seventeen 1 2 2 1 2 2 3 4 0 1
Eighteen 0 1 1 1 1 2 1 1 1 1
Nineteen 0 1 1 1 0 0 0 0 1 1
Twenty+ 2 1 1 1 2 3 2 2 0 1
Tables 5 and 6 indicate that SFAS No. 131 is not working because the actual number of line-items reported for each segment by companies over each of the previous ten years has remained virtually unchanged.
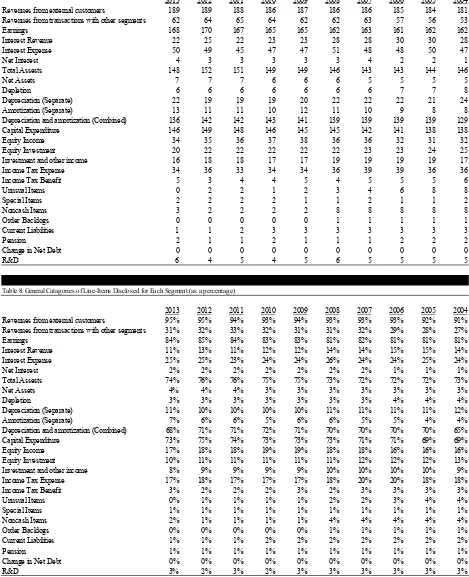
5.4 How many general line-items were reported for each segment by companies over each of the previous ten years? Tables 7 and 8 indicate the general line-items reported for each segment by companies over each of the previous ten years. Table 7 provides the specific number of general line-items reported for each segment by companies over each of the previous ten years, and Table 8 provides this information on a percentage basis based on the 200 companies in the sample.
The purpose of these two tables is to provide an element of uniformity among the companies in their segment disclosure. For example, some companies breakdown their revenues into several line-items. Tables 7 and 8, therefore, treats all revenue line-items as only one line-item, regardless of how many different line-items a company uses when it breaks down its revenues.
Analysis of Table 7 reveals that the number of companies that disclosed revenues from external customers, interest revenue, total assets, depreciation, and capital expenditures has remained virtually unchanged over the past ten years. For example, 181 of the companies disclosed revenues from external customers in 2004, and in 2013 the number was 189. Likewise, 146 of the companies disclosed net assets in 2004, and in 2013 the number was 148, virtually unchanged.
Table 6. Actual Number of Line-Items Disclosed for Each Segment (as a percentage)
2013 2012 2011 2010 2009 2008 2007 2006 2005 2004
One 6% 5% 6% 7% 7% 7% 8% 8% 9% 10%
Two 4% 3% 3% 3% 3% 3% 2% 2% 2% 3%
Three 2% 2% 2% 1% 2% 2% 2% 3% 3% 3%
Four 4% 5% 5% 3% 3% 3% 3% 3% 3% 3%
Five 23% 23% 24% 25% 26% 25% 24% 25% 23% 23%
Six 15% 15% 16% 14% 15% 16% 16% 15% 18% 18%
Seven 13% 13% 12% 13% 12% 9% 9% 10% 11% 9%
Eight 7% 7% 7% 7% 7% 9% 10% 9% 8% 8%
Nine 5% 5% 6% 5% 7% 9% 6% 6% 6% 8%
Ten 6% 6% 5% 6% 5% 5% 4% 4% 5% 5%
Eleven 6% 8% 6% 5% 5% 5% 6% 5% 5% 2%
Twelve 2% 2% 2% 3% 3% 2% 2% 2% 3% 3%
Thirteen 4% 4% 4% 4% 5% 4% 2% 3% 2% 2%
Fourteen 2% 3% 3% 3% 1% 1% 1% 2% 2% 3%
Fifteen 1% 1% 0% 1% 1% 1% 2% 1% 3% 1%
Sixteen 1% 1% 1% 1% 1% 1% 2% 1% 2% 1%
Seventeen 1% 1% 1% 1% 1% 1% 2% 2% 0% 1%
Eighteen 0% 1% 1% 1% 1% 1% 1% 1% 1% 1%
Nineteen 0% 1% 1% 1% 0% 0% 0% 0% 1% 1%
Twenty+ 1% 1% 1% 1% 1% 2% 1% 1% 0% 1%
Similarly, Table 8 shows that on a percentage basis, 91% of companies in 2004 disclosed revenues from external companies, and in 2013 the number remained virtually unchanged at 95%. Likewise, 73% of companies disclosed net assets in 2004, and in 2013 the number was virtually unchanged 74%.
Table 7. General Catagories of Line-Items Disclosed for Each Segment
2013 2012 2011 2010 2009 2008 2007 2006 2005 2004
Revenues from external customers 189 189 188 186 187 186 186 185 184 181
Revenues from transactions with other segments 62 64 65 64 62 62 63 57 56 53
Earnings 168 170 167 165 165 162 163 161 162 162
Interest Revenue 22 25 22 23 23 28 28 30 30 28
Interest Expense 50 49 45 47 47 51 48 48 50 47
Net Interest 4 3 3 3 3 3 4 2 2 1
Total Assests 148 152 151 149 149 146 143 143 144 146
Net Assets 7 7 7 6 6 6 5 5 5 5
Depletion 6 6 6 6 6 6 6 7 7 8
Depreciation (Separate) 22 19 19 19 20 22 22 22 21 24
Amortization (Separate) 13 11 11 10 12 11 10 9 8 8
Depreciation and amortization (Combined) 136 142 142 143 141 139 139 139 139 129
Capital Expenditure 146 149 148 146 145 145 142 141 138 138
Equity Income 34 35 36 37 38 36 36 32 31 32
Equity Investment 20 22 22 22 22 22 23 23 24 25
Investment and other income 16 18 18 17 17 19 19 19 19 17
Income Tax Expense 34 36 33 34 34 36 39 39 36 36
Income Tax Benefit 5 3 4 4 5 4 5 5 5 6
Unusual Items 0 2 2 1 2 3 4 6 8 8
Special Items 2 2 2 2 1 1 2 1 1 2
Noncash Items 3 2 2 2 2 8 8 8 8 8
Order Backlogs 0 0 0 0 0 1 1 1 1 1
Current Liabilities 1 1 2 3 3 3 3 3 3 3
Pension 2 1 1 2 1 1 1 2 2 2
Change in Net Debt 0 0 0 0 0 0 0 0 0 0
R&D 6 4 5 4 5 6 5 5 5 5
Table 8. General Catagories of Line-Items Disclosed for Each Segment (as a percentage)
2013 2012 2011 2010 2009 2008 2007 2006 2005 2004
Revenues from external customers 95% 95% 94% 93% 94% 93% 93% 93% 92% 91%
Revenues from transactions with other segments 31% 32% 33% 32% 31% 31% 32% 29% 28% 27%
Earnings 84% 85% 84% 83% 83% 81% 82% 81% 81% 81%
Interest Revenue 11% 13% 11% 12% 12% 14% 14% 15% 15% 14%
Interest Expense 25% 25% 23% 24% 24% 26% 24% 24% 25% 24%
Net Interest 2% 2% 2% 2% 2% 2% 2% 1% 1% 1%
Total Assests 74% 76% 76% 75% 75% 73% 72% 72% 72% 73%
Net Assets 4% 4% 4% 3% 3% 3% 3% 3% 3% 3%
Depletion 3% 3% 3% 3% 3% 3% 3% 4% 4% 4%
Depreciation (Separate) 11% 10% 10% 10% 10% 11% 11% 11% 11% 12%
Amortization (Separate) 7% 6% 6% 5% 6% 6% 5% 5% 4% 4%
Depreciation and amortization (Combined) 68% 71% 71% 72% 71% 70% 70% 70% 70% 65%
Capital Expenditure 73% 75% 74% 73% 73% 73% 71% 71% 69% 69%
Equity Income 17% 18% 18% 19% 19% 18% 18% 16% 16% 16%
Equity Investment 10% 11% 11% 11% 11% 11% 12% 12% 12% 13%
Investment and other income 8% 9% 9% 9% 9% 10% 10% 10% 10% 9%
Income Tax Expense 17% 18% 17% 17% 17% 18% 20% 20% 18% 18%
Income Tax Benefit 3% 2% 2% 2% 3% 2% 3% 3% 3% 3%
Unusual Items 0% 1% 1% 1% 1% 2% 2% 3% 4% 4%
Special Items 1% 1% 1% 1% 1% 1% 1% 1% 1% 1%
Noncash Items 2% 1% 1% 1% 1% 4% 4% 4% 4% 4%
Order Backlogs 0% 0% 0% 0% 0% 1% 1% 1% 1% 1%
Current Liabilities 1% 1% 1% 2% 2% 2% 2% 2% 2% 2%
Pension 1% 1% 1% 1% 1% 1% 1% 1% 1% 1%
Change in Net Debt 0% 0% 0% 0% 0% 0% 0% 0% 0% 0%
Tables 7 and 8 indicate that SFAS No. 131 is not working because the actual number of general line-items reported for each segment by companies over each of the previous ten years has remained virtual unchanged.
5.5 How many geographic areas were reported by companies over each of the previous ten years?
Tables 9 and 10 indicate the number of geographic areas reportedfor each segment by companies over each of the previous ten years. Table 9 provides the mean and median number of geographical areas over each of the previous ten years, which is zero (meaning no disclosure of the geographic areas for the segments they report).
In addition, Table 9 provides that when companies do in fact provide geographic area disclosure for their segments, providing disclosure of three geographic areas occurred more often than any other number. For example, 21 of the 200 sample companies disclosed 3 geographic areas for the segments they reported in 2004, and 23 companies did the same in 2013.
Table 10 provides this information on a percentage basis based on the 200 companies in the sample. By analyzing Table 10, it is shown that over 50% of companies in the sample provided no disclosure of the geographic areas for the segments they reported for each of the last ten years. Table 10 provides that in 2004 11% of the companies reported 3 geographic areas and that percentage has remained virtually unchanged with 12% of companies reporting 3 geographic areas in 2013.
Tables 10 and 11 indicate that SFAS No. 131 is not working because the actual number of geographic areas reported for each segment by companies over each of the previous ten years has remained virtual unchanged.
Table 9. Number of Geographic Areas Disclosed
2013 2012 2011 2010 2009 2008 2007 2006 2005 2004
Mean 0 0 0 0 0 0 0 0 0 0
Median 0 0 0 0 0 0 0 0 0 0
2013 2012 2011 2010 2009 2008 2007 2006 2005 2004
Zero 106 105 104 103 104 106 106 105 105 111
One 18 20 20 22 22 22 21 24 27 28
Two 17 17 19 19 19 18 18 18 18 16
Three 23 23 23 22 21 24 24 23 21 21
Four 16 17 18 20 21 18 18 18 18 14
Five 14 12 11 9 9 8 9 9 8 8
Six 5 5 3 3 3 3 3 2 2 1
Seven+ 1 1 2 2 1 1 1 1 1 1
200 200 200 200 200 200 200 200 200 200
Table 10. Number of Geographic Areas Disclosed (as a percentage)
2013 2012 2011 2010 2009 2008 2007 2006 2005 2004
Zero 53% 53% 52% 52% 52% 53% 53% 53% 53% 56%
One 9% 10% 10% 11% 11% 11% 11% 12% 14% 14%
Two 9% 9% 10% 10% 10% 9% 9% 9% 9% 8%
Three 12% 12% 12% 11% 11% 12% 12% 12% 11% 11%
Four 8% 9% 9% 10% 11% 9% 9% 9% 9% 7%
Five 7% 6% 6% 5% 5% 4% 5% 5% 4% 4%
Six 3% 3% 2% 2% 2% 2% 2% 1% 1% 1%
Seven+ 1% 1% 1% 1% 1% 1% 1% 1% 1% 1%
5.6 Which specific geographic areas were reported by companies over each of the previous ten years?
Analysis of Tables 11 and 12 reveals that Europe is the most frequently disclosed geographic area by companies in their segment disclosure and such disclosure has remained consistent for the last ten years. Table 11 provides that in 2004, 50 of the 200 sample companies provided segment reporting disclosure for operations in Europe. This number declined to 39 companies in 2013, but 2013 is lower than the prior nine years. Asia Pacific is the second most reported geographic area, and a combined area consisting of Europe, Middle East, Africa is the third most reported geographic over each of the previous ten years.
Similarly, Table 12 reveals that in 2004, 25% of the 200 sample companies provided segment reporting disclosure for operations in Europe. This number declined to 20% of the companies in 2013, but 2013 is lower than the prior nine years. Asia Pacific is the second most reported geographic area, and a combined area consisting of Europe, Middle East, Africa is the third most reported geographic over each of the previous ten years.
Tables 11 and 12 indicate that SFAS No. 131 is not working because the geographic areas disclosed for each segment by companies over each of the previous ten years has remained virtual unchanged.
5.7 Which specific countries were reported by companies over each of the previous ten years?
Analysis of Tables 13 and 14 reveals that the United States is the most frequently disclosed country by companies in their segment disclosure and such disclosure has remained consisted for the last ten years. Table 13 provides that in 2004, 119 of the 200 sample companies provided segment reporting disclosure for operations in the United States. This number increased to 121 companies in 2013, which is basically the same amount over the prior nine years. Canada is the second most reported country, and Germany is the third most reported country over each of the previous ten years, save for 2012 when Great Britain was the third most reported country.
Similarly, Table 14 reveals that in 2004, 59% of the 200 sample companies provided segment reporting disclosure for operations in the United States. This number increased to 60% of the companies in 2013 and has remained virtually unchanged over the prior nine years. Canada is the second most reported country at 23% in 2004 and 20% in 2013, and Germany is the third most reported country over each of the previous ten years, save for 2012 when Great Britain was the third most reported country.
Table 11. Geographic Areas Disclosed
2013 2012 2011 2010 2009 2008 2007 2006 2005 2004
Asia 15 13 12 14 15 14 17 14 12 11
Asia Pacific 30 28 26 24 24 22 21 20 19 18
Europe 39 43 43 45 46 45 47 50 54 50
Europe, Middle East, Africa 20 19 17 16 14 11 9 6 7 6
Latin America 19 17 18 19 21 22 24 24 24 20
North America 23 24 24 24 25 25 26 27 26 23
Pacific 4 4 4 5 5 5 5 5 4 3
South America 8 8 8 7 6 6 6 6 5 4
Western Hemisphere 4 4 5 5 5 4 4 4 4 3
Table 12. Geographic Areas Disclosed (as a percentage)
2013 2012 2011 2010 2009 2008 2007 2006 2005 2004
Asia 8% 7% 6% 7% 8% 7% 9% 7% 6% 6%
Asia Pacific 15% 14% 13% 12% 12% 11% 11% 10% 10% 9%
Europe 20% 22% 22% 23% 23% 23% 24% 25% 27% 25%
Europe, Middle East, Africa 10% 10% 9% 8% 7% 6% 5% 3% 4% 3%
Latin America 10% 9% 9% 10% 11% 11% 12% 12% 12% 10%
North America 12% 12% 12% 12% 12% 12% 13% 13% 13% 11%
Pacific 2% 2% 2% 3% 3% 3% 3% 3% 2% 2%
South America 4% 4% 4% 3% 3% 3% 3% 3% 2% 2%
Tables 13 and 14 indicate that SFAS No. 131 is not working because the geographic areas disclosed for each segment by companies over each of the previous ten years has remained virtual unchanged.
6. Conclusion
Despite recent findings by the FAF in its January of 2013 PIR, segment disclosures under SFAS No. 131 has remained virtually unchanged the last ten years (2013-2004). More specifically, there has been virtually no change in the number of segments reported; the number of companies which changed the name of one or more of their
Table 13. Individual Countries Disclosed
2013 2012 2011 2010 2009 2008 2007 2006 2005 2004
United States 121 123 123 124 124 121 123 120 120 119
Canada 40 40 41 42 42 44 46 46 46 45
Great Britain 19 21 19 19 18 19 19 18 18 16
China 19 17 15 12 11 11 9 9 8 8
Germany 21 20 21 22 20 21 21 19 18 18
Japan 17 19 18 15 17 15 17 17 18 17
Brazil 14 13 12 11 10 11 9 10 10 10
Mexico 12 12 11 13 12 12 12 11 11 9
Australia 8 8 8 8 6 6 6 5 6 6
France 11 12 11 11 12 11 13 11 10 9
Singapore 5 5 3 4 5 4 5 5 3 2
Italy 5 7 6 7 7 7 9 6 6 6
Spain 6 7 7 7 6 5 5 4 3 1
Argentina 3 3 3 3 3 4 5 5 5 6
India 5 5 4 4 3 3 2 2 2 0
Indonesia 2 2 1 1 1 1 1 1 1 1
Malaysia 0 0 0 0 0 0 0 0 0 0
Netherlands 5 5 5 3 4 5 5 5 5 4
Russia 3 3 3 3 3 3 2 2 2 1
Other individual countries 83 86 82 78 80 89 88 91 85 80
Table 14. Individual Countries Disclosed (as a percentage)
2013 2012 2011 2010 2009 2008 2007 2006 2005 2004
United States 60% 61% 61% 62% 62% 60% 61% 60% 60% 59%
Canada 20% 20% 21% 21% 21% 22% 23% 23% 23% 23%
Great Britain 10% 11% 10% 10% 9% 10% 10% 9% 9% 8%
China 10% 9% 8% 6% 6% 6% 5% 5% 4% 4%
Germany 11% 10% 11% 11% 10% 11% 11% 10% 9% 9%
Japan 9% 10% 9% 8% 9% 8% 9% 9% 9% 9%
Brazil 7% 7% 6% 6% 5% 6% 5% 5% 5% 5%
Mexico 6% 6% 6% 7% 6% 6% 6% 6% 6% 5%
Australia 4% 4% 4% 4% 3% 3% 3% 3% 3% 3%
France 6% 6% 6% 6% 6% 6% 7% 6% 5% 5%
Singapore 3% 3% 2% 2% 3% 2% 3% 3% 2% 1%
Italy 3% 4% 3% 4% 4% 4% 5% 3% 3% 3%
Spain 3% 4% 4% 4% 3% 3% 3% 2% 2% 1%
Argentina 2% 2% 2% 2% 2% 2% 3% 3% 3% 3%
India 3% 3% 2% 2% 2% 2% 1% 1% 1% 0%
Indonesia 1% 1% 1% 1% 1% 1% 1% 1% 1% 1%
Malaysia 0% 0% 0% 0% 0% 0% 0% 0% 0% 0%
Netherlands 3% 3% 3% 2% 2% 3% 3% 3% 3% 2%
Russia 2% 2% 2% 2% 2% 2% 1% 1% 1% 1%
segments; the number of actual line-items reported for each segment; the general category of line-items reported for each segment; the number of geographic areas reported; the names of geographic areas reported; and the names of countries reported.
The findings of this research calls into question whether SFAS No. 131 is truly achieving its purposes. References
American Institute of Certified Public Accountants (AICPA). (1994). Improving Business Reporting – A Customer Focus. Report of the AICPA Special Committee on Financial Reporting (“Jenkins Committee”). New York, NY: AICPA.www.aicpa.org/InterestAreas/FRC/AccountingFinancialReporting/DownloadableDocuments/Jenkins%2 0Committee%20Report.pdf
Association for Investment Management and Research (AIMR). (1993). Financial Reporting in the 1990s and Beyond: A Position Paper of the Association for Investment Management and Research. Prepared by Peter H. Knutson. Charlottesville, VA: AIMR. Association for Investment Management and Research (AIMR). 2003 AIMR.
Berger, P. G. & Hann, R. (2003). The Impact of SFAS No. 131 on Information and Monitoring. Journal of Accounting Research Vol. 41 No. 2: 163-223. http://dx.doi.org/10.1111/1475-679X.00100
Chen, Tsung-Kang, & Liao, Yi-Ping. (2015). The Economic Consequences of Disclosure Quality under SFAS No. 131. Accounting Horizons. Vol. 29 No. 1: 1-22. http://dx.doi.org/10.2308/acch-50898
Doupnik, T. & L. Seese. (2001). Geographic area disclosures under SFAS 131: Materiality and fineness. Journal of
International Accounting, Auditing and Taxation Vol. 10 No. 2: 117-138.
http://dx.doi.org/10.1016/S1061-9518(01)00040-4
Emmanuel, C.R., & S. J. Gray. (1977). Segmental disclosures and the segment identification problem. Accounting and Business Research (Winter): 37-50.
Financial Accounting Foundation (FAF). (2013). Post-Implementation Review (PIR) report on FASB Statement No. 131, Disclosures about Segments of an Enterprise and Related Information (codified in Accounting Standards Codification Topic 280, Segment Reporting). http://www.accountingfoundation.org
Financial Accounting Standards Board (FASB). (1976). Financial Reporting for Segments of a Business Enterprise. Statement of Financial Accounting Standards No. 14. Stamford, CT: FASB. http://www.fasb.org/pdf/fas14.pdf Financial Accounting Standards Board (FASB). (1997). Disclosures about Segments of an Enterprise and Related
Information. Statement of Financial Accounting Standards No. 131, as codified in FASB Accounting Standards Codification (ASC) 280, Segment Reporting. http://www.fasb.org/pdf/fas131.pdf
Herrmann, D. & W. Thomas. (2000). An Analysis of Segment Disclosures Under SFAS No. 131 and SFAS No. 14. Accounting Horizons; Vol. 14 No. 3: 287-302. http://dx.doi.org/10.2308/acch.2000.14.3.287
Horwitz, B. & Kolodny, R. (1980). Segment Reporting: Hindsight After Ten Years. Journal of Accounting, Auditing & Finance; Fall80, Vol. 4 Issue 1: 20-35.
SEC Release No. 33-7620. (January 5, 1999). Final Rule: Segment Reporting. https://www.sec.gov/rules/final/33-7620.txt
SEC Release No. 33-7549. (June 25, 1998). Proposed Rule: Segment Reporting. http://www.sec.gov/rules/proposed/33-7549.htm
Street, D.L., N.B. Nichols & S.J. Gray. (2000). Segment disclosures under SFAS No. 131: Has Business Segment Reporting Improved? Accounting Horizons; Vol. 14 No. 3: 259-285. http://dx.doi.org/10.2308/acch.2000.14.3.259
Appendix A. Firms Included in the Sample
3M Cigna General Cable Corp Lincoln National Penske Automotive Group, Inc. The Dow Chemical Company Abbott Laboratories Coca-Cola General Dynamics Lockheed Martin Pepco Holdings, Inc. The Sherwin-Williams Company Advance Auto Parts Colgate-Palmolive General Electric Loews Corporation PetSmart Thermo Fisher Scientific Advanced Micro Devices, Inc Comcast General Mills Lowe's Pfizer Inc. Time Warner AES Corporation Con Edison Genuine Parts Company Macy's Plains All American Pipeline Timken AGCO ConocoPhillips Goodyear Tire and Rubber ManpowerGroup PPG Industries TJX
Alcoa Corning Google Marathon Oil Corporation PPL United Continental Holdings Allstate Crown Holdings Halliburton Marriott Praxair United States Steels Altria Group Cummins Inc Harley Davidson Marsh and McLennan Precision Castparts United Technologies Amazon CVS Caremark HCA Holdings Masco Public Service Enterprise Group UnitedHealth Group American Electric Power Danaher Corp. Health Net McDonalds Raytheon Universal Health Services Anadarko Petroleum Dean Foods Henry Schein MeadWestvaco Corporation Raytheon Unum Group
Apple Delta Hess Corporation Merck Republic Services UPS
Arrow Electronics Devon Energy HollyFrontier Corporation MGM Resorts International RR Donnelley URS AT&T Dick's Sporting Goods Home Depot Mohawk Industries Inc. Seaboard Corp. Valero Energy AutoNation Dillards Honeywell Mondelez International, Inc. Sealed Air Verizon Communications Avon Products Dish Network Humana Motorola Solutions, Inc. Sempra Energy VF Corporation
Ball Corporation Dover IBM Murphy Oil Smithfield Foods Visteon
Baxter International DTE Energy Illinois Tool Works Inc. National Oilwell Varco, Inc. Sprint W.W. Grainger Berkshire Hathaway Eastman Chemical Ingram Micro Newell Rubbermaid Inc. St. Jude Medical Inc. Wal-Mart Best Buy eBay Ingredion Incorporated Newmont Mining Corporation Stanely Black & Decker, Inc. Waste Management Boston Scientific Ecolab Intel NextEra Energy Staples Whirlpool C. H. Robinson EMC Corporation International Paper NiSource Starwood Hotel and Resort Williams Companies Cablevision EMCOR Group Inc. J. B. Hunt Transportation Services Nordstrom Inc. Steel Dynamics World Fuel Services Calpine Entergy Johnson and Johnson Northrop Grumman Stryker Wynn Resorts Cameron International EOG Resources Kellogg Nucor Corporation SuperValu Xcel Energy
Caterpillar Exelon Kelly Services NuStar Energy Target Xerox
CBS Exxon Mobil Corporation Kimberly-Clark Occidental Petroleum Tech Data Yahoo
Centene FirstEnergy Corp. Kroger Office Depot Terex YRC Worldwide
CenterPoint Energy, Inc. Fluor L Brands Omnicare Tesoro Yum Brands Charter Communications Foot Locker L-3 Communications Omnicom Group Texas Instruments