Effect of moisture content on engineering properties of
sorghum grains
Gely
*, María Cristina, Pagano, Ana María
(TECSE, Department of Ingeniería Química, Facultad de Ingeniería, Universidad Nacional del Centro de la Provincia de Buenos Aires (UNICEN), Olavarría, Provincia de Buenos Aires, Argentina)
Abstract: Moisture constitutes one of the most influential factors in the conservation of sorghum grains during storage due to their relationship with the biological factors that cause postharvest damage, affecting the nutritional and economic values. For this reason, it is important to evaluate the effect of moisture content on the physical characteristics of the grain in order to establish the design and operation conditions of the post-harvest processes. Accordingly, the aim of this work is to analyze the dependence on the moisture content of physical properties of technological interest for the post-harvest grain sorghum stages. Experimental results show that the moisture significantly affects the properties width, thickness, geometric mean diameter, sphericity, bulk density, thousand seed weight, porosity, the angle of repose, and friction coefficient both on plywood surface as metal. Increased moisture content in the range of 0.13 to 0.29 dec. d.b. results in increased for width, thickness, geometric mean diameter, sphericity, thousand seed weight, porosity, the angle of repose and friction coefficient. For the other side, the same increase in moisture content leads a decrease in the bulk density of the grains with correlation coefficients in all cases higher than 0.99.
Keywords: grain sorghum, physical properties, moisture content, models
Citation: Gely, M. C., and A. M. Pagano. 2017. Effect of moisture content on engineering properties of sorghum grains. Agricultural Engineering International: CIGR Journal, 19(2): 200–209.
1 Introduction
The world sorghum production in 2013 was 62.2 million tons, reaching the fifth place in world grain production. In Argentina, it is the third most important cereal crop in production level after wheat and corn, representing approximately 5.8% of the world’s total with an average value for the past 10 years of 3.2 million tons (FAO, 2015).
The uses of sorghum depend mainly on genetic characteristics. It can be used both for human, animal consumption as well as in industry, for uses ranging from the paper industry, adhesives, mineral processing, and even the production of sausages (Bragachini et al., 2012).
United States, Mexico, and Japan are the main
Received date: 2016-12-13 Accepted date: 2017-04-04 * Corresponding author: Gely, M. C., TECSE, Depto. Ingeniería Química, Facultad de Ingeniería, Universidad Nacional del Centro de la Provincia de Buenos Aires (UNICEN), Olavarría, Provincia de Buenos Aires, Argentina. Email: [email protected].
consuming countries, followed by Argentina, the former Soviet Union, and Venezuela. All of these countries have for over 80% of world use of sorghum as animal feed (Ratnavathi and Komala, 2016). In Argentina, sorghum production is concentrated in the Pampas region, where the areas of Santa Fe and Cordoba being the areas with the best natural resources for planting (Barberis and Sanchez, 2013). For an adequate design of the equipment involved in grain post-harvest, it is essential to have a clear knowledge of the shape and size of the sorghum grains, from which properties such as surface area and volume can be determined (Kachru et al., 1994; Sologubik et al., 2013).
(Brooker et al., 1992; Kachru et al., 1994). Oke (1984) and Mwithiga and Sifuna (2004) studied the physical properties of Nigerian varieties of sorghum and their functionality with the moisture content. In their work, these authors recognize that the biological nature of the material influences its properties; therefore, the evaluated properties are not universal but rather represent the behavior of the material under the studied conditions.
For this reason, the study of the effects of moisture on the physical properties of the national grain production is considered as a major contribution of the post-harvest sorghum in Argentina.
Sorghum grains (Sorghum caffrorum (Retz.) P. Beauv.) (Lovey and Perissé, 2016) are usually harvested with moisture contents below 30% d.b. (dry basis) and most of the postharvest processes take place between this moisture content and safety moisture content (below of 14% wet basis, w.b.).
Therefore, a thorough understanding of the physical properties of sorghum grains is helpful to improve the technology associated with operations and equipment related to post-harvest processes such as cleaning, sorting, transport, ventilation, drying, and storage. The dependence of the physical properties of the grains with the moisture content are required in different handling and processing operations and are also needed as input parameters for the prediction of transport properties and drying rates of grains through simulation models (Abalone et al., 2004). In view of this, the objective of this study is set as to analyze the dependence on the moisture content of physical properties (Tettamanti et al., 2015) of technological interest for the stages of post-harvest and processing of sorghum.
2 Materials and method
2.1 Samples
The material used was sorghum grain cultivar SDK DK51 ARG750M T2AR low tannin harvested in 2014 in the area of 25 de Mayo (Buenos Aires, Argentina, 35°25′00″S 60°10′00″W) with an initial moisture content of 0.196 (dec. d.b.). The moisture content (M) was determined in forced air oven (AOAC, 1980) using 10 g of sorghum dried in forced air oven at 130°C for 3 h. The
weight of the samples was recorded by means of an analytical scale (accuracy ± 0.0001 g) in triplicate and their average values were recorded. Subsequently, the sample was placed in a desiccator and left to reach room temperature so as to obtain the dry weight.
2.2 Sample preparation
Sorghum samples were divided into batches that were conditioned to different moisture contents (M) ranging from 0.13 to 0.29 dec. d.b. Samples with humidity of 0.22 and 0.29 dec. d.b. were obtained by wetting the original samples adding predetermined amounts of distilled water as it follows:
( )
1
i f i
i
B M M Q
M
− =
+ (1)
where, Q is the mass of water added (kg); Biis the initial sample mass (kg), and Mi and Mf are the moisture contents (dec. d.b.) of the initial and final samples, respectively.
Wetting was performed by adding the necessary amount of distilled water to sample in each case, in a sealed container that was rotated periodically for 48 hours. Samples with humidity of 0.13 and 0.17 dec. d.b. were obtained by drying the original samples in a forced circulation oven 65°C, mixing the sample every one hour in order to obtain the homogeneity of moisture through all the material. Having reached the target humidity, the samples were cooled in a desiccator. The conditioned samples were stored in plastic bags in a refrigerator at 4°C for one week to obtain moisture uniformity inside of the seeds (Sun and Woods, 1994). Before each test, the samples were allowed to equilibrate their temperature with environmental conditions.
2.3 Methodology
2.3.1 Geometric properties determination 2.3.1.1 Spatial dimensions
thickness (T, mm) was the largest dimension along a third axis perpendicular to the length and width. These dimensions were measured with a digital micrometer (Mitutoyo, Japan) with an accuracy of ±0.001 mm.
2.3.1.2 Geometric mean diameter
The equivalent diameter (de, mm), regarded as the geometric average of the three main dimensions (L, W, T) was calculated using Equation (2) (Mohsenin, 1986):
1/3
( )
e
d = LWT (2)
2.3.1.3 Sphericity
Mohsenin (1986) defines the degree of sphericity (φ) as the ratio between the diameter of an object with the same body volume and the largest diameter of the body. Assuming that sorghum grain volume equals the volume of a triaxial ellipsoid (L, W, T) and that the diameter of the circumscribed sphere corresponds to the longest dimension L of the ellipsoid, the degree of sphericity (φ) can be expressed as Equation (3) (Abalone et al., 2004):
1/3
(LWT) de
L L
φ= = (3)
2.3.2 Gravimetric properties determination 2.3.2.1 Thousand kernel weight
The thousand seed weight (W1000, kg) was determined from a grain mass of about 1 kg, which was divided into 10 equal portions to finally extract 10 random seeds from each portion. Their weight was recorded in electronic digital scales with an accuracy of ±0.0001 g, multiplying their weight by 100 to give the mass of 1000 grains. 2.3.2.2 Bulk and real densities of grain
The bulk density (ρb, kg m-3) considered as the ratio between the mass sample of the seed and its total volume, was determined by using standard Hectoliter Weight Schlopper type scale of 250 mL of total volume with a piston for air displacement. The measured results (kg hL-1) (Maxson et al., 1971; Llopart and Drago, 2016) were then expressed in kg m-3.
The real density (ρt, kg m-3), defined as the ratio between the mass of the sample and its true volume, was determined apply to the method of liquid (xylene) displacement, using a pycnometer and an electronic scale (Mohsenin, 1986). Each moisture content 10 grains were placed in a 25 mL pycnometer with xylene at 20°C. The
determinations were made in quintuplicate. 2.3.2.3 Porosity
The grain bed porosity (ε, %) was calculated from the measured values for true and apparent densities using the relation given by Mohsenin (1986). This is shown in Equation (4):
100 1 b
t
ρ
ε = ⎛⎜⎝ − ρ ⎞⎟⎠ (4)
2.3.3 Frictional properties determination 2.3.3.1 Angle of repose
In order to determine the angle of repose, an acrylic box with a wooden bottom (0.30 m×0.30 m×0.30 m), and a removable front panel were used. On removing the front panel, the grains slide down on a natural slope. The angle of repose was calculated from measurements of the vertical depth and radius of propagation of the sample over the plywood with parallel streaks (θparallel) or perpendicular streaks (θperpendicular) to the movement direction (Vilche et al, 2003; Mohsenin, 1986; Sologubik et al., 2013).
2.3.3.2 Static friction coefficient
The static friction coefficient (μ) of sorghum was determined by the mean of a device consisting of a plate with inclination adjustment, made of two structural alternative materials: plywood (μp) and galvanized steel (μg). A polyvinyl chloride cylindrical tube (50 mm diameter and 50 mm height) was placed on a plate with adjustable tilt, and it was filled with the seed sample. The cylinder was slightly raised in order to avoid contact with the plate surface, and both the plate and the cylinder, leaving on it and, at rest, were tilted slowly with a screw device until the cylinder started to slide down. At that moment, the angle of the plate was recorded on a scale. For each moisture content, fifteen repetitions were made to determine the frictional properties of both materials. 2.3.4 Principal components analysis
linear combination of the original variable coefficients become their eigenvectors of the correlation matrix.
In this paper, the optimal number of principal components was determined by applying the rule of Kaiser-Guttman. According to this rule, the number of principal components to be considered equals the number of factors that have an eigenvalue higher than one (Esmaeili and Shokoohi, 2011; Saavedra et al., 2011). Experimental data of the physical variables studied were arranged in a matrix to perform a multivariable analysis of the quality attributes. The principal component analysis was performed with SYSTAT software (version 12).
3 Results and discussion
3.1 Spatial dimensions
The characteristic lengths length (L), width (W), and
thickness (T) of sorghum grain cultivar SDK DK51
ARG750M T2AR low tannin were in the ranges 3.475-5.187 mm, 3.195-4.689 mm, and 2.094-3.237 mm, respectively, for moisture contents between 0.13 and 0.29 dec. d.b.
Ratnavathi and Komala (2016) analysed 430 Indian sorghum genotypes (including 160 germplasm lines, 200 elite SPV genotypes, and 60 released parents, hybrids, and other varieties), and reported values of size grain between 2-4 mm, being typical sorghum seeds usually of 4 mm long, 2 mm wide, and 2.5 mm thick with color ranging from black, red, purple, brown, yellow to white.
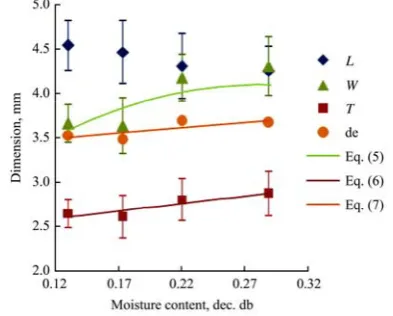
The average values of these dimensional properties for each experimental humidity analyzed in the present work are shown in Figure 1. It can be seen that the increase in moisture content produces a significant increase over W and T (p<0.01).
A decrease of 6.3% in L viewed from an initial value of 4.54 mm (M = 0.13 dec. d.b.) with increasing moisture content (p>0.01).
The dependency analysis of these dimensions with moisture content showed quadratic functionalities for W
(Equation (5)) and linear for T (Equation (6)). The results indicate an increase of 17.7% in width and only 8.5% for grain thickness with increasing moisture content of 0.13 to 0.29 dec. d.b.
Figure 1 Variation with the moisture content of the main dimensions of grain sorghum
These results are similar to those found by Mwithiga and Sifuna (2006) for a Nigerian sorghum variety with increasing humidity of 0.13 to 0.22 dec. d.b.
2
22.569 12.695 2.314
W = − M + M + (r2=0.994) (5)
1.661 2.395
T= M+ (r2=0.994) (6)
3.2 Geometric mean diameter
The analysis performed on the equivalent diameter (de) evaluated as the geometric mean of the three main dimensions shows a significant effect of moisture content (p<0.01). It increases a 4% from 3.5 mm according to a linear function (Equation (7)). The humidity increases from 0.13 to 0.29 dec. d.b., probably due to increases in the width and thickness of the grain.
1.191 3.350
e
d = M + (r2 = 0.996) (7)
Mwithiga and Sifuna (2006) find similar results for Nigerian sorghum varieties with increasing humidity of 0.14 to 0.22. Trends indicate an average slope of 1.28 and intercept of 3.185.
3.3 Sphericity
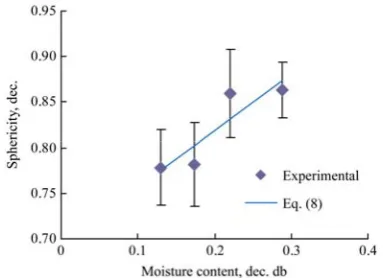
Sorghum kernels are generally spherical in shape and come in different sizes and colors (Ratnavathi and Komala, 2016). In this work, the sphericity (Equation (3)) of sorghum grain increases from 0.778 ± 0.041 (M = 0.13 dec. d.b.) to 0.863± 0.031 (M = 0.29 dec. d.b.), showing a significant effect (p<0.01) of moisture content (Figure 2). These values are higher than those reported by Withiga and Sifuna (2006) for three varieties of Nigerian sorghum. The dependence of the sphericity (dec.) with the moisture content indicates a linear functionality type (Equation (8)):
0.617M 0.695
Figure 2 Sphericity variation of sorghum grain with moisture content
When analyzing the Pearson correlation matrix of these dimensional parameters, the results indicate significant positive correlations (p<0.05) of sphericity with the width (r = 0.722) and the thickness of the grains (r = 0.523); whereas a negative correlation of sphericity with long beans (r = –0.63) was found. These results (Figure 3) indicate that an increase in humidity leads to a more spherical grain (Figure 2).
Figure 3 Variation of the main dimensions of sorghum grain with sphericity
3.4 Thousand kernel weight
The weight of 1000 grain sorghum (W1000) ranges
from 26.869 ± 1.315 (M = 0.13 dec. d.b.) to 29.328 ± 1.035 g (M = 0.29 dec. d.b.), showing a significant effect (p<0.01) of the moisture (Figure 4). This increase of 9.2% in W1000 can be represented as a linear functionality type
with M (Equation (9)). No correlations with geometric variables analyzed (p>0.01 in all cases) were found.
1000 18.4 24.668
W = M+ (r2=0.997) (9)
3.5 Real density of grain
Real grain density (ρt) of the sorghum grain cultivar SDK DK51 ARG750M T2AR low tannin was not
Figure 4 Variation of thousand kernel weight with the moisture content
affected by moisture content (p>0.05). The average value was 1179.21±12.8 kg m-3.
Comparatively, Simonyan et al. (2007) reported real densities varying from 1350 to 700 kg m-3 in the range of 0.986 to 0.197 dec. d.b. for one Nigerian sorghum grain hybrid (SAMSORG 17), determined by water displacement method. Meanwhile, Chang (1988) informed values of 1471 and 1448 kg m-3 for the real
density of sorghum grain of two American varieties, Ferry Morse, and Funk with moisture content of 0.127 and 0.112 dec. d.b., respectively, determined by gas pycnometer. Gorial and O´Callaghan (1990) demonstrated for different grains that significantly different values of real density can be obtained depending on the applied method: for example, for sorghum with 0.075 dec. d.b., the grain density was 1250 kg m-3 using grain size measurement and their weight, while that was 1380 and 1410 when liquid or gas picnometer was performed, respectively. Recently, Llopart and Drago (2016) in their study on physicochemical properties characterization related with the technological aptitude for popping, evaluated the real density of 28 hybrids of red (RS) and white (WS) sorghum with moisture content of 0.14-0.18 dec. d.b. In this work, the gravimetric property was determined by volume displacement in a graduated cylinder and calculated as the seed weight divided by the difference between the final and initial volume. By this procedure, the authors obtained values of the particle density of sorghum hybrids comprised in the range 1000-1700 kg m-3.
on this physical property.
3.6 Bulk density
Bulk densities were in the range 758.14 ± 7.6 (at 0.13 dec. d.b.) to 742.43 ± 4.4 kg m-3 (at 0.29 dec. d.b.). ASAE Standars (ASAE, 1999) informed lower value for bulk density of dry clean sorghum grain (721 kg m-3). Llopart and Drago (2016) in the previously mentioned work reported a mean value of hectoliter weight of 80 kg hL-1, equivalent to 800 kg m-3 for the different hybrid of sorghum grain. Other references reported higher bulk densities (810-820 kg m-3 at 0.099-0.1112 dec. d.b. (Jambamma et al., 2011). On the other hand, lower bulk densities for sorghum grain have been informed by Simonyan et al. (2007) for the Samaru Nigerian variety,
varying between 532.68 and 585.11 kg m-3 when
moisture content was from 0.976 to 0.1976 dec. d.b. However, these researchers determined the bulk density by other technique that differs from the standardized procedure based on the use of the hectoliter weight balance.
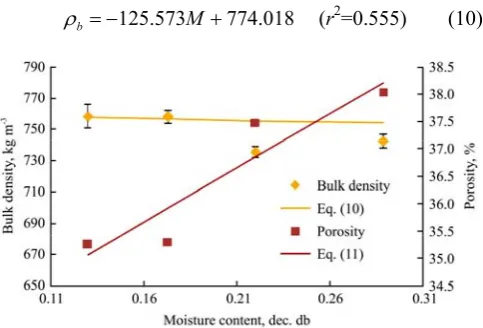
In this work, as shown in Figure 5, the bulk density (ρb) was significantly affected by M (p<0.01), decreasing by 2.1% from the initial value following a linear function with the moisture content (Equation (10)).
125.573 774.018
b M
ρ = − + (r2=0.555) (10)
Figure 5 Variation of bulk density and porosity with moisture content
For other typical grains (soybeans, sunflower, barley, wheat, and corn), similar trends of bulk density decreasing with moisture content in the same range of the present study has been observed (Deshpande et al., 1993; Gupta and Das, 1997; Öztürk and Esen, 2008; Tavakoli et al., 2009a,b; Sologubik et al., 2013; Nelson, 2015). Mwithiga and Sifuna (2006) reported bulk densities of
sorghum seeds of three varieties (Kari-mtama, Seredo, and Serena) between 588.5 and 757.6 kg m-3 at moisture content of 13.64% d.b. Also in accordance with the experimental results of the present work, these authors probed the lineal change in bulk density with moisture content for these three varieties in the range 0.1364 to 0.2195 dec. d.b.
3.7 Porosity
The porosity of the mass of grains (ε, %), evaluated from the average values of the real and apparent densities (Equation (4)), resulted between 35.259% and 38.031%. In the range of moisture content from 0.13 to 0.29 dec. d.b. this property was modeled by a linear function with the moisture content (Equation (11)):
19.786 32.5M
ε= + (r2=1) (11)
In the same way, other researchers have been developed analog models to predict the bed porosity of several varieties of sorghum (Mwithiga and Sifuna, 2006; Solomon and Zewdu, 2009) and other cereal grains, such as barley (Sologubik et al., 2013) and amaranth (Abalone et al., 2004).
3.8 Static friction coefficient
The friction coefficients on galvanized steel and plywood surfaces (Figure 6) were significantly affected by M (p<0.01), responding to the following mathematical functions which depend on moisture content:
0.093 ( ) 0.501
g Ln M
μ = + (r2>0.99) (12)
0.132 ( ) 0.529
p Ln M
μ = + (r2>0.99) (13)
Figure 6 Variation of friction coefficient with moisture content
3.9 Angle of repose
The study of the angle of repose (θ) was performed on wood surfaces with parallel and perpendicular streaks to the movement of grain. In both cases (p<0.01) the effect of moisture content on the physical property was significant.
The angle of repose is an important parameter in the designing of storage structures so the moisture content should be taken into account in the design of such structures. The angle of repose of sorghum grains were from 19.65°±0.56° to 21.42°±0.71° in the range of moisture content, and can be described by the following linear functions (r2>0.99) with the moisture content for wood with parallel streaks to the movement of grain (Equation (14)) or perpendicular to it (Equation (15)).
12.972 17.789
paralell M
θ = + (14)
11.872 19.621
perpendicular M
θ = + (15)
3.10 Principal Component Analysis (PCA)
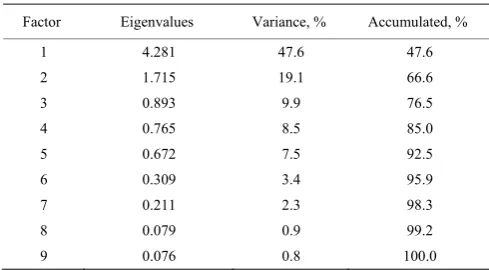
The main components were obtained by applying the rule of Kaiser-Guttman. Table 1 shows the percentage of variance explained by the eigenvalues to select the optimal number of components. The total number of eigenvalues of the correlation matrix equals the total number of the variables being analyzed.
Table 1 Eigenvalues of the reduced matrix correlations
Factor Eigenvalues Variance, % Accumulated, %
1 4.281 47.6 47.6 2 1.715 19.1 66.6 3 0.893 9.9 76.5 4 0.765 8.5 85.0 5 0.672 7.5 92.5 6 0.309 3.4 95.9 7 0.211 2.3 98.3 8 0.079 0.9 99.2 9 0.076 0.8 100.0
According to the Kaiser-Guttman rule, there will be two main components as there are two eigenvalues higher than 1. Both eigenvalues, as one, PC1 (47.6%) and PC2 (19.1%) explain the 66.6% of the variance. In addition, the underlying global interactions between the relevant attributes that were detected by PCA can be seen in the loadings plot (Figure 7).
Table 2 shows the eigenvectors calculated for each of the variables analyzed.
Figure 7 Loads chart for two main components Table 2 Eigenvectors calculated for each of the variables
analyzed
Autovectors Variables
Factor 1 Factor 2
Bulk density (ρb) –0.413 0.052
Length (L) –0.215 0.242
Width (A) 0.301 0.285
Thickness (E) 0.222 0.591
Real density (ρt) 0.136 0.632
Friction coefficient in galvanized steel surface (μg) 0.396 –0.066
Friction coefficient in plywood surface (μp) 0.434 –0.156
Angle of repose in parallel streaks (θparallel) 0.412 –0.273 Angle of repose in perpendicular streaks (θperpendicular) 0.331 –0.070
The first component shows high loadings on variables
up, ug, ρb, θperpendicular, and θparallel. The positive and
negative signs indicate contrast between the properties. The high negative charge on ρb indicates a variable correlated inversely with PC1. On the other hand, high positive charges on µa, µm, θperpendicular and θparallel indicate the existence of manifest variables directly correlated with PC1. Therefore, PC1 would indicate the contrast between the bulk density and properties related to the displacement of grains. However, for PC2 all loads have the same sign, which is characteristic of latent variables indicating the amount, in this case, variables directly related to the size and shape of the grains themselves.
The greatest loads show on ρt and T directly correlated with PC2. The remaining variables distribute their variance between both components in approximately equal parts.
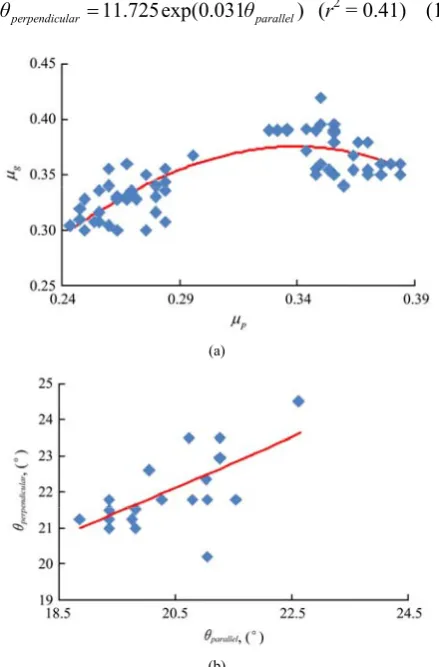
modeled by cubic type functionality with the standard error of estimate of 0.018 (Equation (16)) (Figure 8a).
2
8.992 3.109 0.328
g p p
μ = − μ + μ − (r2=0.64) (16)
Meanwhile, the angles of repose also verify positive correlations that could be described by an exponential function (Equation (17)), showing a standard error of estimate of 0.037 (Figure 8b).
11.725exp(0.031 )
perpendicular parallel
θ = θ (r2= 0.41) (17)
(a)
(b)
Figure 8 A relationships between: (a) the friction coefficients (Equation (16)), and (b) the angles of repose (Equation (17)) in
sorghum grains
In the loads chart (Figure 7) it can be seen that the density and length are inversely related to the angle of repose and both friction coefficients (galvanized steel and plywood). The analysis indicates that there is no significant effect of the angle of repose on the bulk density (p>0.01) with wood streaks perpendicular to the direction of movement. The bulk density was correlated with µg (Equation (18)) and µp (Equation (19)) (p<0.01) based on exponential functions with correlation coefficients higher than 0.7.
832.468exp( 0.304 )
b g
ρ = − μ (18)
814.726exp( 0.271 )
b p
ρ = − μ (19)
(a)
(b)
Figure 9 A relationships between bulk density and friction coefficients μg(Equation (18)), and μp (Equation (19)) for
sorghum grains
4 Conclusion
Knowledge of the physical properties of sorghum grain and their behavior in presence of moisture content are of substantial interest when designing equipment to be used efficiently for post-harvest operations and the handling of grains. This study shows that ρt and L do not depend on M, showing mean values of 12.8±1179.21 kg m-3 and 4.39±0.13 mm, respectively. Furthermore, the increase in moisture content from 0.13 to 0.29 dec. d.b. produces increase in T, W, W1000, μp, μg, de, φ, ε and θ, while the value of ρb decrease. On the other hand, the analysis by main components allows to study the relationship between different manifest variables: μg(μp);
θperpendicular(θparallel); ρb(μg) and ρb(μp). These features
would permit the estimation of properties from others already known. These results show the importance of considering the effect of the moisture content of the grains in the design of post-harvest equipment.
Acknowledgment
research work through the financing of human resources and infrastructure.
References
Abalone, R., A. Cassinera, A. Gastón, and M. A. Lara. 2004. Some physical properties of amaranth seeds. Biosystems Engineering, 89(1): 109–117.
AOAC. 1980. Official methods of analysis. 13th ed. Washington, DC: Association of Official Analytical Chemists.
ASAE Standards. 1999. S352.2, DEC97. Moisture Measurement – Unground Grain and Seeds. St. MI.: ASAE Standards, Standards Engineering Practices Data.
Barberis, N., and C. Sanchez. 2013. Informe de cultivo de sorgo: evolución y perspectivas. Un análisis de las estadísticas. Ediciones INTA. Estación Experimental Agropecuaria Manfredi. Available at: http://inta.gob.ar/documentos/ cultivo-de-sorgo-evolucion-y-perspectivas.-un-analisis-de-las-estadisticas-julio-2013/. Accessed May 2016.
Bragachini, M., C. Casini, A. Saavedra, J. Méndez, R. D. Carli, E. Behr, E. Errasquin, F. Ustarroz, M. Bragachini, G. U. Zavalía, E. Forquera, and M. Alladio. 2012. Evolución del Sistema Agropecuario Argentino. Manfredi, Córdoba (AR): Ediciones INTA – PRECOP. Actualización técnica PRECOP Nº 73. Available at: http://www.cosechaypostcosecha.org/ data/pdfs/EvolSistemaProdAgropArgentino2011.asp.
Accessed May 2016.
Brooker, D. B., F. Bakker-Arkema, and C. W. Hall. 1992. Drying and Storage of Grains and Oilseeds. New York: Van Nostrand Reinold.
Chang, C. S. 1988. Measuring density and porosity of grain kernels using a gas pycnometer. Cereal Chemistry, 65(1): 13–15. Deshpande, S. D., S. Bal, and T. P. Ojha. 1993. Physical properties
of soybean. Journal of Agricultural Engineering Research, 56(2): 89–98.
Dutta, S. K., V. K. Nema, and R. K. Bhardwaj. 1988. Physical properties of gram. Journal of Agricultural Engineering Research, 39(4): 259–268.
Esmaeili, A., and Z. Shokoohi. 2011. Assessing the effect of oil price on world food prices: application of principal component analysis. Energy Policy, 39(2): 1022–1025.
FAO. 2015. Organización de las Naciones Unidas para la Alimentación y la Agricultura. Available at: http://www.fao.org/. Accessed March 2015.
Gorial, B. Y., and J. R. O'Callaghan. 1990. Aerodynamic properties of grain/straw materials. Journal of Agricultural Engineering Research, 46(4): 275–290.
Graham, D. J., and N. G. Midgley. 2000. Graphical representation of particle shape using triangular diagrams: an excel spreadsheet method. Earth Surface Processes and Landforms,
25(13): 1473–1477.
Gupta, R. K., and S. K. Das. 1997. Physical properties of sunflower seeds. Journal of Agricultural Engineering Research, 66(1): 1–8.
Jambamma, I. K., A. Kailappan. 2011. Study of physico-chemical properties of food grain sorghum and product readyto-cook mix food from sorghum. International Journal of Recent Scientific Research, 1(3): 96–99.
Kachru, R. P., R. K. Gupta, and A. Alam. 1994. Physico-chemical constituents and engineering properties of food crops. 1st ed. Jodhpur, India: Scientific Publishers.
Karababaa, E., and Y. Coşkuner. 2013. Physical properties of carob bean (Ceratonia siliqua L.): An industrial gum yielding crop. Industrial Crops and Products, 42(1): 440–446.
Llopart, E. E., and S. R. Drago. 2016. Physicochemical properties of sorghum and technological aptitude for popping. Nutritional changes after popping. LWT-Food Science and Technology, 71: 316–322.
Lovey, R., and P. Perissé. 2016. Colección de Semillas, Angiospermas. Available at: http://www.cyta.com.ar/semilla/ case/ang.htm. Accessed August 2016.
Maxson, E. D., W. B. Fryar, L. W. Rooney, and M. N. Krishnaprasad. 1971. Milling properties of sorghum grain with different proportions of corneous to floury endosperm. Cereal Chemistry, 48(5): 478–490.
Mohsenin, N. N. 1986. Physical properties of plant and animal materials. New York: Gordon and Breach Science Publishers. Mwithiga, G., and M. M. Sifuna. 2006. Effect of moisture content
on the physical properties of three varieties of sorghum seeds. Journal of Food Engineering, 75(4): 480–486.
Nelson, S. O. 2015. Closely related physical properties data for grain and seed. In Dielectric Properties of Agricultural Materials and their Applications, ch. 16, 247-264. Boston, M.A.: Elsevier.
Oke, B. O. 1984. Physical and mechanical properties of sorghum (sorghum bicolor) stalk harvested at various intervals after grain maturity. Agricultural Wastes, 11(1): 31–45.
Öztürk, T., and B. Esen. 2008. Physical and mechanical properties of barley. Agricultura Trópica é Subtrópica, 41(3): 117–121. Ratnavathi, C. V., and V. V. Komala. 2016. Sorghum Grain
Quality. In Sorghum Biochemistry: An Industrial Perspective, 1–61. London:Academic Press.
Saavedra, J., A. Córdova, L. Gálvez, C. Quezada, and R. Navarro. 2013. Principal Component Analysis as an exploration tool for kinetic modeling of food quality: A case study of a dried apple cluster snack. Journal of Food Engineering, 119(2): 229–235. Simonyan, K. J., A. M. EL-Okene, and Y. D. Yiljep. 2007. Some
Sologubik, C., L. Campañone, A. M. Pagano, and M. C. Gely. 2013. Effect of moisture content on some physical properties of barley. Industrial Crops and Products, 43(5): 762–767. Solomon, W. K., and A. D. Zewdu. 2009. Moisture-dependent
physical properties of niger (Guizotia abyssinica Cass.) seed. Industrial Crops and Products, 29(1): 165–170.
Sun, D. W., and J. L. Woods. 1994. Low temperature moisture transfer characteristics of barley: Thin-layer models and equilibrium isotherms. Journal of Agricultural Engineering Research, 59(4): 273–283.
Tavakoli, H., A. Rajabipour, and S. S. Mohtasebi. 2009. Moisture-dependent some engineering properties of soybean
grains. Agricultural Engineering International: the CIGR Ejournal, XI: manuscript No. 1110.
Tavakoli, M., H. Tavakoli, A. Rajabipour, H. Ahmadi, and, S. M. T. Gharib-Zahedi. 2009. Moisture-dependent physical properties of barley grains. International Journal of Agricultural and biological Engineering, 2(4): 84–91.
Tettamanti, A., A. M. Pagano, and M. C. Gely. 2015. Efecto del contenido de humedad sobre propiedades físicas de una variedad argentina de sorgo granífero. In Proc.XV Congreso Argentino de Ciencia y Tecnología de Alimentos.