Detection of moldy core in apples and its symptom types using
transmittance spectroscopy
Zhou Zhaoyong
1,2,
Lei Yu
1,
Su Dong
1,
Zhang Haihui
1,
He Dongjian
1*,
Chenghai Yang
3 (1. College of Mechanical and Electronic Engineering, Northwest A&F University, Yangling 712100, China;2. Network & Education Technology Center, Northwest A&F University, Yangling 712100, China; 3. U.S. Department of Agriculture, Agricultural Research Service, College Station 77845, TX, USA)
Abstract: A detection method based on transmittance spectroscopy and support vector machine (SVM) was proposed to achieve rapid nondestructive detection of moldy core in apples. A visible to near-infrared (Vis/NIR) spectroradiometer was used for scanning transmittance spectra of 215 apple samples in the wavelength range of 200-1025 nm. Wavelet transform was used to reduce the dimensionality of the spectra and extract wavelet coefficients. Two classification algorithms including artificial neural network (ANN) and SVM were used to develop models whose parameters were optimized by genetic algorithms (GA) for determination of the presence and types of moldy core in apples. Comparisons results of the models showed that the GA-SVM model obtained the optimal result with an accuracy of 96.92% for detecting the presence of moldy core and 81.48% for distinguishing symptom types of the disease. These results indicate that it is feasible to detect moldy core in apples nondestructively and rapidly based on transmittance spectroscopy and that wavelet transform is an effective method for extraction of characteristics from spectra. Moreover, the GA-SVM algorithm in conjunction with Vis/NIR transmittance spectroscopy can accurately achieve fast and nondestructive detection of the presence and types of moldy core in apples.
Keywords: moldy core of apples, transmittance spectrum, wavelet transform, support vector machine, genetic algorithm, symptom types
DOI: 10.3965/j.ijabe.20160906.2235
Citation: Zhou Z Y, Lei Y, Su D, Zhang H H, He D J, Yang C H. Detection of moldy core in apples and its symptom types using transmittance spectroscopy. Int J Agric & Biol Eng, 2016; 9(6): 148-155.
1 Introduction
Apple is a widely planted fruit in the world, and apple industry occupies a very important status in China’s
Received date: 2015-11-15 Accepted date: 2016-06-21
Biographies: Zhou Zhaoyong, Engineer, doctoral student, research interests: pattern recognition and intelligent detection, Email: [email protected]; Lei Yu, doctoral student, research interests: intelligent detection, Email: [email protected];
Su Dong, Master, research interests: intelligent detection, Email: [email protected]; Zhang Haihui, PhD, Professor, research interests: grid computing, internet of things in agricultural, precision agriculture, Email: [email protected]; Chenghai Yang, PhD, Professor, research interests: precision agriculture, agricultural remote sensing, Email: [email protected].
*Corresponding author: He Dongjian, PhD, Professor, research interests: pattern recognition and intelligent detection. College of Mechanical and Electronic Engineering, Northwest A&F University, Yangling 712100, Shaanxi, China. Tel: +86-29- 87092391, Email: [email protected].
means, detection of moldy core in apples has become a major problem to be solved in the apple industry.
a. Browning b. Moldy core c. Core rot
Figure 1 Types of symptoms of moldy core in apples Many researchers have tried to detect moldy core in apples using different methods. Some researchers have used nondestructive testing (NDT) methods, including X-rays[2], nuclear magnetic resonance (NMR) and LF-NMR techniques[3] to detect internal defects in apples, but these methods are not suitable for practical applications due to the expensive equipment. Nondestructive detection of apple moldy core based on bio-impedance properties was proposed by Li et al.[4] In recent years, spectroscopic techniques have been used widely in the testing of agricultural products. Some researchers[5-7] used diffuse reflectance spectroscopy to detect moldy core in apples. However, the early-stage onset is located in the core of the fruit, which is difficult to be identified from the surface. The internal browning in apples was detected by Vis/NIR spectroscopy in the range of 650-900 nm. By analyzing the spectra, three wavelengths, 715 nm, 750 nm, and 810 nm, were selected and a classification accuracy of 95.65% was achieved[8]. Infrared spectroradiometer was used for scanning diffuse reflectance spectra of Braeburn apples in the wavelength range of 700-900 nm, and the optimal model had a R2 value of 0.91[9,10]. The partial least squares regression (PLSR) models were established based on the transmittance spectroscopy data and the accuracy of the classification results was 90.1%[11]. Nevertheless, the detection accuracy and detection efficiency have yet to be improved. Multispectral imaging systems have been used widely in testing of agricultural products, and some researchers have used it to detect bruises on apples[12-14]. Moreover, there are no reports on the use of spectroscopic detection technology for distinguishing the types of moldy core in applies. There are two benefits to distinguish the types of moldy core in apples. Firstly, it
helps preventing mistakenly eating moldy core apples. Secondly, this research has important significance for guiding the sterilization of the orchard and reducing the regeneration of the moldy core in apples.
The objective of this study was to develop a nondestructive method for detection of presence and types of moldy core in apples using transmittance spectra, wavelet transform, and classification algorithms of back propagation neural network (BP-NN) and support vector machine (SVM) optimized with genetic algorithms.
2 Materials and methods
2.1 Composition of the testing platform
To study the relationship between moldy core in apples and transmittance spectra, a testing platform (Figure 2) was built, which including an illumination source, a detection chamber, a portable optical emission spectrometer, a computer, and so on.
Note: 1. Computer 2. Fiber-optic spectrometer (usb2000+) 3. Fiber-optic 4. Light-shading curtain 5. Apple 6. Illumination source 7. Opaque chamber 8. Holder 9. Height adjustable stage
controlled by computer (4-core Intel (R) i5 CPU, clocked at 3.0 GHz, 4 GB memory) via a USB interface with software especially developed for transmittance data acquisition and storage. Data processing and modeling was performed using software Matlab R2014a.
2.2 Samples and spectrum collection
A total of 840 Red Fuji apples were collected in an orchard located in Haoyin Village, Fengxi Town, Luochuan County, Shaanxi Province, from which, 215 samples were carefully selected, cleaned, numbered and preserved for half a month in a laboratory (22°C, relative humidity 55%). After 10 days, apples naturally been infected, and three transmittance spectra were collected from each apple in three orientations by manual rotation through approximately 120° about its stem axis. After spectral scanning, the apple was cut through its equator and the cross sections were photographed with a digital camera (Canon-EOS6D) to determine the moldy degree of the apple. The image of the cross section was analyzed using the threshold method by means of the image processing toolbox of MATLAB. As shown in Figure 3, there were obvious differences in the transmittance spectra between the infected apple and the healthy one in the wavelength range of 680-750 nm.
Figure 3 Transmission spectra of infected apples and healthy apples
For the development of model to determine the presence of moldy core in apples, 215 samples (Figure 4) were selected from the 840 samples, including a training set of 150 samples (20 infected apples and 120 healthy apples) and a test set of 65 samples (13 infected apples and 52 healthy apples). According to the suggestions of expert, 36 infected samples were selected from all
samples for constructing models to identify the moldy core types, including a training set of 27 samples (13 with browning, 6 with moldy core, and 8 with core rot) and a test set of 9 samples (4 with browning, 2 with moldy core, and 2 with core rot).
Two classification models were established to detect the presence of moldy core and distinguish the types of moldy core, respectively. The models were evaluated based on the recognition correct rate (the ratio of the samples correctly distinguished in the test set to the total test samples).
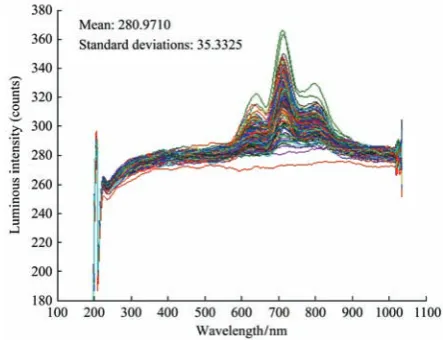
Figure 4 Transmittance spectra of 215 samples
3 Extraction of spectral characteristics
Since Vis/NIR spectra contain a large amount of information, noise disturbance, and overlapped spectra, direct analysis of original spectra may lead to low precision and poor stability. Therefore, it is necessary to eliminate the redundancy in the data without losing important information. As a powerful spectral analysis tool, wavelet transform can not only well capture frequency domain characteristics of local time domain process, but also well capture time domain characteristics of local frequency domain process[15]. Thus, Wavelet
transform was used to reduce the dimensionality and extract wavelet coefficients in this research.
low-frequency parts. With three levels of decomposition of the original spectrum using Daubechies 5 (db5), 263 dimensional wavelet coefficients—cA3 were obtained.
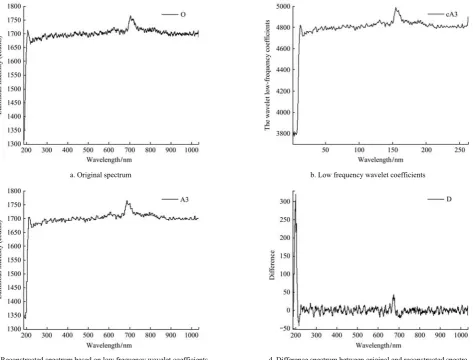
The projection of the wavelet low frequency space is shown in Figure 5b. A comparison of Figures 5a and 5b showed that the two curves were very similar although the dimension of cA3 was far lower than the dimension of
the original spectrum, indicating that the change trend of the original spectrum can be observed by the wavelet low-frequency approximation coefficients. Figure 5c shows the spectrum A3 reconstructed from the wavelet
coefficients cA3. Comparing Figure 5a with Figure 5c,
the curve of A3 based on cA3 and original spectrum were
very similar. Figure 5d shows the difference between the original and reconstructed spectra. The difference or noise was obviously high at the low wavelengths or high
frequencies due to the effect of the sensitivity of the instrument[16]. Thus, the wavelength range of 350- 900 nm was selected to exclude the noisy signal at the lower wavelengths.
In addition, A3 was the signal after the high-frequency
noise was subtracted from the original signal, and reconstructed from cA3. The low-frequency coefficients
cA3 were the characteristic features extracted from the
original spectrum. Wavelet multi-scale decomposition could effectively distinguish the feature information and noise. Thus, with three levels of decomposition of the original spectrum (in the wavelength range of 350- 900 nm) using db5, 172 dimensional wavelet coefficients— cA3 were obtained, and cA3 accounting for 13.03%
(172/1320) of the original data was used as characteristic feature information for quantitative analysis.
a. Original spectrum b. Low frequency wavelet coefficients
c. Reconstructed spectrum based on low frequency wavelet coefficients d. Difference spectrum between original and reconstructed spectra
Figure 5 Original spectrum and reconstructed spectrum by Wavelet transform
4 Classification model for moldy core in apples
Several methods such as curve fitting, multiple linear regression, partial least and squares regression are usually
randomly-generated initial values and over-fitting and other issues limit its application. SVM[18], as a high-dimensional information processing tool, is a fast and efficient method for multivariate modeling and analysis, but the selection of the kernel parameters and penalty coefficients has an significant influence on the performance of SVM. In this study, the initial weights and threshold value matrix of BP-NN and the parameters of SVM were optimized using GA[19] to effectively improve training efficiency and accuracy. To detect the presence of moldy core in apples and distinguish the symptom types, two classification models, GA-BP-NN and GA-SVM, were established.
4.1 BP-NN based classification model with GA-optimized initial weights and threshold
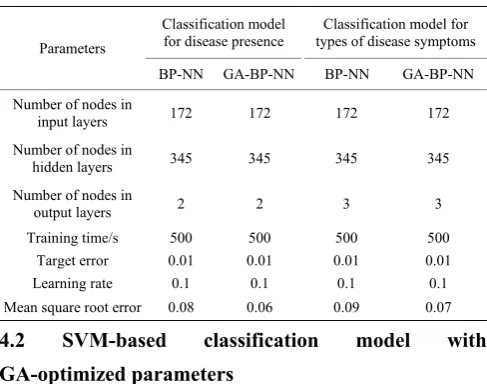
Table 1 shows the network structure and parameters of the BP-NN and GA optimized BP-NN models with a single hidden layer. The number of nodes in the hidden layer was obtained by adjusting various parameters by trial-and-error, and the transfer functions of the hidden layer and the output layer were the S-type tangent function and linear function, respectively. Through simulation, the optimal parameters of GA were determined with the population size of 40, the maximal number of hereditary iterations of 500, the crossover probability of 0.7, and the mutation probability of 0.01.
Table 1 Network structure and parameters of BP-NN and GA-BP-NN
Parameters
Classification model for disease presence
Classification model for types of disease symptoms
BP-NN GA-BP-NN BP-NN GA-BP-NN Number of nodes in
input layers 172 172 172 172 Number of nodes in
hidden layers 345 345 345 345 Number of nodes in
output layers 2 2 3 3 Training time/s 500 500 500 500
Target error 0.01 0.01 0.01 0.01 Learning rate 0.1 0.1 0.1 0.1 Mean square root error 0.08 0.06 0.09 0.07
4.2 SVM-based classification model with GA-optimized parameters
4.2.1 Classification algorithm based on SVM
The two-class SVM-based classification model was used to determine the presence of moldy core in apples and the SVM-based decision tree was used to distinguish
the types of moldy core in apples. Since the SVM-based classification model with one versus rest (OVR) is simple, effective and needs shorter training time, three two-class classification models were established to separate each of the three types of symptoms from the other two.
4.2.2 Parameters optimization for SVM using GA The selection of the function type and parameters is the main task for constructing a SVM model. It has little effect on performance of SVM[20], so the radial basis function (RBF) is commonly used. Nevertheless, the kernel parameter σ2 and the penalty coefficient C are the key factors influencing the performance of SVM. Therefore, the parameters σ2 and C were optimized with
GA. To overcome the shortcomings of binary encoding which requires repeated coding and decoding during genetic manipulations, float encoding was used in this study. Moreover, the float encoding can overcome the effect of the length limit of binary strings, thus improving the performance and accuracy of GA.
Research by Keerthi et al.[21] showed that for a given large enough C, when σ2 approached to zero, serious overfitting appeared. Although training samples could be correctly classified using the RBF-based SVM, the generalization of the samples became poor. When σ2
approached to infinity, there existed serious under-fitting. Consequently, the RBF-based SVM tended to classify the training samples into the class with a relatively large number of samples. Therefore, it is important to determine the appropriate search region for σ2 and then optimize the range of σ2. Through analysis of the expression of the kernel function and validation of experiments, the search region of σ2 was determined to be [min(||xi − xj||2×10⁻²), max(||xi − xj||2×10²)] in which satisfactory results were achieved when the search range was gradually reduced according to the classification results.
region of C, a large enough C value (such as 3000) should be first selected, and then one group solution ai (i=1, 2, …, n), where n is the total number of training samples, and can be obtained by training SVM with the given C. Suppose that C1 = max(ai). If C1<C, C1 can be used as
the upper bound of the search region of C; and if C1≥C,
Lagrange coefficient αt will be constrained by C and it is
necessary to choose a larger C for training SVM until C1
is far smaller than C. Thus it can be determined that (0, C1) is the search region of C. The fitness function for
GA is as following:
2 1
( , )
F C
Error
σ =
(1)
where, Error is the SVM classification error of the training set. After repeated testing and verification, the optimized parameters of SVM are shown in Table 2.
Table 2 Optimized parameters of SVM and GA-SVM
Parameters
Classification model for disease presence Classification model for types of disease symptoms
SVM GA-SVM
SVM GA-SVM
Type I-rest Type II-rest Type III-rest Type I-rest Type II-rest Type III-rest Penalty coefficient (C) 0.5 7.7924 1 32 1 5.0764 7.8213 8.6301 Kernel function parameter 0.0136 0.0288 0.0026 0.0059 0.0412 0.1272 7.5669 0.0658
5 Results and discussion
5.1 Test results and analysis of classification models for presence of apple moldy core
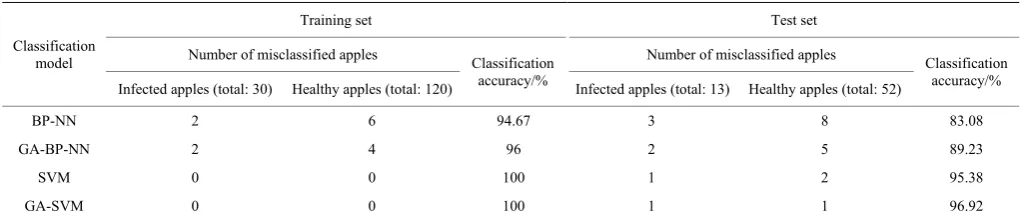
The classification results of the optimized GA-BP and GA-SVM models are shown in Table 3. The classification accuracy of BP-NN and SVM for the test set was 83.08% and 95.38%, respectively, indicating that SVM was more superior than BP-NN. The classification accuracy was 89.23% for GA-BP-NN and 96.92% for GA-SVM, indicating that the optimized models obviously improved classification results and that
GA-SVM performed better than GA-BP-NN. The main reason for the poorer prediction performance of GA-BP-NN was that the structure and the number of nodes in the hidden layer of artificial neural network were determined by experience. Moreover, possible premature convergence to the local optima and overfitting to the samples in the training set also affected the performance. Even though there were fewer samples, the classification accuracy of GA-SVM for the test set was the highest (96.92%) by applying GA to the global optimization for SVM.
Table 3 Classification accuracy of infected and healthy apples by different classification models
Classification model
Training set Test set
Number of misclassified apples Classification accuracy/%
Number of misclassified apples Classification accuracy/% Infected apples (total: 30) Healthy apples (total: 120) Infected apples (total: 13) Healthy apples (total: 52)
BP-NN 2 6 94.67 3 8 83.08
GA-BP-NN 2 4 96 2 5 89.23
SVM 0 0 100 1 2 95.38
GA-SVM 0 0 100 1 1 96.92
5.2 Test results and analysis of classification models for symptom types of moldy core in apples
The classifications results of the two models BP-NN and SVN and the two optimized models GA-BP-NN and GA-SVM are shown in Table 4.
By comparing the prediction results between BP-NN and SVM, it was found the classification accuracies of BP-NN and SVM for the test set were 55.56% and
Table 4 Classification accuracy of three types of symptoms of apple moldy core
Classification model
Training set Test set
Number of misclassified apples (classification accuracy/%) Average classification
accuracy/%
Number of misclassified apples(classification accuracy/%) Average classification
accuracy/% Browning Type I
(total: 13)
Moldy core Type II (total: 6)
Core rot Type III (total: 8)
Browning Type I (total: 4)
Moldy core Type II (total: 2)
Core rot Type III (total: 3)
BP-NN 3 (76.92%) 1 (83.33%) 2 (75%) 77.78 2 (50%) 1 (50%) 1 (66.67%) 55.56 GA-BP-NN 2 (84.62%) 1 (83.33%) 1 (87.5%) 85.18 1 (75%) 1 (50%) 0 (100%) 77.78 SVM 2 (92.59%) 0 (100%) 0 (100%) 97.53 2 (77.78%) 3 (66.67%) 1 (88.89%) 77.78 GA-SVM 1 (96.55%) 0 (100%) 0 (100%) 98.85 2 (77.78%) 2 (77.78%) 1 (88.89%) 81.48
5.3 Discussion
Results acquired indicate that it is feasible to detect moldy core in apples nondestructively and rapidly based on transmittance spectroscopy and wavelet transform is an effective method for extraction of characteristics from spectra. The main reason for the poorer prediction performance of GA-BP-NN was that possible premature convergence to the local optima and overfitting to the samples in the training set. Moreover, the simulation results show that the GA-SVM algorithm has the best generalization ability and precision, and the model has a worth of practical use. The research may offer a necessary theory base for fast, real-time, online and nondestructive detection of the presence and types of moldy core in apples. Due to the fast scanning speed, production lines in the online and real-time detection need to adjust the movement speed to the spectrometer to ensure adequate time for scanning the samples. It is also necessary to establish a stable model that covers a wide range of samples. Following researches are to establish the extensively representative and significant spectral measurement models based on in-depth analysis for spectral characteristics of moldy core in apples of different varieties and different producing areas.
Collecting transmittance spectra from intact apples have been proved to be difficult and unstable, since apple skin and tissues are high scattering materials. Transmittance spectra through apples would be weak and noisy, and are often affected by the size and shape of fruits. So, it is suggested that illumination source should reach a certain light intensity and it is necessary for noise removal to perform the spectral data preprocessing.
6 Conclusions
(1) Discrete wavelet transform can accurately
distinguish feature information and noise to realize the feature extraction and noise elimination. Hence, wavelet transform can simplify modeling structure and shorten modeling time, thus improving the overall modeling performance.
(2) Through analyzing spectral response characteristics of infected and healthy apples, it was found that there were obvious differences in the spectral curves between the infected and healthy apples in the wavelength range of 680-750 nm. This result provides a theoretical basis for detection of moldy core types in apples using transmittance spectroscopy.
(3) The GA-optimized model GA-SVM achieved a classification accuracy of 96.92% for detecting the presence of moldy core in apples, and an accuracy of 81.48% for distinguishing the three symptom types of moldy core in apples. These results indicate that it is feasible to detect moldy core in apples and its symptom types nondestructively and rapidly based on transmittance spectroscopy.
Acknowledgement
The research was supported by National High-tech Research and Development Projects (863) (2013AA10230402), National Natural Science Foundation of China (61473235), and the Major Pilot Projects of the Agro-Tech Extension and Service in Shaanxi (2016XXPT-05).
[References]
[1] Gao L L. Diversity of pathogens associated with moldy core of red Fuji apple in Shaanxi. Doctoral dissertation. Yangling: Northwest A&F University, 2010. (in Chinese with English abstract)
Defect detection in apples by means of X-ray imaging. In: Meyer & De Shazer (Eds.), Proceedings of SPIE. Volume 2907, Optics in Agriculture, Forestry, and Biological Processing II, Dec 1996; pp. 176–185.
[3] Chayaprasert W, Stroshine R. Rapid sensing of internal browning in whole apples using a low-cost, low-field proton magnetic resonance sensor. Postharvest Biology and Technology, 2005; 36(3): 291–30.
[4] Li F, Cai C. Ma H L. Nondestructive detection of apple moldy core based on bioimpedance properties. Food Science, 2013; 34(18): 197–202.
[5] Liu Y D, Ying Y B. A near-infrared diffuse reflection type measuring system for sugar content of fruit drops. Opto-Electronic Engineering, 2004; 31(2): 51–53.
[6] He D J, Maekawa T, Morishima H. Detecting device for on-line detection of internal quality of fruits using near-infrared spectroscopy and the related experiments. Transactions of the CSAE, 2001; 17(1): 146–148. (in Chinese with English abstract)
[7] Guthrie J A, Liebenberg C J, Walsh K B. NIR model development and robustness in prediction of melon fruit total soluble solids. Crop and Pasture Science, 2006; 57(4): 411–418.
[8] Han D H, Liu X X, Lu C, Wang J H, Sun X D. Study on optical-nondestructive detection of breakdown apples. Transactions of the CSAM, 2006; 37(6): 86–88. (in Chinese with English abstract)
[9] Clark C J, McGlone V A, Jordan R B. Detection of brownheart in ‘Braeburn’ apple by transmittance NIR spectroscopy. Postharvest Biology and Technology, 2003; 28(1): 87–96.
[10] McGlone V A, Martinsen P J, Clark C J, Jordan R B. On-line detection of brown heart in Breaburn apples using near infrared transmittance measurements. Postharvest Biology and Technology, 2005; 37(2): 142–151.
[11] Shenderey C, Shmulevich I, Alchanatis V, Lurie S, Ben Arie
R. NIRS detection of moldy core in apples. Food Bioprocess Technology, 2010; 3: 79–86.
[12] Ferrari C, Foca G, Calvini R,Ulrici A. Fast exploration and classification of large hyperspectral image datasets for early bruise detection on apples. Chemometrics and Intelligent Laboratory Systems, 2015; 146: 108–119.
[13] Huang W, Li J, Wang Q, Chen L. Development of a multispectral imaging system for online detection of bruises on apples. Journal of Food Engineering, 2015; 146(4): 62–71.
[14] Siedliska A, Baranowski P, Mazurek W. Classification models of bruise and cultivar detection on the basis of hyperspectral imaging data. Computers and Electronics in Agriculture, 2014; 106: 66–74.
[15] Li X L, He Y, Wu C Q. Least square support vector machine analysis for the classification of paddy seeds by harvest year. Transactions of the ASABE, 2008; 51(5): 1793–1799.
[16] Donald D, Everingham Y, Coomans D. Integrated wavelet principal component mapping for unsupervised clustering on near infra-red spectra. Chemometrics and Intelligent Laboratory Systems, 2005; 77(1/2): 32–42.
[17] Despagne F, Massart D L. Neural networks in multivariate calibration. Analyst, 1998; 123: 157R–178R.
[18] Vapnik V. The nature of statistical learning theory. New York: Springer, 1995.
[19] Holland J H. Adaptation in natural and artificial systems: An introductory analysis with applications to biology, control, and artificial intelligence. Michigan, USA: University of Michigan Press, 1975.
[20] Cristianini N, Ricci E. An introduction to support vector machines and other kernel-based learning methods. Beijing: Beijing Publishing House of Electronics Industry, 2004. [21] Keerthi S, Lin C. Asymptotic behaviors of support vector