Haptic-based
object directed behavior:
the role of the parietal operculum.
Student: Francesca Maule
Advisor: Dott. Luigi Cattaneo
A thesis submitted
for the degree of
Philosophiæ Doctor (PhD)
Doctoral school in Cognitive and Brain Sciences
XXVI cycle
Abstract
Table of contents
Abstract...III
Glossary... IX
PART I - A THEORETICAL OVERVIEW ...11
Chapter 1 - General insights on sensory- motor transformation Primary motor cortex field connection:...13
Ventral premotor cortex field connections: ...13
Dorsal premotor cortex field connections: ...15
PreSMA/SMA field connections: ...16
PMv and visually guided object directed behavior...17
Chapter 2 - The parietal operculum – cytoarchitecture, connectivity and physiology Anatomy of OP in non human primates ...21
Anatomy of OP in humans...26
Classical cytoarchitectonic maps ...26
Recent cytoarchitectonic atlases...28
Connectivity of OP in non-humans primates ...31
Connectivity of OP in humans...37
Physiology of OP in non human primates ...39
Recodring studies ...39
Stimulation studies...42
Non invasive neuroimaging study ...43
Physiology of OP in humans...44
Recording and stimulation studies ...44
Non invasive neuroimaging studies ...45
Summary of physiology of OP...48
Chapter 3 - The parietal operculum in sensory-motor integration: a literature review OP and sensory-motor integration ...52
OP in feedback mode - visually guided movements...54
OP in feed forward mode - working memory ...56
Lesions studies in humans...61
Summarizing the parietal operculum...64
PART III - EXPERIMENTAL WORK ...69
Introduction to studies and stimulation paradigms...66
Chapter 4 - Cortico-cortical connectivity with primary motor cortex Experiment I ...73
Introduction...73
Methods...74
Results ...81
Discussion ...82
Chapter 5 - Haptic driven grasping Introduction...85
Experiment II ...87
Methods...87
Results ...95
Discussion ...100
Experiment III ...105
Experiment IIIa ...105
Methods...105
Results ...110
Experiment IIIb ...112
Methods...112
Results ...118
Discussion of Experiment IIIa end Experiment IIIb ...120
Chapter 6 - Conclusions...127
List of Figures...130
Glossary
AIP anterior intraparietal sulcus aIPC anterior inferior parietal
cortex
aIPS anterior intraparietal sulcus aSPC anterior superior parietal
cortex
CMAd dorsal cingulate motor area CMAr rostral cingulate motor
area
condTMS conditioning TMS stimuli
DTI diffusion tensor imaging
ECD equivalent current dipole EIP extensor indicis proprius EMG electromiography
FEF frontal eye field fMRI functional magnetic
resonance imaging FV frontal visual area
ICMS Intracortical micro stimulation
ID1 interosseus dorsalis primus Ig granular insular cortex IPL inferior parietal lobule IPS intraparietal sulcus ISI interstimulus interval
M1 primary motor cortex MEG magnetoencephalography MEP motor evoked potential MIP middle intraparietal sulcus MPM maximum probabilistic map
PCC posterior parietal cortex PCG post central gyrus PET emission tomography pIPC posterior inferior parietal
cortex
PMC premotor cortex PMd dorsal premotor cortex PMv ventral premotor cortex PR parietal rostra area ProM proisocortical motor area pSPC posterior superior parietal
cortex
PV parietal ventral area RFs receptive fields RI retroinsular cortex
Ri retroinsular area rTMS repetitive transcranial
magnetic stimulation SEFs somatosensory-evoked
magnetic fields
SI primary somatosensory cortex
SII second somatosensory cortex
SDT Signal Detection Theory SMA supplementarymotor area
testTMS test TMS stimuli TMS transcranial magnetic
stimulation
TOR tactile object recognition
V1 primary visual cortex VA ventroanterio nuclei VIP ventral intraparietal VL ventrolateral nucley VPI inferior nuclei
VPL vantroposterior lateral thalamus
PART I - A THEORETICAL OVERVIEW
Chapter 1
General insights on sensory- motor transformation
are following described grouped according to the four motor fields mentioned in the paper.
Primary motor cortex field connection:
F1 ↔ PE
F1 is the motor region involved in the decomposition of complex actions computed in other motor regions in elementary movements. PE is a parietal region whose neurons are involved in processing of propioceptive information such as multiple joint positions. This connection probably allows the primary motor cortex to codify for the body position and control movement of limbs.
Ventral premotor cortex field connections:
F4 ↔ VIP
F5ab ↔ AIP
F5 neurons actively discharge during specific goal directed actions, especially if performed with the hand or directed to the mouth. In such frontal field there are represented distal arm movements grasping (with different kind of hand prehension), holding, tearing and manipulation. Neurons belonging to AIP are shown to codify for grasping of object of different shapes and sizes but not for their position. Moreover, there’s three different kinds of neurons existing in such parietal region: motor-dominants (active in both light and darkness), visuo-motor (addressed to encode the type of grip related to the intrinsic characteristic of the object), and visuo-dominants (dedicated to fixation of objects). Such network has been described as responsible for the transformation of the intrinsic characteristics of an object into suitable and appropriate hand movements.
F5c ↔ PF
Dorsal premotor cortex field connections:
F2 ↔ PEc/PEip
In the dimple region of F2, which is te one involved in this connection, movements are somatotopically represented (legs movements are dorsal while arm movements are ventral). Neurons’ electrical activity shows to be correlated with movements onset or even in advanced, supporting their probable involvement in motor preparation. Regarding the response to sensory stimuli, they show to answer to propioceptive stimulation. In relation to area PEc, there’s not much evidence in literature about its functional role. However, authors hypothesized its involvement with somatosensory stimuli for motor organization. More evidences exist in literature for PEip which show to respond to somatosensory stimuli, arm movement or limb projection in certain directions. It has been showed the presence of bimodal neurons responding to tactile and visual stimulation. Researchers have found interestingly that RFs of visual neurons are not fixed in their extension but expand according to specific motor action executed. Those two parietal regions have been depicted as involved in somatosensory control of movement and such connection with the frontal F2 has been hypothesized as be engaged in the control of limb movements on the basis of somatosensory information.
F2 ↔ MIP
In ventro-rostra F2, besides responding to propioceptive stimuli, neurons show to be responsive also to tactile and visual stimulation. Such response is reported also for MIP neurons. Despite the poorness of evidences regarding the functional activation of such parietal field, similarly to the connections F2 ↔ PEc/PEip, also this connection is
F7 ↔ PGm
Electrical discharge of F7 neurons occurs in relation to arm movements or even before their onset. Their response has been showed also as consequence of visual stimuli. Moreover, behavioral paradigms showed F7 neurons as involved in the spatial localization of external stimuli for reaching movements; such neurons appear to assume an important role in the conditional stimulus-response association tasks and in conditional movement selection. Authors report that the functional role of area PGm is largely unknown; however, its neurons present electrical activity during eye and/or arm movements.
PreSMA/SMA field connections:
F3 ↔ PEci
Similarly to area F1, neurons belonging to this field appear to discharge in response to active movements but differently form area F1, representation of movements are somatotopically organized in a mixed order, and multijoints movements are observed as consequence of micro stimulation. Its involvement in control of posture and postural adjustments has also been proposed. F3 neurons show to respond additionally in association to visual and somatosensory stimuli. Area PEci is also named as supplementary somatosensory area due to the fact that a complete somatotopic map is embedded in such field. Authors’ hypothesis is that such circuit is involved in a global control of the motor activity.
F6 ↔ prefrontal lobe
trivial; it shows to occur in correspondence of complex movements, visual presentation of stimuli and increase when the stimulus is moved toward the subject and the discharge is modulated according whether an object can or cannot be grasped. Authors propose F6 as a region controlling a potential action encoded in lateral parieto-frontal networks. Their hypothesis comes from the idea that even if neurons encoding a specific action are activated, the real onset of the action is conditioned by external factors (e.g. motivation). In their vision, F6 whose activity is conditioned by external contingencies acts as a controller for the onset of such action fulfilling a role in sequence organization of movements.
PMv and visually guided object directed behavior
connection between an area located at the junction between the anterior IPS and the inferior postcentral sulcus (Binkofski, Buccino et al. 1999) (Frey, Vinton et al. 2005) and the ventral part of the premotor cortex (including part of area 6a alpha and area BA 44 (Binkofski and Buccino 2006) (which has been classically considered to be a speech area but it is also related to hand actions (Rizzolatti, Fogassi et al. 2002)).
A specific review of the literature related to the premotor cortex is out of the purpose of this thesis; however, it is important to characterize its role into visually guided grasping. Neurons belonging to this region have been shown to be activated during manipulation and grasping. In (Binkofski, Buccino et al. 1999) for example, strong activation of PMv were obtained in subjects manipulating complex objects respect to simple objects (sphere) or in complex object manipulation followed by a naming task on the explored objects. In (Ehrsson, Fagergren et al. 2000) by means of an fMRI study, authors shown engagement of bilateral ventral premotor cortex, the rostral cingulate motor area (CMAr), the supramarginal cortex, the ventral lateral prefrontal cortex, and the right intraparietal cortex in subjects performing a precision grip respect to respect to when they used a palmar power grasp during a similar manipulative task. It was also shown in monkeys that such region contains neurons selective for specific different types of grasp which appear to be represented by different overall levels of activity within the F5-M1 circuit. In fact, in monkey grasping different objects, different pattern of modulation in neural electrical activity of PMv (F5) and M1 were recorded by suggesting, as written in the papers that “F5 grasping-related neurons play a role in translating visual information
about the physical properties of an object into the motor commands that are appropriate
for grasping, and which are elaborated within M1 for delivery to the appropriate spinal
machinery controlling hand and digit muscles”. The possible involvement of PMv in
al. 2004). In their study on macaque monkeys, they found that a conditioning electrical stimulation delivered over F5 could produce a significant modulation of motor outputs from M1 while by little or no detectable corticospinal output were obtained by stimulation of F5 alone. Details about the causality that characterize the relationship between bilateral PMv and its interaction with M1 in the context of hand and finger control during grasping have been provided in (Davare, Andres et al. 2006). By means of rTMS delivered either bilaterally on single unilaterally on subjects performing a simple grip-lift task with the right hand, authors showed the causal involvement of PMv in the grasping component of the movement. They in fact observed an incorrect positioning of finger on the object and an modified recruitment of hand muscles when the stimulation was delivered on PMv. In a following study (Davare, Montague et al. 2009), by means of double coil TMS, authors provided further details about the functional interplay between these regions during grasping by finding a short latency interactions at 6-8 ms. Furthermore, by observing effects of conditioning TMS over PMv on different muscles involved either in visually guided precision grasp or in whole hand grasp, they demonstrated that during a grasp preparation, interactions between PMv and M1 are modulated depending on the object to be grasped.
In the next chapter…
Chapter 2
The parietal operculum – cytoarchitecture, connectivity and
physiology
Anatomy of OP in non human primates
developed as classical post central areas and layer VI resulted to be divided into inner and outer zone less sharply separated form the adjacent white matter than the same layer in postcentral cortex.
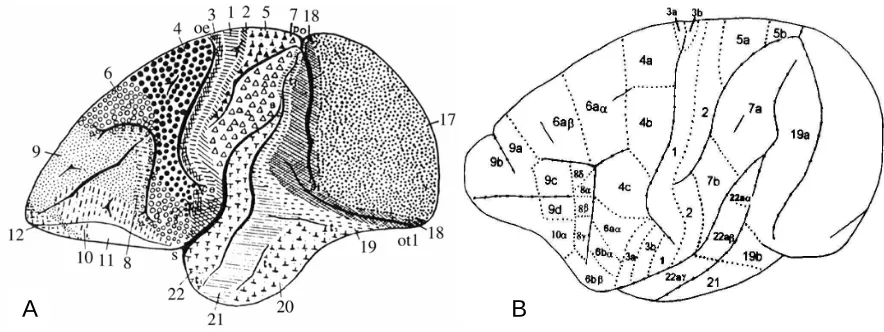
Figure 1. A: Brodmann cytoachitectonic map of cercopithecus (1905). B: Vogt and Vogt architectonic map (from (Cipolloni and Pandya 1999))
A further subdivision of parieto-opercular cortex has been provided by Pandya and Seltzer (Pandya and Seltzer 1982). With their research, by means of autoradiographic and ablation degeneration techniques on Rhesus monkey, they were able to divide the inferior parietal lobule in four different architectonic regions named PF, PFG, PG and OPt. Furthermore, they discerned two additional zones within OP with distinct architectonic features which they named PFop, PGop. Their maps are reported in Figure 2B and Figure 2C. As it is showed in the picture, the more rostral region lying below the intraparietal sulcus is PF followed caudally by PFG and at last by PG. Ventrally to area PF and lied along the Silvian fissure is the area PFop which is followed by area PGop which remains ventral to area PFG and PG. Considering area PFop and PGop, authors identified PFop as the location for SII (referring to parcellation proposed by Jones and Burton (Jones and Burton 1976) while PGop was defined as a ventral extension of the
cortex of IPL. According with results related to the laminar structure of these two OP areas, PFop did not show the columnar appearance which was noticed for surrounding regions such as PF. Moreover, authors observed a poor differentiation between layer III and layer IV. Contrarily, in region PGop layers were more sharply differentiated than in PFop and layer II and layer IV appeared distinct. At last, an occasional occurrence of
Figure 2. Cytoachitectonic maps A: Roberts and Akert (1963). Abbreviations: Allo, allocortex; CS, central sulcus; Ins a, agranular insular cortex; Ins d, dysgranular insular cortex; Ins g, granular insular cortex; IP, intraparietal sulcus; IPD, anterior subcentral sulcus; OFO, orbitofrontal cortex; PrCo, precentral opercular cortex; SA, arcuate sulcus; SP, principal sulcus; SSII, second somatosensory cortex; tr, transitional zone.)). B: Lateral view of the cerebral emisphere of macaca mulatta. Abbreviations: AN, annectent gyrus; AS, arcuate sulcus; CING S, cingulated sulcus; CC, corpus callosum; CF, calcarine fissure; CS, central sulcus; IOS, inferior occipital sulcus; IPS, intra parietal sulcus; LF, lateral (Silvian) fissure; LS, lunate sulcus; OTS, occipitotemporal sulcus; POMS, parietoccupital medial sulcus; PS, principal sulcus; RS, rhinal sulcus; STS, superior temporal sulcus. C: Intraparietal, lateral and cingulated sulci are opened in order to show the location of the zones lying within the sulci (Pandya and Seltzer 1982).
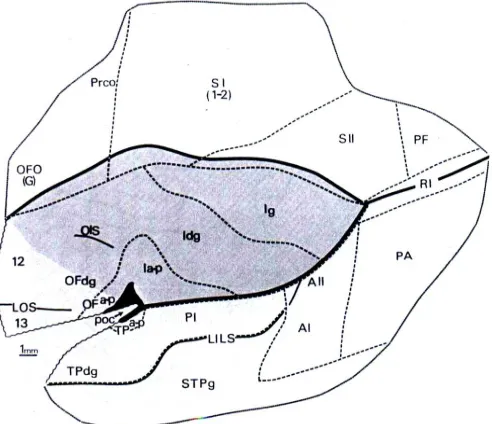
large pyramidal neurons in layer IIIc was observed. In the same year Mesulam and Mufson (Mesulam and Mufson 1982) published their research about architecture of the insula in old world monkeys providing various details also about surrounding regions such as temporal and frontoparietal operculum. The obtained cytoarchitectonic map is reported in Figure 3. In their map, SII region lies caudally to the primary somatosensory
A B
cortex (SI) and it extends rostro-caudally along the upper bank of the Silvian fissure sharing boundaries with retroinsular cortex (RI), the region PF and the posterior part of the insula (Ig). Their results were obtained by the observation of series of slices of the primates brains processed with dyers. Beside animal brains, also one human brain was included in the study and it was used for comparisons of results related to insula anatomical structure alone and not for surrounding regions. In relation to results regarding cytoarchitecture of anterior parietal regions, authors characterized the cortex of area SI (area 1 and 2) as granular cortex according with its densely cellular layer IV and moderately well-developed granularity in layer II. They moreover found distinct demarcation between layer V and VI. Regarding SII cortical architecture, authors
highlighted difficulties in differentiate it from SI. Both of these regions shown sublamination in layer III based on a variation on cells size. However authors found that, respect to SI structure, layer II in SII tended to be thicker, layer III appeared to have denser cellularity and separation form layer V and layer VI seemed be less clear.
Summary or cytoarchitecture of primates
Anatomy of OP in humans
Classical cytoarchitectonic maps
identified two regions named PFD and PFop. The former is a subcentral region which might correspond roughly to the location of BA 43. The latter, located caudally to PFD, might be the candidate for area BA 40 and taken together, these regions could be considered the location for SII in von Economo and Koskinas (von Economo and Koskinas 1925) map. Classical maps discussed above are reported in Figure 4.
Figure 4. Classical cytoarchitectonic maps. A: Brodmann map (Brodmann 1905). B: par of Vogt and Vogt parcellation of parietal operculum (Vogt and Vogt 1919). C: von Economo and Koskinas map (von Economo and Koskinas 1925). Adapted form (Caspers, Geyer et al. 2006)
A
B
Recent cytoarchitectonic atlases
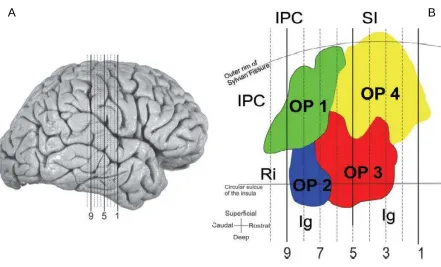
specific regions. They observed that based on its topography, OP4 may correspond to the parietal ventral area (PV) (Krubitzer, Clarey et al. 1995). In fact, similarly to PV, OP4 was identified as located superficially within the Silvian fissure close to the central sulcus and bordering the primary somatosensory cortex. Area OP1 which lied caudally to OP4 next to the inferior parietal cortex, was proposed as the analogue areas for non human primates SII (Krubitzer, Clarey et al. 1995). Similarly to SII and PV, also OP1 and OP4 shared a common border along medial to lateral direction. Area OP3 which was located deeper in the lateral sulcus than OP1 and OP4 and bordering with both of those areas, may topologically correspond to non human primates VS (Cusick, Wall et al. 1989). The association between OP2 with its corresponding primate area was more complex.
Figure 5. The location of areas OP 1-4 in according with (Eickhoff, Schleicher et al. 2006). A: slices considered for the analysis. B: flat map of OP parcellation (Eickhoff, Schleicher et al. 2006)
Connectivity of OP in non-humans primates
Cortico-cortical connectivity of the upper bank of the Silvian fissure has been widely studied in non human primates by means of injection of tracers producing detailed data about cortical projections of the OP. In the work of Pandya and Seltzer (Pandya and Seltzer 1982), connections of the posterior parietal cortex in Rhesus monkey were investigated by means of autoradiographic and ablation-degeneration techniques highlighting strong connections between the OP and the post central gyrus and the dorsal areas of the inferior parietal lobule. In their study they considered different regions of the post central gyrus (BA 3,1,2) and the posterior parietal cortex (superior parietal lobule: PE, PEc; inferior parietal lobule: PF, PFG, PG; parietal operculum: PFop, PGop). By observing labels originated from tracers or by evaluating terminal degeneration they were able to identify anatomical pathways connecting these cortical regions. Regarding IPL and OP connectivity, ablation performed in correspondence of BA 3,1 and 2 and in a portion of area PF produced a terminal degeneration in the area immediately caudal to the lesion PF and PFG, and more ventrally in PFop and PGop. Also isotope injection in correspondence of PF and PFG, besides highlighting connections in regions immediately close sites of injections, produced terminal labeling over the PFop (SII). Additionally, their study showed further afferents opercular projection originating in more caudal regions of the parietal lobe such as PEc and PG. In the same year Mesulam and Mufson published their research about afferents and efferents connections of the insula in Rhesus monkeys providing evidences for existing connections with OP region
(Mesulam and Mufson 1982; Mufson and Mesulam 1982). Retrograde tracers injections
monkeys. In their work, Stepniewska and colleagues injected tracers in primary motor cortex of the animal after identification of the injection site by means of intracortical microstimulation. They were then able to provide evidences for somatotopically distributed connections with motor areas such as dorsal premotor cortex (PMd), ventral premotor cortex (PMv), and SMA, but more interestingly, they confirmed the existence of an anatomical projection with somatosensory regions BA 3a,b, 1, 2, and SII and PV. They moreover highlighted connections with posterior parietal cortex, and cingulate cortex. Authors were furthermore able to differentiate connectivity between caudal M1 (M1c) and rostral M1 (M1r) which shown to produce different labeling. The former appeared to be connected primarily with somatosensory areas, while the latter with both non-primary motor cortex and somatosensory cortex. An exhaustive paper published by Cipolloni and Pandya (Cipolloni and Pandya 1999) investigated in Rhesus monkeys by using antero and retrograde tracer technique, the cortico cortical connectivity for fronto-parietal opercular areas considering the entire upper bank of the Silvian fissure. In their work they subdivided the dorsal Sylvian opercular area into four rostrocaudal sectors. As they described: “The frontal operculum extends from the beginning of Sylvian fissure to
the inferior precentral dimple; the pericentral operculum refers to the cortex at the level
of the ventral tip of the central sulcus from the inferior precentral dimple to the rostral tip
of the intraparietal sulcus; the parietal opercular region behind the pericentral operculum
extends from the end of the pericentral operculum to the caudal end of the Sylvian
fissure and is divided into rostral and caudal regions.”. In relation to parietal projection of
zone, the defense zone by classifying the nature of evoked movements. In such zones they injected retrograde tracers. They found dense connections between reach, defense and grasp zones with hand and forelimb representation in M1. Regarding M1 connections, beside dense inputs received from PCC they obtained connections with somatosensory hand/forelimb representation in area 3a, 3b, 1 and the area S2 /PV. In particular the latter region resulted labeled for connection with the grasp zone of M1. Together, such results are indeed in support of the involvement of OP in cortical networks involved in grasping. At last, a seminal work of (Galea and Dariansmith 1994) by injecting retrograde tracers in the cervical spinal cord of 11 Macaque monkeys investigated the corticospinal projections from neurons belonging to the somatosensory cortex. They identified at least nine different somatotopically organized projections.
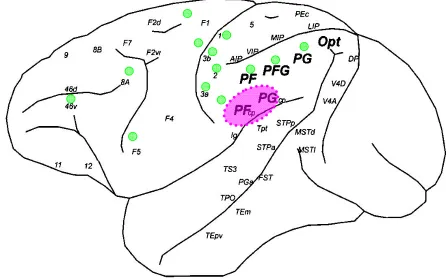
The most prominent projections were to frontal cortex (area 4, area 6, SMA, postarcuate cortex and the cingulated cortex). Beside projection to frontal cortex, the highlighted ipsilateral and controlateral projections form S2. They were able thus to show different separate population of corticospinal neurons and each of which with continuous access to all spinal motoneuron populations, stating the importance of cortical and spinal connections and highlighting their involvement in action coordination. A map summarizing main connection of the OP cortical fields is reported in Figure 6. The parcellation scheme was chosen according with the one proposed in (Pandya and Seltzer 1982).
Connectivity of OP in humans
delivered over ipsilateral M1 at a very short latency (4-7 ms) from conditioning stimuli. Such results doesn’t provide direct evidences of anatomical connections between the two regions, however, the resulting short-latency interaction supports the plausible existence of direct pathways of connections between OP and M1.
Physiology of OP in non human primates
As already discussed, the OP embeds the area SII. Basically, neurons in this area fire accordingly to different tactile stimulations of skin receptors. They moreover show activation during processes of texture discrimination and their response is also obtained with noxious and visual stimuli. Furthermore, neuronal firing within SII region has been recorded also in presence of thermal and propioceptive inputs. Hereafter some literature about physiological properties of SII and characterization of its receptive fields defined in non human primates by means of electrophysiological intracortical recordings and stimulation will be illustrated.
Recodring studies
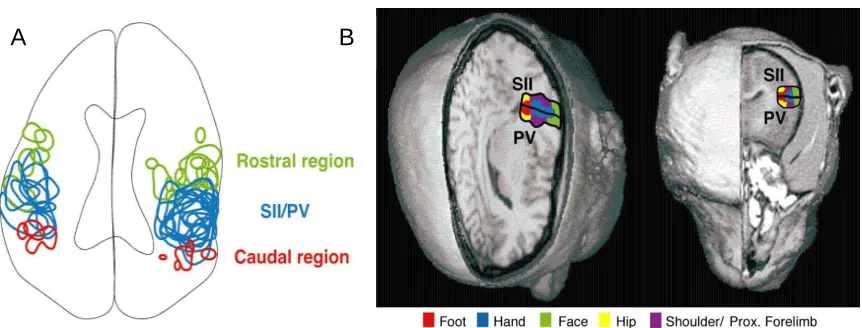
Figure 7. Summary map of the somatotopic organization of SII and PV in macaque monkeys (left). For comparison also the somatotopic organization of marmoset has been proposed (right) (Krubitzer and Kaas 1990). The two fields SII and PV appear to have a symmetric organization and they share a common boundary at the representation of the digits, toes and portion of the face.
they hypothesized their anterior field may correspond to area PV and that combined central-posterior fields might be the equivalent for SII.
Stimulation studies
majority of stimulation sites in PV and SII were unresponsive. However they found high threshold face movements evoked form both areas including the lower lip, eyelid and nose and in one case they obtained elbow movement evoked from presumably area SII.
Non invasive neuroimaging study
Physiology of OP in humans
In human OP, its physiological properties and receptive fields have been studied with different techniques. At first, electrophysiological intracortical recording and stimulation studies have been conducted on epilepsy patients in early 50’s. Later, with the advent of non invasive techniques the activation of human OP has been largely investigated with neuroimaging studies which supported electrophysiological outcomes and provided further details about its somatotopic arrangements.
Recording and stimulation studies
of both hands. Moreover, cortical stimulation applied in a point immediately medial produced plantar flexion controlateral foot. Authors highlighted consistency of these result with SII somatotopy obtained for primates.
Non invasive neuroimaging studies
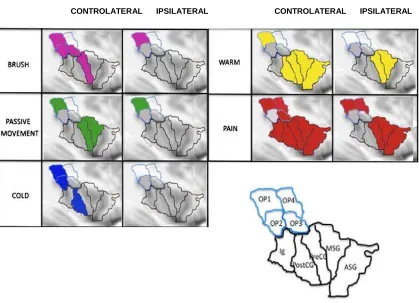
hand of subjects. On the base of cytoarchitectonic subdivision proposed by Eickhoff (Eickhoff, Schleicher et al. 2006) authors aimed to investigate whether these proposed subdivisions (named from OP1 to OP4) could embed distinct aspect of discriminative somatosensory functions. Stimuli employed for all subjects on the same body area were tactile stimulation, passive movements, innocuous cold stimuli, non noxious warm stimuli and heat pain.Results related to activation of controlateral and ipsilateral OP and insula are showed in Figure 9.
Figure 8. A: Reconstruction of an axial slice through the lateral sulcus with the activity patterns from all 16 cases collapsed onto a single drawing. All of the blue encircled areas denote the SII/PV region from all of the cases, the green denotes the rostral field (RL), and the red denotes the caudal field (C). B: Summary of the somatotopic organization of the second somatosensory area (SII) and the parietal ventral area (PV) on the upper bank and parietal operculum of the lateral sulcus of human (left) and macaque monkey (right) (as described in (Krubitzer, Clarey et al. 1995)).
In this work authors showed that all the different types of stimulation tested activated at least one region in SII and insula cortex and moreover that different stimuli corresponded to different patterns of activation. In relation to OP areas, controlateral OP1 showed activation for all types of stimulation suggesting its unspecific role in processing different somatosensory inputs. Both brush and passive movements activated controlateral and ipsilateral OP1 reminding to the similarities between the two
stimuli in terms of stimulated peripheral fibers. OP2, activated with cooling stimuli, was proposed by author as a possible sensory cortex for cold sensations. OP3 revealed its activation during brushing and pain stimuli and according to authors, this result was consistent with literature. At last, a bilateral widespread and intense activation of OP1 and OP4 was obtained after painful stimulation which leaded authors to argue in favor of an anterior specificity OP region to pain stimuli.
Summary of physiology of OP
Figure 9. Group activation maps after stimulation of the left hand. Left: controlateral activation of SII/insula. Right: Ipsilateral activation of SII/insula. (Mazzola, Faillenot et al. 2012). On the low-right: the new mask representing the regions of interests used in the analysis. Parietal operculum is composed by OP1, OP2,OP3 and OP4 (Eickhoff, Schleicher et al. 2006). Anterior insular cortex is composed by anterior short gyrus (ASG), middle short gyrus (MSG) and precentral insular gyrus (PreCG). Posterior insula includes Ig1, Ig2, Id1 and the post-central gyrus (PostCG) according to the probabilistic maps based on cytoarchitectonic maps included in (Eickhoff, Stephan et al. 2005).
According with results obtained for non human primates and humans, the OP is generally considered the site for the second somatosensory cortex. Despite slight differences presented in literature related to the number, the extension and the borders of fields composing this somatosensory area, a shared outcome is represented by its activation due to tactile stimulation. This feature allowed researchers to investigate its somatotopic organization leading them to find high analogies between non human primates and humans mapping. Moreover, non invasive neuroimaging studies allowed researchers to study SII response to different kind of stimulation, showing its activation also after noxious input, nerve stimulation and joints manipulation. Results have been investigated with different techniques which showed consistency in terms of location of cortical activation.
In the next chapter…
Chapter 3
The parietal operculum in sensory-motor integration: a
literature review
OP and sensory-motor integration
significant bilateral activation of both SII region and insula. They discussed the role of SII as a region involved in somatosensory integration finalized to produce a coherent image of the object for cognitive action. Considering together that afferent of SII are cutaneous and propioceptive types and that such region project also to M1, authors presented SII as a feedback provider for M1 due to its putative involvement into integration of propioceptive and tactile information.
OP in feedback mode - visually guided movements
putative aIPS in visually guided grasping assuming it as a crucial component in using visual shape to determine opposition space of the hands. Stimulus shapes grasped by subjects consisted of all 12 objects and used in psychophysical testing (Blake, Brady et al. 1992). Subjects performed serially three conditions in a fixed order such as point with right index, grasp with right thumb and index, and rest. By comparing activation due to grasping versus the one due to pointing, authors identified two significant sites of activation in the hemisphere controlateral to the performing right hand. The first site was described as area BA40, corresponding to area PF or PDE. The second activation was located in the left lateral sulcus extending into OP. Results of this study provided once again evidences for supporting involvement of human OP in grasping, by showing its activation in association with available haptic information concerning the objects’ shapes. All these studies are conducted in the visual modality and therefore OP activation is related to a feed-back control of action during the grasp phase. Interestingly if we compare grasping studies with the few studies on reaching (e.g. (Culham, Danckert et al. 2003) we see that OP is not active. In fact in their fMRI study Culham and colleagues obtained activation in human AIP when object size and shape computations were required to preshape the hand during grasping, while this region was not active during reaching which did not require preshaping.
OP in feed forward mode - working memory
Non-human primates
2002). Two vibrotactile stimulations at different frequency (ν1> ν2 or ν1< ν2) were
presented to the skin of the distal segment of the right hand of four monkeys (Macaca
mulatta) separated by a period of about 3 seconds. Monkeys were trained to use their
left hand to indicate at the end of each trial which of the two stimuli had the higher vibration frequency by pressing one of the two push button located either on the monkey’s left side or in front of it. They interestingly that while during the first stimulation, the firing rate of SII neurons encoded the stimulus frequency, during the second stimulation their response were a function of both past and current stimuli. Moreover, by analyzing responses during error trials they found that a bunch of hundred milliseconds after the presentation of the second stimulus SII response was correlated to monkey’s choice of action. They thus interpreted these evidences as a putative role of OP in processing past and present sensory information for decision-making.
Humans
somatosensory associations areas including SII were observed. In the somatomotor attention network, authors showed the involvement of frontal regions such as prefrontal cortex, SMA, premotor cortex, frontal eye fields. In relation to the ventro-temporal object recognition stream, they obtained activation of lateral occipital cortex and medial temporal lobe. By focusing on SII activation, authors identified this region belonging to ventrolateral somatosensory pathway which was previously proposed by (Mishkin 1979) as key route for tactile object processing in the integration of features. Authors, observing that significant activation of inferior somatosensory association areas such SII was still existing when sensory motor components were accounted for, concluded that such cortical region might have a key role in non perceptual aspects of TOR such as for example, tactile learning and sensory motor integration of information gained from exploration aimed to generate coherent image of an object.
Lesions studies in humans
Lesion analyses are one of the main neuroscientific tools to infer structure-function relationships. They rely on the combined analysis of a defined neurological deficit and the underlying critical brain area. In our case, studies related to parietal lesions and sensory syndromes and impairments in motor behavior provide useful findings about the involvement of this cortical region.
Among different sensory syndromes there are: Elementary sensory deficits
Astereognosis
Deficit of sense of position
Summarizing the parietal operculum
Cytoarchitecture of the OP in non human primates showed distinctive features compared to its neighboring regions, namely the primary somatic cortices and the inferior parietal lobule, thus confirming the specific identity of the opercular region. Connectivity studies provided evidence for major anatomical connections with the
primary sensory cortex, inferior parietal lobule, premotor cortex and primary motor cortex.
In humans, the classical cytoarchitectonic maps showed different levels of parcellation of IPL. All of them however identified an area of granular cortex within IPL that is referred to as secondary somatosensory area (SII).
A modern cytoarchitectonic map provided a detailed subdivision of human OP in four regions (OP1-OP4). Their probabilistic connectivity with other parts of the cortex was investigated with non invasive neuroimaging techniques. Significant connections were found with the primary somatosensory area, the inferior parietal lobule, the premotor cortex and the primary motor cortex.
Physiological properties of OP have been illustrated by means of single-cell recordings and intracortical microstimulation (ICMS) in non human primates. In humans most studies employ non-invasive techniques, though in some cases it was possible to record intracortical responses from SII in pre-surgical epileptic patients. Neural activation of the OP was observed for different types and orientation of tactile stimulation. For both non-human primates and humans, OP showed to embed two somatotopic maps, sharing one border along medio-lateral direction.
role in the use of tactile information for predictive movements was highlighted in works on visually guided grasping.
Finally some evidence indicates a role of the OP in tactile learning and tactile memory, retention and recall of haptically acquired information and mental representation of objects.
In the next chapter…
PART II – AIM OF THE STUDY
PART III - EXPERIMENTAL WORK
Introduction to studies and stimulation paradigms
The aim of this work is to investigate the role of OP on the context of haptic-based object directed behavior. In order to provide insights related to different aspects of this issue, four TMS experiments have been conducted by using different paradigms of stimulation and experimental tasks
Experiment I
This experiment aimed to test cortico-cortical connectivity between left OP and ipsilateral M1. This experimental hypothesis is supported by anatomical studies conducted on non-human primates that provide evidences of direct anatomical connections between the two regions justifying the hypothesis of their direct functional interaction. In this experiment a dual coil TMS paradigm was used in a no task-design and peak to peak amplitude of conditioned MEPs were compared to unconditioned ones in order to asses any possible effect introduced by the conditioning stimulation over OP.
Experiment II
required) and size of the object were compared with unconditioned for both exploration modalities and for different conditioning sites.
Experiment III
Experiment III is composed by two experiments hereafter called Experiment IIIa and Experiment IIIb.
Experiment IIIa
Given outcomes achieved with experiment 2, suggesting OP as a putative site for working memory in presence of a motor plan which requires grasping an object of a given geometry, a further step has been made in order to provide additional insights related to this functional aspect of OP. In the Experiment IIIa by using an on-line rTMS paradigm, the effects of repetitive stimulation were investigated by comparing the performance of participants receiving the stimulation over OP respect to different control conditions executing a purely discriminative match to sample task without motor planning.
Experiment IIIb
Dual coil TMS paradigm
Dual coil transcranial magnetic stimulation (TMS), which is also referred to as twin-coil TMS or bifocal TMS, is a powerful method to probe the functional link between cortical areas and to study the time curse of such interaction ((Civardi, Cantello et al. 2001; Koch, Del Olmo et al. 2007; O'Shea, Sebastian et al. 2007; Davare, Montague et al. 2009) by applying simultaneously two distinct coils to the participant’s head. Generally, a suprathreshold stimulus (testTMS) is applied over primary motor cortex in order to elicit a motor evoked potential which is a measurable entity. Before testTMS, a subthreshold conditioning stimulus (condTMS) is delivered in correspondence of a specific cortical region which is hypothesized to functionally interact with M1. The interstimulus interval (ISI) that produced significant variation of motor evoked potential is indicative of direct cortico-cortical connections. In this way it is possible to evaluate if an output activated by condTMS in one brain region works, at a specific latency, as input producing significant effects on the motor cortex excitability indicating then a functional interplay between the cortical areas. As pointed out in (Cattaneo and Barchiesi 2011) experiments in which such paradigm is applied are based on a priori assumption on where to position the condTMS to test effects on a specific behavior. The main limitation of such approach is given by the anatomical variability of the functional active regions among individuals.
On-line repetitive TMS paradigm
Chapter 4
Cortico-cortical connectivity with primary motor cortex
Experiment I
Introduction
Kleinschmidt et al. 2001) (Reed, Shoham et al. 2004). The first aspect that we decided to study in order to investigate the role of such region in motor behavior was its connectivity with motor regions such as ipsilateral primary motor cortex (M1). Thus, probing the functional connectivity between OP and ipsilateral M1 is the aim of the first experiment which was addressed by using dual coil TMS. In a recent article, (Cattaneo and Barchiesi 2011) authors mapped the connectivity of the entire hemisphere with the ipsilateral M1by means of such paradigm in subjects at rest. Among other results, we observed that TMS applied to the OP produced a short-latency effect on M1, supporting the presence of direct cortico-cortical connections between the 2 regions. These findings indicate that some OP neurons are just one synapse away from the motor cortex and are in agreement with anatomical studies in non human primates which show that in monkey OP, a substantial proportion of M1 neurons is stained following the injection of anterograde tracers (Mesulam and Mufson 1982; Mufson and Mesulam 1982; Pandya and Seltzer 1982; Cusick, Wall et al. 1989; Krubitzer and Kaas 1990; Stepniewska, Preuss et al. 1993; Cipolloni and Pandya 1999; Qi, Lyon et al. 2002; Disbrow, Litinas et al. 2003). Hence, in this first experiment we investigated by using dual coil TMS in baseline conditions the optimal stimulation point in the left OP cortex and we assessed the optimal intersitmulus interval between conditioning and test stimuli for eliciting short-latency modulation of M1.
Methods
Participants
gave written informed consent in accordance with the Ethical Committee of the University of Trento (protocol n. 2009-033).
MRI and Neuronavigation
Dual coil TMS
The stimulation paradigm used was the same as in (Cattaneo and Barchiesi 2011). Two different magnetic stimulators, each connected to a separate coil were used simultaneously. A Magstim 200 monophasic stimulator (The Magstim Company, Whitland, UK) was used to deliver the testTMS via a Magstim custom-made figure-of-eight coil with 50 mm diameter windings. A Magpro stimulator (Magventure, Skovlunde, Denmark) in biphasic stimulus modality produced the condTMS via an MC-B35 coil with winding diameter of 36 mm. The participants’ heads were held still with a chin-rest incorporating an additional lateral head-constrain. The testTMS coil was permanently positioned on hand motor cortex of the left-hemisphere and held in place by means of a mechanical support. It was oriented with the handle pointing medially forming a 90° angle with the midline. The optimal coil orientation for trans-synaptic stimulation of corticospinal neurons in the hand representation in M1 is known to be of 45° (Mills, Boniface et al. 1992). In our protocol however, in order to allow the concurrent presence of the two coils on the scalp surface we adopted the configuration described above. Besides, other studies have shown that also a current orientation perpendicular to the midline elicits preferentially indirect waves in the cortico-spinal descending volley (Sakai, Ugawa et al. 1997). TestTMS was delivered at an intensity corresponding to 120% of individual resting motor threshold (Rossini, Barker et al. 1994) calculated for the right interosseus dorsalis primus (ID1) muscle.
Electromyographic (EMG) recordings
amplifier (Cambridge Electronic Design, Cambridge, UK) and digitized by means of a CED 1401 micro Mk-II unit (Cambridge Electronic Design, Cambridge, UK) at a sampling frequency of 4 KHz. The EMG recording was triggered by the testTMS pulse (time=0.0) by means of the Signal software (Cambridge Electronic Design, Cambridge, UK).In each trial EMG was recorded from -250 ms to +250 ms and stored on a PC for offline analysis.
General design
This experiment aimed at establishing the optimal position and ISI to produce short-latency effects by condTMS to M1. To do so we tested participants while sitting at rest and moved the condTMS coil over a grid of scalp points that covered the whole of the OP region. Moreover we tested different ISIs between condTMS and testTMS (see Figure 10). The analysis of the data was first carried out on a single-subject basis by computing statistical scalp maps of the comparison between condTMS+testTMS trials with testTMS trials. Finally, a group analysis was carried out to generalize the findings from single subjects.
Mapping procedure
TMS was manually determined in each trial by the operator whenever the condTMS coil had been moved over the following point of the grid. All 9 points of the grid were therefore tested at every cycle of 9 consecutive condTMS+testTMS . This cycle was repeated 16 times in order to have 16 repeated measures of condTMS+testTMS for each grid point. Trials with only testTMS were interleaved in the mapping sequence every 3 condTMS+testTMS trials. The session of stimulation described was repeated for three blocks, each with a different ISI. To summarize, each of the 3 blocks was composed by 144 (9 points x 16 repetitions) condTMS+testTMS trials interleaved with 48 tTMS-only trials for a total of 192 trials. Conditioned TMS paradigms conventionally use the grand average of test MEP amplitudes from the whole block as the denominator of the normalization ratio (for example see (Kujirai, Caramia et al. 1993) or (Ziemann, Tergau et al. 1998)). In the present work we performed lengthy experimental sessions in which the test MEP amplitude was likely to vary greatly in the course of the block for spontaneous fluctuations of vigilance or for technical aspects such as coil heating and switching. We therefore decided to adopt a quasi-instantaneous measure of test MEP amplitudes represented by the average of two adjacent testTMS trials moving along the timeline of the block in a sliding window, as described in (Cattaneo and Barchiesi 2011). Therefore each MEP from condTMS+testTMS trials was normalized to the mean of the 2 test MEPs preceding and following the conditioned trial.
Computation of TMS statistical maps and group analysis
The data from each ISI was analyzed separately. As a result of MEP processing and normalization we obtained for each of the 3 ISIs a series of 16 normalized MEP amplitudes, each varying form 0 to +∞, for each of the nine points composing the grid.
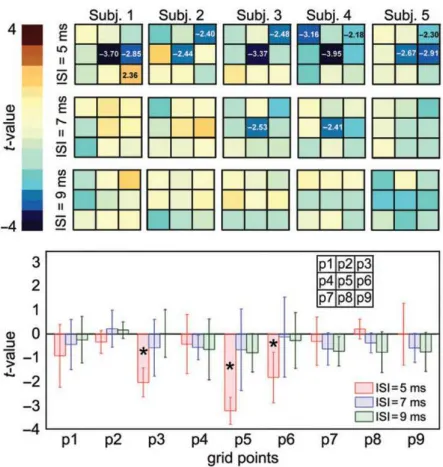
Figure 10. A: Dual coil TMS paradigm. CondTMS is delivered over the left OP; test TMS is delivered over ipsilateral M1. ISIs tested are 5,7,9 msec. B left: OP scalp grid points located over the left OP; B right: cortical projections of the scalp grid point s. The central sulcus is drawn in red. C: Motor evoked potentials were recordied from the first dorsal interosseus by means of Ag/AgCl superficial electrodes in a belly tendon montage.
inhibitory effects of condTMS. Such values were transformed logarithmically in order to obtain a distribution of the data varying between -∞ and +∞. After this process, values >0
represented facilitatory effects of condTMS and values <0 represented inhibitory effects of condTMS. At last, each of the 9 distributions of 16 data was analyzed in a 2-tailed t-test for single samples, against the null hypothesis that the distribution had a mean value of zero. Significance level for the t-test was corrected for the 9 comparisons within the grid and therefore was set to p = 0.05/9 = 0.0056. In order to quantify the distribution of the effects of condTMS at the group level we performed an ANOVA on t-values with 2 factors: ISI (3 levels: 5, 7 and 9 ms) and POINT (9 levels corresponding to the 9 grid points).
Results
The results of the mapping experiment show the existence of a short-latency modulation of condTMSdelivered over OP on corticospinal excitability which is both temporally and spatially specific. The single-sample t-test performed on the points of individual grids produced significant results in all 5 subjects only at the ISI of 5 ms. The location of significant spots was distributed along the mid portion of the grid. All significant effects were inhibitory (Figure 12 upper panel). The ANOVA with GRID POINT and ISI as within-subjects factors showed that a significant distribution of t-values was present only for the 5 ms ISI. The ANOVA also shows that at the group level, a significant effect of condTMS was observed only for the grid point p5 (Bonferroni-corrected p=0.02) (Figure 12 lower panel). This corresponded to the ventral part of the postcentral sulcus, at the border between the OP4 and the OP1 region.
Discussion
In the next chapter…
Chapter 5
Haptic driven grasping
Introduction
the classically defined the secondary somatosensory area (Eickhoff, Jbabdi et al. 2010). Moreover, in two our recent transcranial magnetic stimulation (TMS) studies (Cattaneo and Barchiesi 2011) and (Maule, Barchiesi et al. 2013) by applying a twin-coil paradigm of stimulation, beside mapping the optimal spot within the OP region for their interaction we found a very short latency (5ms) functional interplay occurring between OP and ipsilateral M1. Such results are in support of direct cortico-cortical connections and suggest a direct role of OP in the coordination of movement (Jäncke, Kleinschmidt et al. 2001) (Reed, Shoham et al. 2004) as a player involved in the direct transformation of somatosensory information into motor commands. The following experiments investigate with different experimental designs the nature of the involvement of OP in sensory motor integration.
In experiment II, we investigated the possibility that OP plays a direct role in haptically guided grasping. As well as in the Experiment I, we used the dual-coil TMS paradigm exploiting results previously obtained. Test stimuli (testTMS) were applied to M1 and conditioning TMS (condTMS) to the optimal spot of ipsilateral OP at 5 ms ISI (results obtained in Experiment I). OP-M1 connectivity was tested while participants were preparing the blindfolded grasp of an object, the variable size of which had been previously explored by the participant in the haptic or in the visual modality. In a complementary part of the experiment, we controlled for the validity of the effects of OP stimulation by implementing the same experimental paradigm with stimulation of the ventral premotor cortex (vPM), which is well known to play a role in visually rather than haptically guided grasping.
transcranial magnetic stimulation (rTMS) delivered over the left OP in two different tasks involving the temporarily retention of the size related information acquired haptically. In experiment IIIa we tested the effects of online rTMS on the accuracy of participants performing a simple non-motor match to sample discriminative task of haptically explored diameter-variable cylinders. The aim was to test whether the stimulation affected the retention of the haptically acquired information on the size of the cylinder in a task where no motor plan was required. Differently, in Experiment IIIb we evaluated such effects on the hand preshaping in a delayed grasping of previously haptically explored diameter-variable cylinders. In this case, the effect of the noise introduced by rTMS was assessed on a task requiring a motor plan. In both experiments, we controlled for the validity of effect on OP, by implementing the same experimental paradigm on left primary visual cortex (V1) and with sessions without stimulation.
Experiment II
Methods
Participants
Electromyographic (EMG) recordings
General design and experimental setup
Participants were tested in dynamic conditions during a delayed reach and grasp task. They were divided in two groups according to whether they received condTMS over the OP or over the vPM. In both groups, condTMS intensity was set at 90% of resting motor threshold computed for right ID1. The condTMS coil was positioned following the neuronavigation system on one single spot for every participant. In the OP group, condTMS was applied to a single point in the OP region that was established on the basis of the maps obtained in Experiment I, as a point along the postcentral sulcus, 2 cm above the Silvian fissure. In the vPM group, the target of condTMS was established on the basis of previous dual-coil TMS experiments for the study of vPM-M1
Figure 13. Schematics of the apparatus controlling inter-plug distance.
were sitting on a comfortable chair with their head placed in the chin rest. A custom-made (www.lmelettronica.it) apparatus holding two plastic plugs (Figure 13) was placed in front of them. The distance between the plugs was varied randomly at every trial. The lower plug was fixed to a vertical panel, the upper plug moved inside a vertical fissure in the panel, by virtue of a linear actuator connected to a stepper motor in the rear part of the panel. The whole automation was implemented by using an ArduinoUNO microcontroller (www.arduino.cc) which generated at each trial a random number that was converted in inter-plug distance. A linear potentiometer connected to the plugs assured feedback to the microcontroller on the inter-plug distance. The setup consisted additionally in A) a switch on the table on which the participant’s right hand rested and which signaled the start of the Reach phase. B) a small touch-sensitive sensor placed over the upper plug in order to signal the time of contact of the hand with the object. C) a pair of computer-controlled liquid crystal shutter goggles (Plato translucent technologies inc.) worn by subjects in the whole experiment. Additionally participants were wearing earphones in order to hear acoustic cue-sounds and white noise played in the background. The participant’s left hand was kept in a rest condition for the whole experimental session.
Trial structure and order
participant had already acquired the information on the inter-plug distance to be grasped, and was waiting to use that information to perform the grasp.
Figure 14. Top: Visual exploration trial. Bottom: Haptic exploration trial. Each trial is composed by four phases: A) Rest, change of inter-plug distance; B) Exploration: visual or haptic according with the type of trial (note that in haptic trials the vision of the object was occluded in this phase); C) Set: the subject waits for the GO-signal; D) Reach-grasp: the participant, with vision occluded in both trial types, performs a thumb-index grasping of the two plugs.
in Visual Exploration. Goggles instead remained closed in haptic trials and an acoustic cue-sound prompted the subjects to start tactile exploration of the plugs with their right hand. After 2000 ms another acoustic cue advised participant to finish the exploration and go back to the rest position. During this Delay phase, subjects were instructed to be ready to perform a thumb-index grasp of the plugs whenever they heard the GO signal. The GO signal occurred randomly between 2100 and 2600 msec after the end of the visual or haptic inspection. Once the plugs were grasped, subjects returned with their right hand relaxed on the home switch. The inter-plug distance was fully randomized between trials, the order of trials was fixed in the sequence: 1) Visual Exploration trial with cond+testTMS, 2) Visual Exploration trial with testTMS alone, 3) Haptic Exploration trial with cond+testTMS, 4) Haptic Exploration trial with testTMS alone. This basic sequence was repeated 50 times for a total duration of the experimental session of 35 minutes. For each trial, the set interplug distance and the timing of the go signal (TMS) were recorded in a log file by the Arduino system. The number of trials was 200 per each experimental session corresponding to 50 trials per each of the four conditions: 1) single pulse-visual trial, 2) single pulse-haptic trial, 3) dual pulse-visual trial and 4) dual-pulse-haptic trial.
MEP data analysis
factor and a physiological process is widely accepted and validated in functional neuroimaging studies (for more details see (Friston, Frith et al. 1991; Friston 1995; Friston, Frith et al. 1995). In our work we decided to adopt this approach, and considered in our analysis the mutual combination of r-correlation coefficients between MEPs of the two antagonist muscles and the size of the grasped object. More precisely, we correlated MEP amplitudes with target size separately per each of the four conditions: 1) single pulse-visual trials, 2) single pulse-haptic trials, 3) dual pulse-visual trials and 4) dual pulse-haptic trials. Each r value was computed on 50 pairs of data. In our opinion the use of a statistical parameter to describe the distribution of single trial measures (MEP amplitudes) according to an experimental variable (the target size) is more reliable than the conventional approach based on the extraction of mean values of MEP amplitudes in factorial designs. The main reason for this is that mean values of MEP amplitudes are strongly influenced by outlier data and that MEP amplitudes are not distributed normally, being comprised between 0 and +∞. The use of correlation
movement. Therefore, besides their absolute values, also the mutual relation of r-values between the two muscles within each condition is informative because it indicates whether the MEP modulation reflects the actual reach-grasp EMG pattern, in which it is expected that r-values for the EIP muscle are more positive than those from the ID1 muscle. The r values were used as dependent variable in an ANOVA with the 3 within-subjects factors MODALITY*PULSE*MUSCLE and a between-within-subjects factor, i.e. the GROUP (2 levels: OP group and vPM group).
Analysis of EMG during the reach-grasp action
pulse-haptic trial, 3) dual pulse-visual trial and 4) dual-pulse-haptic trial. Therefore each r value was computed on 50 pairs of data. The EMG-target size correlations were then analyzed with an ANOVA with 4 within-subjects factors: TIME (6 levels corresponding to the 6 consecutive time bins), MODALITY (2 levels, visual or haptic), PULSE (2 levels, single or dual pulse) and MUSCLE (2 levels, ID1 and EPI) and one between-subjects factor, GROUP (2 levels, OP and vPM) as between-subjects factor.
Results
Correlations between MEPs and target size
was present between the mean r-coefficients of the 2 muscles in the dual-pulse modality, i.e. when also OP had been stimulated with TMS (Bonferroni-corrected p=0.00006).
Figure 15. Grey columns indicate the mean r-coefficients calculated on the MEPs from the 2 muscles in the different experimental conditions. Line-circle elements indicate the individual data. The asterisks indicate the significant post-hoc comparisons.
p=0.022) but not in the single-pulse trials (Bonferroni-corrected p=1.0). Additionally, as a post-hoc analysis aimed at assessing whether any correlation was present between the MEPs in each category and the target size, we performed single-sample t-tests against the null hypothesis of mean x = 0.0. The results did not show any significant result (minimum p=0.08).
Effects of TMS on the subsequent reach-grasp movement
Figure 16 illustrates qualitatively in one representative subject the relation between the EMG recorded from the two muscles and the size of the object to be grasped. The results of the ANOVA showed a TIME*MUSCLE interaction (F(5, 110)=62.57, p<0.000001) which indicates the divergent time course of the r-coefficients from the two muscles during the Reach-Grasp phase. As shown in Figure 17 the IP muscle showed an activity that was correlated from very early in the reach with the geometry of the target object as indicated by the deviance from the zero value (dashed line in Figure 17).
The ID1 muscle on the contrary is specifically activated in relation to the object only very late in the reach and maximally during the grasp. The most complex result of the ANOVA was a GROUP*MODALITY*TIME*MUSCLE interaction (F(5, 110)=3.43, p=0.006) that is illustrated in Figure 18.
Figure 18. r-coefficients resulting from the correlation of EMG values in the Reach- Grasp phase with the inter-plug distance. Error bars indicate 95% CI. The 2nd bin, which resulted to be related to the 4-way interaction, is highlighted with a gray shade and an asterisk.
p=0.003) interaction was present. Post-hoc comparisons indicated that the interaction was due to the fact that in the visual modality the mean r-coefficients were significantly different between the two muscles (Bonferroni-corrected p=0.027) but not so in the haptic modality (Bonferroni-corrected p=1.0). Within the OP group, the results are not specific for the condition of dual pulse but are generally observed in the group of subjects who have been stimulated on the OP compared to those stimulated over the vPM.