PRIMARY RESEARCH
Systematic analysis of gene expression
profiles reveals prognostic stratification
and underlying mechanisms for muscle-invasive
bladder cancer
Ping‑Bao Zhang
1,2, Zi‑Li Huang
3, Yong‑Hua Xu
3, Jin Huang
4, Xin‑Yu Huang
1and Xiu‑Yan Huang
1*Abstract
Background: Muscle‑invasive bladder cancer (MIBC) is originated in the muscle wall of the bladder, and is the ninth most common malignancy worldwide. However, there are no reliable, accurate and robust gene signatures for MIBC prognosis prediction, which is of the importance in assisting oncologists to make a more accurate evaluation in clinical practice. Methods: This study used univariable and multivariable Cox regression models to select gene signatures and build risk prediction model, respectively. The t‑test and fold change methods were used to perform the differential expres‑ sion analysis. The hypergeometric test was used to test the enrichment of the differentially expressed genes in GO terms or KEGG pathways.
Results: In the present study, we identified three prognostic genes, KLK6, TNS1, and TRIM56, as the best subset of genes for muscle‑invasive bladder cancer (MIBC) risk prediction. The validation of this stratification method on two datasets demonstrated that the stratified patients exhibited significant difference in overall survival, and our stratifica‑ tion was superior to three other stratifications. Consistently, the high‑risk group exhibited worse prognosis than low‑ risk group in samples with and without lymph node metastasis, distant metastasis, and radiation treatment. Moreover, the upregulated genes in high‑risk MIBC were significantly enriched in several cancer‑related pathways. Notably, PDGFRB, a receptor for platelet‑derived growth factor of PI3K‑Akt signaling pathway, and TUBA1A were identified as two targets of multiple drugs. In addition, the angiogenesis‑related genes, as well as two marker genes of M2 mac‑ rophage, CD163 and MRC1, were highly upregulated in high‑risk MIBC.
Conclusions: In summary, this study investigated the underlying molecular mechanism and potential therapeutic targets associated with worse prognosis of high‑risk MIBC, which could improve our understanding of progression of MIBC and provide new therapeutic strategies for the MIBC patients.
Keywords: Muscle‑invasive bladder cancer (MIBC), Stratification, Overall survival, Drug‑target, M2 macrophage
© The Author(s) 2019. This article is licensed under a Creative Commons Attribution 4.0 International License, which permits use, sharing, adaptation, distribution and reproduction in any medium or format, as long as you give appropriate credit to the original author(s) and the source, provide a link to the Creative Commons licence, and indicate if changes were made. The images or other third party material in this article are included in the article’s Creative Commons licence, unless indicated otherwise in a credit line to the material. If material is not included in the article’s Creative Commons licence and your intended use is not permitted by statu‑ tory regulation or exceeds the permitted use, you will need to obtain permission directly from the copyright holder. To view a copy of this licence, visit http://creat iveco mmons .org/licen ses/by/4.0/. The Creative Commons Public Domain Dedication waiver (http:// creat iveco mmons .org/publi cdoma in/zero/1.0/) applies to the data made available in this article, unless otherwise stated in a credit line to the data.
Background
Muscle-invasive bladder cancer (MIBC) refers to cancers happening in the muscle wall of the bladder. Symptoms such as pain with urination, blood in the urine, and low
back pain are often observed in patients with bladder can-cer. Bladder cancer is one of the most common malignan-cies worldwide [1]. It is much more commonly diagnosed in men than in women, but female patients are usually with more advanced stages at the time of diagnosis, and exhibit less favorable survival [2]. MIBC has the potential to spread to nearby lymph nodes and other organs. In severe cases, metastasis would affect distant organs such as lungs and liver [3]. Increasing age is considered to be the main risk
Open Access
*Correspondence: [email protected]
1 Department of General Surgery, Shanghai Jiaotong University Affiliated
Sixth People’s Hospital, 600 Yi Shan Road, Shanghai 200233, People’s Republic of China
factor for bladder cancer, and impacts from smoking and exposure to some industrial chemicals are also reported to be significant [4].
With the advances in high-throughput technologies, sev-eral prognostic biomarkers have been revealed previously. Genetically, genome-wide association studies (GWAS) have revealed that genes on chromosome 8q24, particularly the
PSCA gene (Prostate Stem Cell Antigen), were associated with increased metastatic potential of bladder cancer [5, 6]. A hypothesis reasons that these genes detected by GWAS may be associated with androgen receptor responsive-ness and inducing androgen-independent pathways, which stimulates tumor growth [5]. The losses of regions on 10q (including PTEN), 16q, and 22q, and gains on 10p, 11q, 12p, 19p, and 19q were positively associated with metastasis in muscle-invasive bladder cancers [7]. With the genome-wide gene expression data, several studies have identified a combination of gene signatures to predict the prognosis of MIBC. Specifically, four gene signatures, IL1B, S100A8,
S100A9 and EGFR, have been reported to have the capa-bility of predicting MIBC progression [8]. The novel com-bination markers of USP18 and DGCR2 can also predict survival in patients with muscle invasive bladder cancer [9]. In addition, NR1H3 expression is identified as a prognostic factor of overall survival for patients with muscle-invasive bladder cancer [10]. However, there are some limitations for these studies. First, the gene signatures identified by these studies were not robust due to lack of validation dataset or small sample size in validation dataset. Second, compara-tive analysis was not conducted on the performance of these gene signatures for MIBC prognostic prediction. Third, the potential mechanism resulting in the worse prognosis has not been thoroughly investigated. In addition, the potential therapeutics for patients with worse prognosis was not pro-posed by these studies. In the present study, to avoid these limitations, we attempted to detect a combination of gene signatures for MIBC prognostic prediction and stratifica-tion. Based on the prognostic stratification, we also inves-tigated the underlying molecular mechanism and potential therapeutic targets associated with worse prognosis of high-risk MIBC, which could improve our understanding of MIBC progression and provide new therapeutic approaches for these high-risk patients.
Materials and methods Data collection and pre‑processing
The TCGA-BLCA gene expression datasets [11] and cor-responding clinical data were obtained from UCSC Xena Browser [12] (https ://xenab rowse r.net/datap ages/). The E-MTAB-1803 dataset [13] was downloaded from Array-Express (http://www.ebi.ac.uk/array expre ss/) database [14]. The TCGA-BLCA dataset was divided into two
subsets for model training and validation, using random sampling without replacement. For each gene in the three datasets, the expression values were discretized as high or low expression if the expression values higher or lower than its corresponding median.
Gene expression data of MIBC cell lines
We also collected the normalized gene expression data of 30 MIBC cell lines from Gene Expression Omnibus (GEO) database [15], with accession number GSE47992 [16]. The Wilcoxon rank-sum test and fold change method were used to identify differentially expressed genes between two conditions.
Overrepresentation enrichment analysis (ORA)
Overrepresentation enrichment analysis, which was based on hypergeometric test, was implemented by R package clusterProfiler with enrichKEGG function [17]. We chose adjusted P-value 0.05 as the threshold for the selection of significant pathways.
Gene set enrichment analysis
The gene set enrichment analysis was implemented in R/Bioconductor fgsea [18]. The genes were pre-ranked based on the Z statistic obtained in a differential expres-sion analysis between high-risk and low-risk groups. 1000 permutations were used to calculate the enrichment significance.
Cox proportional hazards regression analysis
Cox proportional hazards regression analysis was per-formed to evaluate the differences in overall survival between patients from two risk groups or two expression status, which was implemented using R package survival
with coxph function. Kaplan–Meier curves were plotted to visualize the overall survival of each group. The risk score for each patient was calculated based on the expres-sion of three gene signatures selected by predict.coxph
function. These three signature genes were selected from previously identified prognostic gene pool by Maximum Minimum Parents and Children (MMPC) algorithm [19], which was implemented by R package MXM with MMPC function.
Drug‑target analysis
Statistical analysis
R version 3.6.0 was used to perform all analyses. Statisti-cal comparisons between groups were performed using the t-test or non-parametric Wilcoxon rank-sum test. P < 0.05 was considered as indicative of statistically sig-nificant differences.
Results
Identification of prognostic genes and construction of prognostic model for MIBC
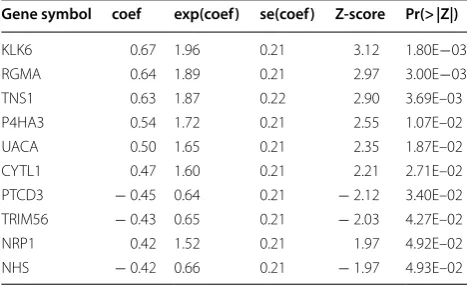
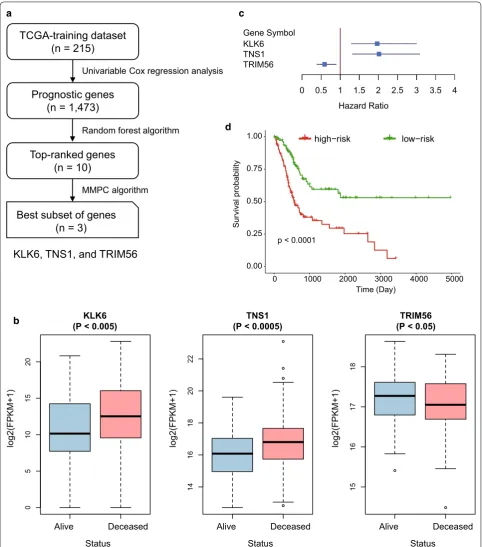
To select prognostic genes for prognostic model con-struction, we designed a systematic data analysis work-flow to search for a subset of genes. We first divided the samples from TCGA into training and validation data-sets, which were labeled as TCGA-training (n = 215) and TCGA-validation (n = 214), respectively. Univari-able Cox proportional hazards regression analysis was conducted to identify a total of 1473 prognostic genes (Log-rank test, P < 0.05). These prognostic genes were then ranked by their importance estimated by random forest algorithm. The univariable Cox regression analysis of the top-ten genes were listed in Table 1. Subsequently, the Maximum Minimum Parents and Children (MMPC) algorithm successfully identified three prognostic genes,
KLK6, TNS1, and TRIM56, as the best subset of genes (threshold for MMPC = 0.05). As shown in Fig. 1b, c,
KLK6 and TNS1 were more abundantly expressed in deceased patients than in living patients (Wilcoxon rank-sum test, P < 0.005), and their expression patterns were negatively correlated with patients’ overall survival, while higher expression of TRIM56 was observed in liv-ing patients (Wilcoxon rank-sum test, P < 0.05), indicat-ing a favorable prognosis. Finally, multivariable Cox proportional hazards regression model was constructed based on these three prognostic genes, and the patients were divided into high-risk and low-risk groups based on their risk scores estimated by the Cox model (median of
the risk score as the threshold). As illustrated in Fig. 1d, the samples from high-risk and low-risk groups exhibited significantly different prognostic outcomes (Log-rank test, P-value < 0.0001), suggesting that the stratification by the Cox model was closely associated with MIBC overall survival.
To investigate the biological function of the three prog-nostic genes in MIBC, we collected 30 MIBC cell lines. For each of the three prognostic genes, we calculated their expression in each cell line, ranked them and selected the first four as cell lines with the high expression and the last four as ones with the low expression, respectively. We then compared these four highest expression cell lines with the corresponding four lowest expression cell lines. Subsequently, KEGG enrichment analysis revealed that differentially expressed genes (DEGs) in KLK6 high expression cell lines were enriched in pathways such as tight junction and cell adhesion molecules (P < 0.05, Additional file 1: Table S1), suggesting that high expres-sion of KLK6 in MIBC may be associated worse progno-sis via regulation of cell–cell communication. Moreover, KEGG analysis of DEGs between cells with high and low expression of TRIM56 revealed that TRIM56 was highly associated with mismatch repair (MMR). Low expression of TRIM56 in MIBC may be associated with the defect in MMR (Additional file 1: Table S1). In addition, we did not observe any KEGG pathways enriched by the DEGs related to TNS1. However, previous studies [23, 24] have reported that TNS1 could increase the metastatic poten-tial and alter expression of genes involved in cell motility in colorectal cancer, and may be a potential prognos-tic biomarker in human colorectal cancer. These results indicated that KLK6 and TRIM56 may be associated with worse prognosis of MIBC via regulating cell–cell com-munication and MMR, respectively.
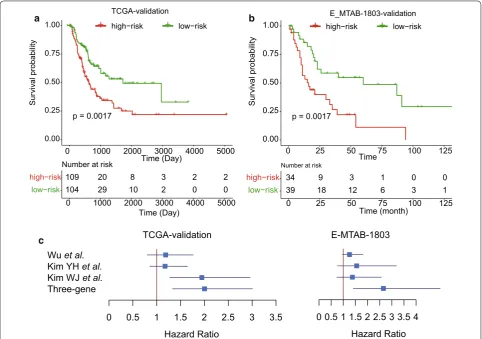
Validation of the prognostic stratification in two datasets To validate our prognostic stratification in MIBC risk prediction, we first preformed stratification on the sam-ples (n = 214) from TCGA-validation dataset. Moreo-ver, we also collected another gene expression dataset E-MTAB-1803 with detailed follow-up information from the ArrayExpress database. A total of 73 samples with follow-up information was included for stratification (see “Materials and methods”). Remarkably, the stratified groups in each of the two validation datasets exhibited significant difference in overall survival (Fig. 2, P < 0.005), suggesting that the prognostic stratification for MIBC was robust.
To further demonstrate the performance of the three-gene-signature-based stratification in MIBC cohorts, we compared our method with three other stratification methods based on the three-gene-signature with three
Table 1 The top-ten prognostic genes ranked by random-forest-based importance
Gene symbol coef exp(coef) se(coef) Z‑score Pr(> |Z|)
KLK6 0.67 1.96 0.21 3.12 1.80E−03
RGMA 0.64 1.89 0.21 2.97 3.00E−03
TNS1 0.63 1.87 0.22 2.90 3.69E–03
P4HA3 0.54 1.72 0.21 2.55 1.07E–02
UACA 0.50 1.65 0.21 2.35 1.87E–02
CYTL1 0.47 1.60 0.21 2.21 2.71E–02
PTCD3 − 0.45 0.64 0.21 − 2.12 3.40E–02
TRIM56 − 0.43 0.65 0.21 − 2.03 4.27E–02
NRP1 0.42 1.52 0.21 1.97 4.92E–02
TCGA-training dataset
(n = 215)
Prognostic genes
(n = 1,473)
Top-ranked genes
(n = 10)
Univariable Cox regression analysis
Random forest algorithm
Best subset of genes
(n = 3)
MMPC algorithm
KLK6, TNS1, and TRIM56
+++++ +
+ + +++++
++++++ ++++++
++++++ +++ +++
+ +
+ +++++++++
++++++++++++++++++++
+++ ++++++++++
+++++++
+ + +++++++++ +++++++ +++ +++ + + + +
p < 0.0001
0.00 0.25 0.50 0.75 1.00
0 1000 2000 3000 4000 5000
Time (Day)
Su
rv
iv
al probabilit
y
+
high−risk+
low−riska
b
c
d
Alive Deceased
05
10
15
20
KLK6 (P < 0.005)
Status
log2(FPKM+1
)
Alive Deceased
14
16
18
20
22
TNS1 (P < 0.0005)
Status
log2(FPKM+1
)
Alive Deceased
15
16
17
18
TRIM56 (P < 0.05)
Status
log2(FPKM+1
)
Gene Symbol KLK6 TNS1 TRIM56
0 0.5 1 1.5 2 2.5 3 3.5 4 Hazard Ratio
Fig. 1 The development and construction of Cox proportional hazard regression model of three‑gene‑signature. a The workflow for the
other stratification methods proposed by Wu et al. [10], Kim et al. [8, 9], which were used to predict the over-all survival of MIBC. We found that our stratification based on three-gene-signature was superior to the others (Fig. 2c). Although the stratification by Wu et al. showed similar performance with ours in TCGA-validation data-set, its performance on E-MTAB-1803 dataset was much poorer than the stratification by three-gene-signature. These results suggested that our stratification exhibited better performance in predicting overall survival for MIBC.
The stratification was a prognostic factor independent of clinically prognostic indicators and radiation treatment As our prognostic model exhibited satisfying perfor-mance on all MIBC patients from both training and vali-dation sets, it was also necessary to investigate whether this stratification was a prognostic factor independent of clinically prognostic indicators, such as lymph node and distant metastasis, and radiation treatment. We
constructed a multivariable Cox regression model using the three gene signatures and other clinical cofactors-such as lymph node, distant metastasis, and radiation treatment-as variables, and observed that these three genes were significantly associated with the prognosis in Cox models with and without these clinical cofactors (Table 2), suggesting that the three gene signatures still maintained prognostic significance in the multivariable regression model with the clinical factors.
To further demonstrate that the stratification was a prognostic factor independent of clinically prognos-tic indicators and radiation treatment, we also con-ducted statistical tests on both TCGA-validation and E-MTAB-1803 datasets. Consistently, the high-risk and low-risk groups exhibited significant difference in over-all survival among samples with or without lymph node metastasis, which were observed in both of the valida-tion datasets (Fig. 3a, b, log-rank test, P < 0.05). Simi-larly, the high-risk group also exhibited worse overall survival than the low-risk group among samples with +++
++
+++++++ ++ +++++
+++++ +++
+++++++
+++ ++ ++ + ++
+++++++++ ++++++++++++++++++
++++++++++++++++
+++++++++++ ++++++ + + ++
+ +
p = 0.0017
0.00 0.25 0.50 0.75 1.00
0 1000 2000 3000 4000 5000
Time (Day)
Su
rv
iv
al probability
+
high−risk+
low−risk109 20 8 3 2 2
104 29 10 2 0 0
low−risk high−risk
0 1000 2000 3000 4000 5000
Time (Day) Number at risk
TCGA-validation
++
+++ +
++ + ++++
+ +
+ + +
+ + +++
+ +
++ p = 0.0017
0.00 0.25 0.50 0.75 1.00
0 25 50 75 100 125
Time
Su
rv
iv
al probabilit
y
+
+
high−risk low−risk
34 9 3 1 0 0
39 18 12 6 3 1
low−risk
high−risk
0 25 50 75 100 125
Time (month) Number at risk
E_MTAB-1803-validation
a b
Wu et al.
Kim YH et al.
Kim WJ et al.
Three-gene
0 0.5 1 1.5 2 2.5 3 3.5
Hazard Ratio
0 0.5 1 1.5 2 2.5 3 3.5 4 Hazard Ratio
TCGA-validation E-MTAB-1803
c
and without distant metastasis from TCGA-validation dataset, and among samples without distant metasta-sis from E-MTAB-1803 dataset (Fig. 3c, d, log-rank test,
P < 0.05). Exceptionally, the statistical significance was not observed among samples with distant metastasis from E-MTAB-1803 dataset, which may be resulted from the small sample size (Fig. 3d, n = 29). Furthermore, the high-risk group had worse prognosis than the low-risk group among samples with and without radiation treat-ment from both TCGA-validation and E-MTAB-1803 dataset (Fig. 4, P-value < 0.1). These results demonstrated that the three-gene stratification of MIBC samples was a prognostic factor independent of both clinically prognos-tic indictors and radiation treatment.
The biological differences between the two risk groups and potential therapeutic targets of the high‑risk group To improve our understanding of the biological differ-ences between these two risk groups, we performed dif-ferential gene expression analysis on the two validation datasets (t-test, adjusted P-value < 0.05). The upregu-lated and downreguupregu-lated genes were subjected to KEGG enrichment analysis, respectively. However, the downreg-ulated genes were not enriched in any KEGG pathways, while the upregulated genes were enriched in human pap-illomavirus infection, PI3K-Akt signaling pathway, ECM-receptor interaction, focal adhesion, protein digestion and absorption, and relaxin signaling pathway (Fig. 5a, FDR < 0.05). The co-occurrence of PI3K-Akt signaling pathway, ECM-receptor interaction, and focal adhesion suggested that these two risk groups showed significant difference in tumor microenvironment. Further inves-tigation of PI3K-Akt signaling pathway highlighted the upregulated components, such as RTKs (receptor tyrosine kinases), ECM (extracellular matrix), and ITGA (Integ-rin alpha subunit) (Fig. 5b). The genes involved in PI3K-Akt signaling pathway were significantly upregulated
in high-risk group as compared with the low-risk group (Fig. 5c).
To further search for drug and therapeutic targets for patients in the high-risk group, we mapped the upregu-lated genes in the high-risk group to the drug–target interaction network, and identified 8 genes,
includ-ing ADAM12 (ADAM Metallopeptidase Domain 12),
CTGF (Cellular Communication Network Factor 2),
CTSK (Cathepsin K), GUCY1A2 (Guanylate Cyclase 1 Soluble Subunit Alpha 2), INHBA (Inhibin Subunit Beta A), PDGFRB (Platelet Derived Growth Factor Recep-tor Beta), TNFSF4 (TNF Superfamily Member 4), and
TUBA1A (Tubulin Alpha 1a), as the potential therapeu-tic targets (Fig. 5d). Notably, PDGFRB, a receptor for platelet-derived growth factor, was the most frequent target of several drugs, suggesting that the patients in high-risk group could be treated with the inhibitors of PDGFRB. In addition, TUBA1A was also identified as the potential target of multiple drugs for high-risk MIBC. Notably, a clinical trial was conducted to study the effectiveness of Ixabepilone, which was an inhibi-tor of TUBA1A, in treating patients with progressive or metastatic urinary tract cancer (The clinical trial acces-sion: NCT00021099).
To prove the practicability of these target-drug/ inhibitor predictions, we performed literature research for these pairs. Among the drugs targeting PDGFRB
and TUBA1A, 6 and 4 drugs were reported to be used in the treatment of MIBC (Additional file 2: Table S2), respectively. Particularly, drugs of sorafenib, imatinib, dasatinib, sunitinib, vinflunine, vinblastine, trastu-zumab emtansine, and trastutrastu-zumab for PDGFRB or
TUBA1A were shown to have the potentials in treating MIBC by in vitro, in vivo or clinical trials. The mapping of the upregulated genes in high-risk group to drug– target interaction network provided multiple therapeu-tic candidates for the patients of high-risk group.
Table 2 The multivariable Cox models with and without clinical factors including lymph node, distant metastasis, and radiation treatment
coef: coefficients for the variables included in Cox model; Pr(> |Z|): P-value for the variables
Cox model without clinical cofactors Cox model without clinical cofactors
coef exp(coef) se(coef) z Pr(> |Z|) coef exp(coef) se(coef) z Pr(> |Z|)
KLK6 0.6767 1.9673 0.2135 3.1440 0.0017 0.6910 1.9957 0.2199 3.1425 0.0017
TNS1 0.7012 2.0161 0.2171 3.2300 0.0012 0.5928 1.8091 0.2250 2.6354 0.0084
TRIM56 − 0.5287 0.5894 0.2135 − 2.4760 0.0133 − 0.5554 0.5738 0.2180 − 2.5474 0.0109
Lymph node (yes) – – – – – 0.5065 1.6595 0.2220 2.2817 0.0225
Distant metastasis (yes) – – – – – 0.6021 1.8259 0.2209 2.7260 0.0064
+ +++ +++ +++ + + + + ++ +++ + + ++
p = 0.001
0.00 0.25 0.50 0.75 1.00
0 25 50 75 100 125
Time (Month)
Sur
viv
al probabilit
y
+high−risk+low−risk ++
+
+
p = 0.032
0.00 0.25 0.50 0.75 1.00
0 10 20 30 40
Time (Month)
Su
rv
iv
al probability
+high−risk +low−risk Lymph-node-netagtive Lymph-node-positive E-MTAB-1803 ++ + +++ ++ + + + + +++ + + + + +++ +++++ + + + ++ ++ +
p = 0.074
0.00 0.25 0.50 0.75 1.00
0 1000 2000 3000 4000 5000
Time (Day) Su rv iv al probabilit y TCGA-validation a E-MTAB-1803 ++ +++++ + ++++++ +++++ + ++ + ++ + + +++++++ ++++++++++++++++++ ++++++++ ++ ++++++ ++++ + + +
p = 0.0059
0.00 0.25 0.50 0.75 1.00
0 1000 2000 3000 4000 5000
Time (Day) Su rv iv al probabilit y TCGA-validation b + ++ + ++ + + + ++ + ++ + + ++
p = 0.023
0.00 0.25 0.50 0.75 1.00
0 25 50 75 100 125
Time (Month) Su rv iv al probability E-MTAB-1803 Distant-metastasis-netagtive + + + + +
p = 0.32
0.00 0.25 0.50 0.75 1.00
0 10 20 30 40 50
Time (Month) Su rv iv al probabilit y Distant-metastasis-positive + ++++ + ++++ +++ + + ++ + ++ +++ ++ +++++++++++++ ++++++++++ +++ ++ +++++ + +
p = 0.01
0.00 0.25 0.50 0.75 1.00
0 1000 2000 3000 4000 5000
Time (Day) Su rv iv al probabilit y ++ + + +++ + ++ + +++ ++ + +++ + ++ + ++++ ++++++ + +++++ + +++ ++ + + + + +
p = 0.041
0.00 0.25 0.50 0.75 1.00
0 1000 2000 3000 4000
Time (Day) Su rv iv al probabilit y E-MTAB-1803 TCGA-validation TCGA-validation
+high−risk +low−risk
+high−risk +low−risk
+high−risk+low−risk
+high−risk +low−risk
+high−risk+low−risk
+high−risk +low−risk c
d
The comparison of the prognostic stratification and TCGA classification
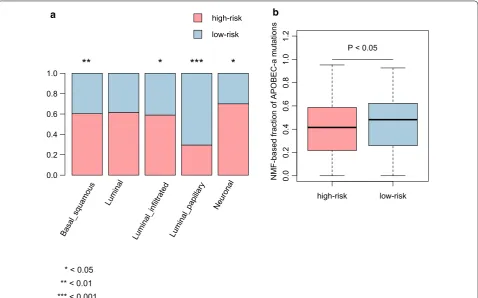
We compared our prognostic stratification with the TCGA classification, and found that the Basal-squamous, Luminal infiltrated, and Neuronal subtypes were highly enriched in high-risk group (P < 0.05, Fig. 6a), In con-trast, Luminal-papillary subtype was highly enriched in low-risk group (P < 0.05, Fig. 6a). For the five mutational signatures including, C>T_CpG, a, APOBEC-b, ERCC2, and POLE, only APOBEC-a was found to be higher in low-risk group than in high-risk group (P < 0.05, Fig. 6b), suggesting that the mutations of patients in low-risk group might be caused by the dysfunction of APOBEC3A. Furthermore, the results also suggested that the patients with APOBEC-a mutation signature might have a better prognosis.
Identification of immune infiltration patterns for MIBC To reveal the landscape of immune cells infiltrating into tumor tissues of MIBC, we first collected 24 immune cell types and angiogenesis-related genes from the pre-vious study [25]. The gene set enrichment analysis
was performed to identify immune cells that exhib-ited more remarkable infiltration in high-risk MIBC as compared with low-risk samples. We found that mac-rophage was highly filtrated into tumors of the high-risk MIBC (Fig. 7a, FDR < 0.05). The angiogenesis-related genes were highly upregulated in high-risk MIBC (Fig. 7b, FDR < 0.05), suggesting that the angiogen-esis was an important indicator for poor prognosis of MIBC. Moreover, two marker genes of M2 macrophage,
CD163 (CD163 molecule) and MRC1 (Mannose Recep-tor C-Type 1), were observed significantly upregulated in high-risk MIBC (Fig. 7c, P-value < 0.05) in all datasets except M-TAB-1803 dataset due to the lack of probes quantifying related gene expressions. These results fur-ther suggested that M2 macrophage may be the major infiltrated immune cells in high-risk MIBC and promote the progression of MIBC.
Discussion
Bladder cancer is one of the most common malignancies worldwide [1]. Several studies [8–10] have proposed sev-eral approaches to select and combine gene signatures
+ +
+++ +
++ +
+++
+ +
+
+ +
+ + ++ + +
++
p = 0.029
0.00 0.25 0.50 0.75 1.00
0 25 50 75 100 125 Time (Month)
Su
rv
iv
al probabilit
y
++++++ ++ +++++ +++++
+++ +++++++
+++
++ ++ + +
++++
+++++++++++++++ +++++++++++++
+++++++++++
+++++ + + ++
+ +
p = 0.0033
0.00 0.25 0.50 0.75 1.00
0 1000 2000 3000 4000 5000 Time (Day)
Su
rv
iv
al probabilit
y
E-MTAB-1803 TCGA-validation
Radiation-untreated
+high−risk +low−risk
+high−risk +low−risk
+ + +
+
+
p = 0.0072 0.00
0.25 0.50 0.75 1.00
0 20 40 60 80
Time (Month)
Su
rv
iv
al probabilit
y
E-MTAB-1803 TCGA-validation
Radiation-treated
+
+ ++ + +
p = 0.1
0.00 0.25 0.50 0.75 1.00
0 1000 2000 3000 4000 5000 Time (Day)
Su
rv
iv
al probabilit
y
+high−risk +low−risk
+high−risk +low−risk
a
b
Relaxin signaling path way
Protein digestion and abso rption Focal adhesion ECM−receptor int
eractio n
PI3K−Akt signaling pathw ay
Human papillom avirus in
fection
0.08 0.10 0.12 0.14 0.16 GeneRatio Count
6 7 8 9101112 0.010.030.05 p.adjust
a b
GNG11 COL1A2 COL6A3 COL6A1 PDGFRB THBS2 COL1A1 THBS4 ITGA11 COMP group risk
ITGA11 COL6A1 COL1A2 COL1A1 COL6A3 PDGFRB THBS2 COMP GNG11 THBS4 group risk
risk 0.5
−0.5 group
low−risk
high−risk −3 −2 −1 0 1 2 3
c E-MTAB-1803 TCGA-validation
ORANTINIB
JI-101 XL-999 IMATINIB
CM-082
TG100-801
CHEMBL120077 MIDOSTAURIN
LINIFANIB VATALANIB LUCITANIB
MK-2461 NINTEDANIB
Anlotinib SU-11652
ILORASERTIB
SEMAXANIB
DOVITINIB
CHEMBL406375 PAZOPANIB REGORAFENIB
CHEMBL377193 CRENOLANIB
QUIZARTINIB RG-1530 SORAFENIB TOSYLATE
SUNITINIB
SU-14813 CEP-2563
IMATINIB MESYLATE X-82
SORAFENIB
CHEMBL1908396
PD-0166285 (CHEMBL3545196)
MASITINIB
XL-820 PAZOPANIB HYDROCHLORIDE
Puquitinib
AXITINIB TELATINIB
ENMD-981693 FORETINIB
PDGFRB
TAK-593
TANDUTINIB CEDIRANIB NILOTINIB
NINTEDANIB ESYLATE
COLCHICINE
LEXIBULIN PACLITAXEL
TUBA1A INDIBULIN
VINCRISTINE SULFATE CTGF
TRASTUZUMAB EMTANSINE SOTATERCEPT FG-3019
VINFLUNINE
FOSBRETABULIN DISODIUM
CTSK
CHEMBL437501 RELACATIB BRENTUXIMAB VEDOTIN
TNFSF4 OXELUMAB
BALICATIB ODANACATIB
CHEMBL598952 GUCY1A2 INHBA
DOCETAXEL HYDRATE
SUNITINIB MALATE MOTESANIB Famitinib SU-014813
CDP-860 DASATINIB
PHENOBARBITAL
VINORELBIN DITARTRATE
ADAM12 PLINABULIN
CROLIBULIN
ERIBULIN MESYLATE
ILOMASTAT VINBLASTINE SULFATE IXABEPILONE
CABAZITAXEL
target drug/inhibitor d
for predicting the prognosis of MIBC, however, these gene signature sets have not been systematically com-pared with one another, and their performance on inde-pendent datasets are not satisfying. In the present study, we aimed to detect a combination of gene signatures for MIBC prognostic prediction and risk stratification. Based on the systematic data analysis, we identified three prognostic gene signatures, KLK6, TNS1, and TRIM56, as the best subset of genes. KLK6, a member of the kal-likrein, was able to predict tumor recurrence in epithe-lial ovarian carcinoma [26]. Moreover, KLK6 has been reported to regulate epithelial-to-mesenchymal transi-tion (EMT) and serve as prognostic biomarker for head and neck squamous cell carcinoma patients [27], which also indicated that the poor prognosis in MIBC samples with high expression of KLK6 might be associated with the dysfunction of EMT. TNS1 was rarely reported to be associated with cancer, but was identified as a poten-tial biomarker in human colorectal cancer [23] and a regulator of metastatic potential in colorectal cancer via altering expression of genes involved in cell motility [24]. In contrast, previous studies [28, 29] have identi-fied TRIM56 as a tumor suppressor through activation of TLR3/TRIF signaling pathway, which was consistent
with the result that TRIM56 expression was a favorable indicator of MIBC in this study. Utilizing the expression profiles of these three signatures, we successfully built a multivariable Cox regression model to calculate risk scores and stratified the MIBC patients into high and low risk groups.
To demonstrate the high performance of the prog-nostic stratification based on MIBC risk prediction, we selected two independent cohorts as validation datasets. Remarkably, the stratified groups in the two validation datasets both exhibited significant difference in over-all survival (Fig. 2, P < 0.005). To further demonstrate the capability of the three-gene-signature in MIBC risk stratification, we also compared our three-gene-signa-ture-based method with three other stratification meth-ods by Wu et al. [10], Kim et al. [8, 9], and found that our method was superior to the others as patients strati-fied with our method exhibited a more significant dif-ference in overall survival between high- and low-risk groups, suggesting that this prognostic stratification for MIBC was more robust and accurate. In addition, we also investigated whether this stratification was independent from other clinical indicators, such as lymph node and distant metastasis, and a history of radiation treatment, Basal_squamous
Lumina l
Luminal_infiltrated Luminal_papillar y
Neuronal
0.0 0.2 0.4 0.6 0.8 1.0
high-risk low-risk
high-risk low-risk
0.
00
.2
0.
40
.6
0.
81
.0
1.
2
NMF-based fraction of APOBEC-a mutations
P < 0.05
a b
**
*
***
*
* < 0.05 ** < 0.01 *** < 0.001
0.0 0.2 0.4
Enrichment profile Hits Ranking metric scores 0 20000 40000 60000
−4 0 4
Rank in Ordered Dataset
Expression (Preranked by Z-score
)
TCGA-training (FDR < 0.05)
En
richment Score (ES)
0.0 0.1 0.2 0.3 0.4 0.5
0 20000 40000 60000
−4 0 4
TCGA-Validation (FDR < 0.05)
Rank in Ordered Dataset
0.0 0.2 0.4 0.6
0 20000 40000 60000 −4
0 4
E-MTAB-1803 (FDR < 0.05)
Rank in Ordered Dataset
0 20000 40000 60000 −4
0 4
Rank in Ordered Dataset
Expression (Preranked by Z-score
)
TCGA-training (FDR < 0.05)
Enr
ichment Score (ES)
0 20000 40000 60000 −4
0 4
TCGA-Validation (FDR < 0.05)
Rank in Ordered Dataset
0 20000 40000 60000 −4
0 4
E-MTAB-1803 (FDR < 0.05)
Rank in Ordered Dataset 0.0
0.2 0.4 0.6 0.8
0.0 0.2 0.4 0.6
0.0 0.2 0.4 0.6
0.8 0.8
a
b
Macrophage
Angiogenesis
low−risk
10
12
14
16
18
20
TCGA−training
10
12
14
16
18
20
22 TCGA−validation
10
12
14
16
18
20
TCGA−training
10
12
14
16
18
20
TCGA−validation
high−risk low−risk high−risk low−risk high−risk low−risk high−risk
CD163
(P-value < 0.05) (P-value < 0.05)MRC1
c
Enrichment profile Hits Ranking metric scores
which could affect the MIBC prognosis. Consistently, the high-risk group exhibited worse prognosis than low-risk group in samples with and without lymph node metas-tasis, distant metasmetas-tasis, and a history of radiation treat-ment. Specifically, we found that none of the three other stratifications selected the gene signatures based on uni-variable Cox analysis and their functionality. However, the present study selected the three gene signatures by integrating the univariable Cox analysis and Maximum Minimum Parents and Children (MMPC) algorithm, the strength of which is the maintenance of the statistical sig-nificance in both univariable and multivariable analyses, not only in univariable analysis.
Moreover, PI3K-Akt signaling pathway, a critical sign-aling pathway for cancer cell formation and progres-sion [30–33], was highly activated in the high-risk group according to the results from differential expression analysis and gene set enrichment analysis. In addition to PDGFRB, other upstream receptor tyrosine-kinases (RTKs) in PI3K-Akt signaling pathway, such as EGFR,
CSF1R, FGFR1, FLT4, FLT3, NGFR, NTRK1, PDGFRA, and TEK, were also observed to be upregulated in the high-risk group (P < 0.05, Additional file 3: Figure S1). These results further suggested that overexpression of these RTKs may be responsible for PI3K-Akt signaling pathway hyper-activation, and RTKs may serve as thera-peutic targets in high-risk MIBC. Recently, an FGFR fam-ily inhibitor, erdafitinib, was approved by the U.S. Food and Drug Administration (FDA) to treat locally advanced or metastatic bladder cancer in adult patients with sus-ceptible genetic alteration in FGFR3 or FGFR2, whose condition still progressed during or following prior plat-inum-containing chemotherapy. Therefore, we proposed that the erdafitinib treatment may work on patients of high-risk group, when platinum-containing chemother-apy failed to bring satisfying results.
In general, immune cells were infiltrated into tumor cells. We found that macrophage was highly filtrated into the high-risk MIBC (Fig. 7a, FDR < 0.05), and the angiogenesis-related genes were highly upregulated in high-risk MIBC (Fig. 7b, FDR < 0.05). More importantly, two M2 macrophage markers, CD163 and MRC1, were observed to be significantly upregulated in high-risk MIBC (Fig. 7c, P-value < 0.05). The co-occurrence of M2 macrophage infiltration and hyper-active angiogenesis in high-risk samples suggested that M2 macrophage may promote the angiogenesis of high-risk MIBC, which was consistent with previous studies [34–36].
However, the present study still has some limitations. First, gene expression profiles of patients with long-term follow-ups should be collected to further assess the robustness of our stratification. Second, data regarding the efficacy of certain drugs in high-risk MIBC are not
available, and in vitro and in vivo studies are needed to yield more experimental evidences. There is no experi-ment to validate the association between M2 macrophage and angiogenesis. Nevertherless, this study provides a new perspective on the molecular mechanisms behind high-risk MIBC, and has successfully illustrated how these mechanisms are related to the prognostic outcomes of MIBC patients.
Conclusions
The present study has investigated the underlying molec-ular mechanism and potential therapeutic targets asso-ciated with worse prognosis of high-risk MIBC, which could improve our understanding of the progression of MIBC and provide new therapeutic targets for the man-agement of MIBC.
Supplementary information
Supplementary information accompanies this paper at https ://doi. org/10.1186/s1293 5‑019‑1056‑y.
Additional file 1: Table S1. The predicted pathways that the signature genes may participate in.
Additional file 2: Table S2. The potential anticancer drugs for MIBC based on the literature mining.
Additional file 3: Figure S1. The differential expression significance of Receptor Tyrosine Kinases (RTKs) between high‑risk and low‑risk groups.
Abbreviations
MIBC: muscle‑invasive bladder cancer; NMIBC: non‑muscle‑invasive bladder cancer; GWAS: genome‑wide association studies; lncRNA: long non‑coding RNAs; MMPC: maximum minimum parents and children; DGIdb: Drug Gene Interaction Database; RTKs: receptor tyrosine kinases; ECM: extracellular matrix; ITGA : integrin alpha subunit.
Acknowledgements
We acknowledge the contribution of all investigators at all participating study sites. We are also grateful to Dr. Li Zhang from School of Statistics, East China Normal University (Shanghai, People’s Republic of China), for providing expert technical assistance with statistical analysis.
Authors’ contributions
X‑YaH and P‑BZ conceived and designed the experiments. P‑BZ, X‑YaH, Z‑LH, Y‑HX, and X‑YuH acquired data, related materials, and analysis tools. P‑BZ, X‑YaH, and Z‑LH analyzed the data. P‑B Z, X‑YaH, Z‑LH, Y‑HX, and JH wrote the paper. All authors read and approved the final manuscript.
Funding
This study was supported by grants from the medical‑engineering cross fund of Shanghai Jiao Tong University (No. YG2017MS13), the pre‑research fund of Shanghai sixth People’s Hospital (LYZY‑0229), the international foundation of translational medicine for abroad scholars and students, U.S. and China (No. UCTMP2015‑03C001), and the national natural science foundation of China (No. 81272401).
Availability of data and materials
The datasets used and/or analyzed during the current study are available from the corresponding author on reasonable request.
Ethics approval and consent to participate
Consent for publication
Participants gave their written informed consent for the materials to appear in publications without limit on the duration of publication.
Competing interests
The authors declare that they have no competing interests.
Author details
1 Department of General Surgery, Shanghai Jiaotong University Affiliated
Sixth People’s Hospital, 600 Yi Shan Road, Shanghai 200233, People’s Republic of China. 2 Department of Urinary Surgery, Affiliated Hospital of Nantong
University, Nantong 226021, People’s Republic of China. 3 Department of Radi‑
ology, Xuhui Central Hospital of Zhongshan Hospital, Fudan University, Shang‑ hai 200031, People’s Republic of China. 4 Department of Pathology, Shanghai
Jiaotong University Affiliated Sixth People’s Hospital, Shanghai 200233, People’s Republic of China.
Received: 3 July 2019 Accepted: 4 December 2019
References
1. Bray F, Ferlay J, Soerjomataram I, Siegel RL, Torre LA, Jemal A. Global cancer statistics 2018: GLOBOCAN estimates of incidence and mortality worldwide for 36 cancers in 185 countries. Cancer J Clin. 2018;68(6):394–424. 2. Dobruch J, Daneshmand S, Fisch M, Lotan Y, Noon AP, Resnick MJ, Shariat SF,
Zlotta AR, Boorjian SA. Gender and bladder cancer: a collaborative review of etiology, biology, and outcomes. Eur Urol. 2016;69(2):300–10.
3. Hanna KS. A review of immune checkpoint inhibitors for the management of locally advanced or metastatic urothelial carcinoma. Pharmacotherapy. 2017;37(11):1391–405.
4. Grayson M. Bladder cancer. Nature. 2017;551(7679):S33. 5. Gakis G, Stenzl A. Gender‑specific differences in muscle‑invasive
bladder cancer: the concept of sex steroid sensitivity. World J Urol. 2013;31(5):1059–64.
6. Wu X, Ye Y, Kiemeney LA, Sulem P, Rafnar T, Matullo G, Seminara D, Yoshida T, Saeki N, Andrew AS, et al. Genetic variation in the prostate stem cell antigen gene PSCA confers susceptibility to urinary bladder cancer. Nat Genet. 2009;41(9):991–5.
7. Hurst CD, Platt FM, Taylor CF, Knowles MA. Novel tumor subgroups of urothelial carcinoma of the bladder defined by integrated genomic analysis. Clin Cancer Res. 2012;18(21):5865–77.
8. Kim WJ, Kim SK, Jeong P, Yun SJ, Cho IC, Kim IY, Moon SK, Um HD, Choi YH. A four‑gene signature predicts disease progression in muscle invasive bladder cancer. Mol Med. 2011;17(5–6):478–85.
9. Kim YH, Kim WT, Jeong P, Ha YS, Kang HW, Yun SJ, Moon SK, Choi YH, Kim IY, Kim WJ. Novel combination markers for predicting survival in patients with muscle invasive bladder cancer: USP18 and DGCR2. J Korean Med Sci. 2014;29(3):351–6.
10. Wu J, Wan F, Sheng H, Shi G, Shen Y, Lin G, Dai B, Zhu Y, Ye D. NR1H3 expres‑ sion is a prognostic factor of overall survival for patients with muscle‑inva‑ sive bladder cancer. J Cancer. 2017;8(5):852–60.
11. Robertson AG, Kim J, Al‑Ahmadie H, Bellmunt J, Guo G, Cherniack AD, Hinoue T, Laird PW, Hoadley KA, Akbani R, et al. Comprehensive molecular characterization of muscle‑invasive bladder cancer. Cell. 2017;171(3):540– 556.e525.
12. Goldman M, Craft B, Brooks A, Zhu J, Haussler D. The UCSC Xena Platform for cancer genomics data visualization and interpretation. bioRxiv. 2018:326470. 13. El Behi M, Krumeich S, Lodillinsky C, Kamoun A, Tibaldi L, Sugano G, De
Reynies A, Chapeaublanc E, Laplanche A, Lebret T, et al. An essential role for decorin in bladder cancer invasiveness. EMBO Mol Med. 2013;5(12):1835–51. 14. Parkinson H, Kapushesky M, Shojatalab M, Abeygunawardena N, Coulson
R, Farne A, Holloway E, Kolesnykov N, Lilja P, Lukk M, et al. ArrayExpress—a public database of microarray experiments and gene expression profiles. Nucleic Acids Res. 2007;35(Database issue):D747–50.
15. Barrett T, Wilhite SE, Ledoux P, Evangelista C, Kim IF, Tomashevsky M, Marshall KA, Phillippy KH, Sherman PM, Holko M, et al. NCBI GEO: archive for func‑ tional genomics data sets—update. Nucleic Acids Res. 2013;41(Database issue):D991–5.
16. Choi W, Porten S, Kim S, Willis D, Plimack ER, Hoffman‑Censits J, Roth B, Cheng T, Tran M, Lee IL, et al. Identification of distinct basal and luminal subtypes of muscle‑invasive bladder cancer with different sensitivities to frontline chemotherapy. Cancer Cell. 2014;25(2):152–65.
17. Yu G, Wang LG, Han Y, He QY. clusterProfiler: an R package for comparing biological themes among gene clusters. OMICS. 2012;16(5):284–7. 18. Sergushichev AA. An algorithm for fast preranked gene set enrichment
analysis using cumulative statistic calculation. bioRxiv. 2016:060012. 19. Lagani V, Athineou G, Farcomeni A, Tsagris M, Tsamardinos I. Feature selec‑
tion with the r package mxm: discovering statistically‑equivalent feature subsets. arXiv preprint arXiv :16110 3227. 2016.
20. Cotto KC, Wagner AH, Feng YY, Kiwala S, Coffman AC, Spies G, Wollam A, Spies NC, Griffith OL, Griffith M. DGIdb 3.0: a redesign and expansion of the drug–gene interaction database. Nucleic Acids Res. 2018;46(D1):D1068–73. 21. Mayakonda A, Lin DC, Assenov Y, Plass C, Koeffler HP. Maftools: efficient
and comprehensive analysis of somatic variants in cancer. Genome Res. 2018;28(11):1747–56.
22. Shannon P, Markiel A, Ozier O, Baliga NS, Wang JT, Ramage D, Amin N, Schwikowski B, Ideker T. Cytoscape: a software environment for inte‑ grated models of biomolecular interaction networks. Genome Res. 2003;13(11):2498–504.
23. Zhou H, Zhang Y, Wu L, Xie W, Li L, Yuan Y, Chen Y, Lin Y, He X. Elevated transgelin/TNS1 expression is a potential biomarker in human colorectal cancer. Oncotarget. 2018;9(1):1107–13.
24. Zhou HM, Fang YY, Weinberger PM, Ding LL, Cowell JK, Hudson FZ, Ren M, Lee JR, Chen QK, Su H, et al. Transgelin increases metastatic potential of colorectal cancer cells in vivo and alters expression of genes involved in cell motility. BMC Cancer. 2016;16:55.
25. Senbabaoglu Y, Gejman RS, Winer AG, Liu M, Van Allen EM, de Velasco G, Miao D, Ostrovnaya I, Drill E, Luna A, et al. Tumor immune microenviron‑ ment characterization in clear cell renal cell carcinoma identifies prognostic and immunotherapeutically relevant messenger RNA signatures. Genome Biol. 2016;17(1):231.
26. White NM, Mathews M, Yousef GM, Prizada A, Popadiuk C, Dore JJ. KLK6 and KLK13 predict tumor recurrence in epithelial ovarian carcinoma. Br J Cancer. 2009;101(7):1107–13.
27. Schrader CH, Kolb M, Zaoui K, Flechtenmacher C, Grabe N, Weber KJ, Hiels‑ cher T, Plinkert PK, Hess J. Kallikrein‑related peptidase 6 regulates epithelial‑ to‑mesenchymal transition and serves as prognostic biomarker for head and neck squamous cell carcinoma patients. Mol Cancer. 2015;14:107. 28. Chen Y, Zhao J, Li D, Hao J, He P, Wang H, Zhang M. TRIM56 suppresses mul‑
tiple myeloma progression by activating TLR3/TRIF signaling. Yonsei Med J. 2018;59(1):43–50.
29. Zhao L, Zhang P, Su XJ, Zhang B. The ubiquitin ligase TRIM56 inhibits ovarian cancer progression by targeting vimentin. J Cell Physiol. 2018;233(3):2420–5. 30. Pickup MW, Mouw JK, Weaver VM. The extracellular matrix modulates the
hallmarks of cancer. EMBO Rep. 2014;15(12):1243–53.
31. Eke I, Cordes N. Focal adhesion signaling and therapy resistance in cancer. Semin Cancer Biol. 2015;31:65–75.
32. Bansal A, Singh MP, Rai B. Human papillomavirus‑associated cancers: a growing global problem. Int J Appl Basic Med Res. 2016;6(2):84–9. 33. Fresno Vara JA, Casado E, de Castro J, Cejas P, Belda‑Iniesta C, Gonzalez‑
Baron M. PI3K/Akt signalling pathway and cancer. Cancer Treat Rev. 2004;30(2):193–204.
34. Zajac E, Schweighofer B, Kupriyanova TA, Juncker‑Jensen A, Minder P, Quigley JP, Deryugina EI. Angiogenic capacity of M1‑ and M2‑polarized macrophages is determined by the levels of TIMP‑1 complexed with their secreted proMMP‑9. Blood. 2013;122(25):4054–67.
35. Jetten N, Verbruggen S, Gijbels MJ, Post MJ, De Winther MP, Donners MM. Anti‑inflammatory M2, but not pro‑inflammatory M1 macrophages pro‑ mote angiogenesis in vivo. Angiogenesis. 2014;17(1):109–18.
36. Riabov V, Gudima A, Wang N, Mickley A, Orekhov A, Kzhyshkowska J. Role of tumor associated macrophages in tumor angiogenesis and lymphangi‑ ogenesis. Front Physiol. 2014;5:75.
Publisher’s Note