PRIMARY RESEARCH
Sulbactam-enhanced cytotoxicity
of doxorubicin in breast cancer cells
Shao‑hsuan Wen
1†, Shey‑chiang Su
2†, Bo‑huang Liou
3, Cheng‑hao Lin
1and Kuan‑rong Lee
1*Abstract
Background: Multidrug resistance (MDR) is a major obstacle in breast cancer treatment. The predominant mecha‑ nism underlying MDR is an increase in the activity of adenosine triphosphate (ATP)‑dependent drug efflux trans‑ porters. Sulbactam, a β‑lactamase inhibitor, is generally combined with β‑lactam antibiotics for treating bacterial infections. However, sulbactam alone can be used to treat Acinetobacter baumannii infections because it inhibits the expression of ATP‑binding cassette (ABC) transporter proteins. This is the first study to report the effects of sulbactam on mammalian cells.
Methods: We used the breast cancer cell lines as a model system to determine whether sulbactam affects cancer cells. The cell viabilities in the present of doxorubicin with or without sulbactam were measured by MTT assay. Protein identities and the changes in protein expression levels in the cells after sulbactam and doxorubicin treatment were determined using LC–MS/MS. Real‑time reverse transcription polymerase chain reaction (real‑time RT‑PCR) was used to analyze the change in mRNA expression levels of ABC transporters after treatment of doxorubicin with or without sulbactam. The efflux of doxorubicin was measures by the doxorubicin efflux assay.
Results: MTT assay revealed that sulbactam enhanced the cytotoxicity of doxorubicin in breast cancer cells. The results of proteomics showed that ABC transporter proteins and proteins associated with the process of transcription and initiation of translation were reduced. The mRNA expression levels of ABC transporters were also decreased when treated with doxorubicin and sulbactam. The doxorubicin efflux assay showed that sulbactam treatment inhibited doxorubicin efflux.
Conclusions: The combination of sulbactam and doxorubicin enhances the cytotoxicity of doxorubicin in the breast cancer cells by inhibiting the expression of ABC transporter proteins and proteins associated with the process of transcription and initiation of translation, and blocking the efflux of doxorubicin. Co‑treatment of doxorubicin and sul‑ bactam can be used in breast cancer treatment to decrease the prescribed dose of doxorubicin to avoid the adverse effects of doxorubicin.
Keywords: Sulbactam, Breast cancer, ABC transporters, Doxorubicin, Proteomics, Inhibitors
© The Author(s) 2018. This article is distributed under the terms of the Creative Commons Attribution 4.0 International License (http://creat iveco mmons .org/licen ses/by/4.0/), which permits unrestricted use, distribution, and reproduction in any medium, provided you give appropriate credit to the original author(s) and the source, provide a link to the Creative Commons license, and indicate if changes were made. The Creative Commons Public Domain Dedication waiver (http://creat iveco mmons .org/ publi cdoma in/zero/1.0/) applies to the data made available in this article, unless otherwise stated.
Open Access
*Correspondence: krlee@mx.nthu.edu.tw
†Shao‑Hsuan Wen and Shey‑chiang Su contributed equally for this paper 1 Department of Molecular Medicine and Institute of Life Science, National Tsing Hua University, No. 101, Section 2, Kuang‑Fu Road, Hsinchu 30013, Taiwan, ROC
Background
Breast cancer, the most common cancer in women, annu-ally affects 1.8 million women worldwide [1]. Approxi-mately 12% of women in the United States are estimated to receive diagnoses of breast cancer in their lifetime [2]. Breast cancer is classified into three subtypes according to the expression of receptors: hormone (estrogen and progesterone)-receptor-positive breast cancer, human epidermal growth factor receptor 2 (HER2)-positive breast cancer, and triple-negative breast cancer (TNBC; lacking hormone receptors as well as HER2) [3]. Patients with TNBC exhibit a high risk of early tumor recurrence and poor prognosis [4]. Chemotherapy is a principal treatment for breast cancer, but resistance to chemo-therapy—occurring in at least a quarter of all cases—is a major problem in breast cancer management, caus-ing treatment failure in more than 90% of patients with metastatic cancers [5–8]. The mechanisms underly-ing resistance in different breast cancer subtypes are diverse, complex, and unclear. Cancer cells may develop resistance to a specific class of cytotoxic drugs owing to changes in target proteins and in cellular biological activities affecting the efficacy of the drugs. The changes include increased repair of DNA damage and decreased apoptosis, membrane permeability, and drug metabo-lism. Furthermore, the uptake of water-soluble drugs decreases due to a decrease in the expression of trans-porter proteins responsible for drugs to enter the cells and the energy-dependent efflux of hydrophobic drugs increases, for instance, through increased expression of adenosine triphosphate (ATP)-binding cassette (ABC) transporter proteins [9–15].
Doxorubicin, an anthracycline antibiotic, has been con-sidered one of the most effective agents in breast cancer treatment since the 1970s [16]. Doxorubicin mainly inter-calates between DNA bases and subsequently inhibits topoisomerase II activity, thus impairing DNA synthe-sis [17]. Doxorubicin also generates free radicals, which damage DNA and cell membranes [18]. Doxorubicin enters the cells through passive diffusion and accumu-lates intracellularly, particularly in the nuclear compart-ments [19]. However, doxorubicin is nonselective toward cancer cells; thus, it causes toxicity in the heart, brain, liver, and kidneys [19, 20]. The most prominent adverse event is life-threatening cardiotoxicity, which limits the prescribed dose of doxorubicin [20]. Doxorubicin resist-ance is another crucial cause of treatment failure [3]. The reported response rates to doxorubicin as a single agent for breast cancer treatment were 43% and 28% in patients who were exposed to doxorubicin for the first time and those who had been exposed to the drug for more than once, respectively. Thus, nearly 50% of the treated patients developed resistance to doxorubicin, making
resistance the major cause of treatment failure [21]. The predominant mechanism underlying resistance to doxo-rubicin in breast cancer cells is the overexpression of a few ABC transporter proteins that increase doxorubicin efflux, thus decreasing intracellular drug concentrations [3, 9, 22]. Other mechanisms underlying doxorubicin resistance include alterations in cellular signaling path-ways, leading to failure of apoptosis, and changes in gene expression, resulting in a chemoresistant phenotype [3, 19].
Increased expression of ABC transporter proteins has been correlated with poor clinical prognosis in patients with breast cancer of any subtype [23, 24]. The human genome has 49 members of the ABC transporter family, divided into seven subfamilies (ABCA–ABCG) based on their sequence similarities [25]. These membrane pro-teins actively pump various structurally and functionally diverse amphipathic anticancer drugs from inside the tumor cells to the outside, thereby decreasing intracel-lular drug concentrations and causing chemotherapeu-tic drug resistance [9, 10]. The primary members of the ABC transporter family leading to doxorubicin resistance in cancer cells are the ABCBs, the ABCCs [also known as multidrug resistance (MDR)-associated proteins], and ABCG2 (also known as breast cancer resistance protein, mitoxantrone resistance protein, or placenta-specific ABC transporter) [9, 26, 27]. Among the aforementioned ABC transporter proteins, ABCB1 [a P-glycoprotein, (p-gp)], ABCC1, and ABCG2 have been extensively char-acterized in breast cancers [23, 24, 28, 29]. Inhibitors of the ABC transporter proteins activity were used to over-come ABC transporter-mediated MDR for obstructing the expression of the transporter proteins or inhibit-ing their function. For example, a combination of doxo-rubicin and verapamil, a P-gp inhibitor, can reverse the resistance of breast cancer cells to doxorubicin [30]. However, verapamil can potentiate the cardiotoxicity of doxorubicin [31]. Over the past decades, numerous inhibitors of MDR-related ABC transporter proteins have been developed and identified. However, the develop-ment of most inhibitors has been discontinued because of their low binding affinity, toxicity, detrimental phar-macokinetic interactions, and low patient survival advan-tages [9, 32]. Furthermore, the expression patterns of ABC transporter proteins in breast cancer cells are heter-ogeneous; thus, the efficacy of inhibitors specific to some ABC transporter proteins is low [33].
inhibitor combination has been approved by the US Food and Drug Administration for treating dermatologi-cal, gynecologidermatologi-cal, and intraabdominal infections [34]. Although sulbactam has relatively low intrinsic biologi-cal activity, it has inherent activity against some bacterial species, including Neisseria gonorrhoeae, Bacteroides fra-gilis, and Acinetobacter spp. [35, 36]. Preliminary in vitro experiments have demonstrated that sulbactam kills bac-teria by binding to the penicillin-binding proteins (PBPs)
of Acinetobacter spp. and downregulating the
expres-sion of PBP1 and PBP3 [35, 37]. Furthermore, sulbactam reduces the expression of the ABC transporter proteins
in Acinetobacter baumannii [38]. The ABC transporter
superfamilies are highly conserved protein families, and their structural features and mechanisms of action have been conserved from prokaryotes to humans [39, 40]. Thus, we hypothesized that if sulbactam can reduce the expression of ABC transporter proteins in breast cancer cells, then it can reduce the efflux of doxorubicin from breast cancer cells and enhance its efficacy.
Materials and methods Reagents
Doxorubicin hydrochloride was purchased from Sigma-Aldrich (St. Louis, MO, USA). Sulbactum sodium was obtained from TTY Biopharm (Taiwan). Verapamil was obtained from Orion Pharma (Espoo, Finland).
Cell lines and cell culture
The breast carcinoma cell lines MB-231, MDA-MB-435, MDA-MB-453, and MDA-MB-468 were main-tained in Dulbecco’s modified Eagle’s medium (DMEM) (Hyclone, Thermo Fisher Scientific Inc. Waltham, MA, USA) containing 10% fetal bovine serum (FBS; Gibco-BRL, Rockville, MD, USA) and 100 units/mL penicil-lin–streptomycin (Gibco-BRL). The breast carcinoma cell lines MCF-7, BT474, and T-47D were maintained in Roswell Park Memorial Institute (RPMI)-1640 medium (Hyclone) containing 10% FBS and 100 units/mL penicil-lin–streptomycin. The human breast epithelial cell line MCF-10A was maintained in DMEM/F12 medium con-taining 5% horse serum (Invitrogen, Carlsbad, CA, USA), 20 ng/mL epithelial growth factor (Peprotech, Rocky Hill, NJ, USA), 0.5 μg/mL hydrocortisone (Sigma-Aldrich), 10 μg/mL insulin (Sigma-Aldrich), and 100 units/mL penicillin–streptomycin. All cell lines were incubated at 37 °C and 5% CO2.
MTT assay
The MTT (3-(4,5-dimethylthiazol-2-yl)-2,5-diphe-nyltetrazolium bromide) assay was used to access cyto-toxicity. The cells were grown in 96-well plates at a density of 1.5 × 10⁴ cells/well. To determine the toxicities
of sulbactam and doxorubicin, sulbactam and doxo-rubicin were added at various concentrations into the wells. At 48 h after treatment, the medium in the wells was replaced with 100 µL/well of medium containing 0.5 µg/µL MTT and incubated for 4 h. Subsequently, the medium was removed and 100 µL DMSO was added in each well to dissolve the formazan crystals. The absorb-ance of the samples was measured at 550 and 655 nm as the test and reference wavelengths, respectively, by using an iMark microplate reader (Bio-Rad, Hercules, CA, USA). To determine the effects of the combination of sulbactam and doxorubicin, various concentrations of doxorubicin were added to the medium containing 2 mM sulbactam in 96-well plates seeded with the breast can-cer cells. The MTT assay was performed as described above. The cytotoxicity was expressed as relative viabil-ity (percentage of control). The percentage of cell sur-vival in the negative control (without sulbactam and doxorubicin treatment) was considered 100. Relative via-bility = [(experimental absorbance − background absorb-ance)/(absorbance of untreated control − background absorbance)] × 100%. The half maximal inhibitory con-centration (IC50) values of sulbactam, doxorubicin, and the combinations of sulbactam and doxorubicin were calculated using the survival curves by using the Bliss method. The degree of resistance was calculated by determining the ratio of the IC50 of the cells treated with sulbactam–doxorubicin combinations to that of the cells treated with doxorubicin alone.
Real‑time RT‑PCR
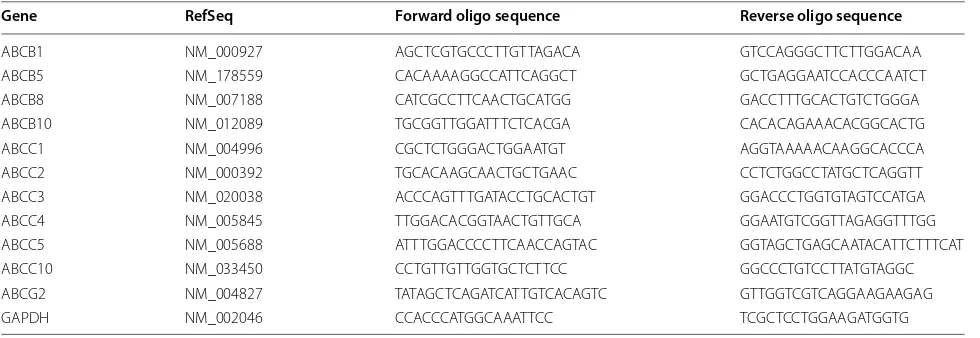
Total RNA was extracted using TriZol (Invitrogen) and reverse transcribed (SuperScript III reverse transcriptase, Invitrogen and ExcelRT Reverse Transcriptase RP1000, SMOBIO, Taiwan). Real-time reverse transcription pol-ymerase chain reaction (Real-time RT-PCR) was per-formed on ABI StepOnePlus™ Real-Time system using the SYBR Green PCR Master Mix (Applied Biosystems). The sequences of the PCR primers were listed in Table 1. The condition for PCR was 95 °C for 10 min, followed by 40 rounds of 95 °C for 15 s and 60 °C for 1 min. The data were analyzed by StepOne Software v2.2.2.
Efflux assay of doxorubicin
were obtained using a LSM 780 confocal microscope (Zeiss) and analyzed using ZEN 2012.
Gel electrophoresis
The equivalence of the human cell lines was analyzed through 12.5% sodium dodecyl sulfate–polyacrylamide gel electrophoresis (SDS-PAGE). The gels were then stained using the VisPRO protein stain kit (Visual Protein Biotech, Taiwan) for 5 min. After staining, the gels were washed with Milli-Q water and stored at 4 °C until in-gel digestion.
In‑gel digestion
The gel lanes corresponding to the samples were cut into five slices, and each slice was subjected to in-gel diges-tion according to the method of Shevchenko [41]. Briefly, the slices were washed thrice with 50 mM ammonium bicarbonate (pH 7.9) and dehydrated using 50 mM AMBC +50% acetonitrile (ACN). Subsequently, the cysteine bonds were reduced after treatment with 10 mM dithiothreitol for 1 h at 56 °C and alkylated using 50 mM 4-vinylpyridine for 45 min at room temperature in the dark. After two subsequent wash–dehydration cycles, the slices were dried for 10 min in a vacuum centrifuge (ThermoFisher, Breda, Netherlands) and incubated over-night with 6.25 ng/μL trypsin in 50 mM AMBC at 25 °C. The resulting peptides were extracted once in 100 μL of 1% formic acid and then two times in 100 μL of 50% ACN in 5% formic acid. The volume was reduced to 50 μL in a vacuum centrifuge before liquid chromatography (LC)– tandem mass spectrometry (MS/MS) analysis.
LC–MS/MS
The peptides were separated using an Ultimate 3000 nano LC system (Dionex LC-Packings, Amsterdam,
Netherlands) equipped with a 20 cm × 75 μm internal diameter (i.d.) fused-silica column custom packed with 3-μm 120-Å ReproSil Pur C18 aqua (Dr. Maisch, GMBH, Ammerbuch-Entringen, Germany). After injection, the peptides were delivered into the column at a flowrate of 30 μL/min and trapped on a 5 mm × 300 μm i.d. Pep-map C18 cartridge (Dionex LC-Packings), which were then eluted by 2% buffer B (80% ACN and 0.05% formic acid in Milli-Q water) and separated at 300 nL/min in a 10%–40% buffer B gradient within 60 min. The eluting peptides were ionized at 1.7 kV in a Nanomate Triversa Chip-based nanospray source by using a Triversa LC coupler (Advion, Ithaca, NJ, USA). Intact peptide mass spectra and fragmentation spectra were acquired on a LT QFT hybrid mass spectrometer (Thermo Fisher, Bremen, Germany). The intact masses were measured at a resolu-tion of 50,000 in the ion cyclotron resonance (ICR) cell by using a target value of 1 × 10⁶ charges. Simultane-ously, following an FT prescan, the five highest peptide signals (charge states 2+ and higher) were submitted for MS/MS in the linear ion trap (3-AMU isolation width, 30 ms activation, 35% normalized activation energy, 0.25 Q-value, and 5000-count threshold. Dynamic exclusion was applied with a repeat count of 1 and an exclusion time of 30 s.
Results
Sulbactam potentiates doxorubicin sensitivity in breast cancer cells
To determine whether sulbactam enhances the cyto-toxicity of doxorubicin, MCF-10A (normal), BT474 (ER/PR+, Her2+), MCF-7 (ER/PR+, Her2−), MDA-MB-231 (triple negative), MDA-MB-361 (ER/PR+, Her2+), MDA-MB-435 (ER/PR−, Her2+), MDA-MB-453 (triple negative), MDA-MB-468 (triple Table 1 List of primers of ABC transporters used for real-time RT-PCR
Gene RefSeq Forward oligo sequence Reverse oligo sequence
ABCB1 NM_000927 AGC TCG TGC CCT TGT TAG ACA GTC CAG GGC TTC TTG GAC AA
ABCB5 NM_178559 CAC AAA AGG CCA TTC AGG CT GCT GAG GAA TCC ACC CAA TCT
ABCB8 NM_007188 CAT CGC CTT CAA CTG CAT GG GAC CTT TGC ACT GTC TGG GA
ABCB10 NM_012089 TGC GGT TGG ATT TCT CAC GA CAC ACA GAA ACA CGG CAC TG
ABCC1 NM_004996 CGC TCT GGG ACT GGA ATG T AGG TAA AAA CAA GGC ACC CA
ABCC2 NM_000392 TGC ACA AGC AAC TGC TGA AC CCT CTG GCC TAT GCT CAG GTT
ABCC3 NM_020038 ACC CAG TTT GAT ACC TGC ACTGT GGA CCC TGG TGT AGT CCA TGA
ABCC4 NM_005845 TTG GAC ACG GTA ACT GTT GCA GGA ATG TCG GTT AGA GGT TTGG
ABCC5 NM_005688 ATT TGG ACC CCT TCA ACC AGTAC GGT AGC TGA GCA ATA CAT TCT TTC AT
ABCC10 NM_033450 CCT GTT GTT GGT GCT CTT CC GGC CCT GTC CTT ATG TAG GC
ABCG2 NM_004827 TAT AGC TCA GAT CAT TGT CAC AGT C GTT GGT CGT CAG GAA GAA GAG
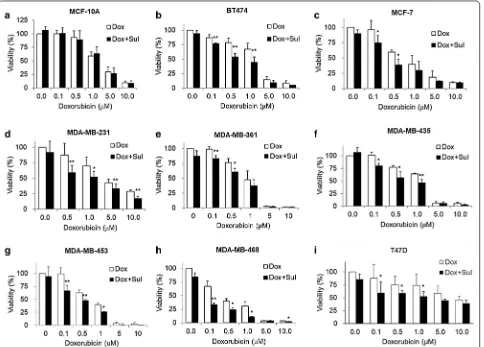
negative), and T47D (ER/PR+, Her2−) cell lines were treated for 48 h with 0, 0.1, 0.5, 1, 5, and 10 μM doxo-rubicin in the presence or absence of 2 mM sulbac-tam for 48 h. Cell viabilities were measured through the MTT assay. Doxorubicin exerted cytotoxic effects in a dose-dependent manner against all the cell lines (Fig. 1). When the cells were treated with doxorubicin alone, the viability of the MDA-MB-468 cells was < 50% at 0.5 µM doxorubicin, the viabilities of the MCF-7, MDA-MB-361, and MDA-MB-453 cells were < 50% at 1 μM doxorubicin, the viabilities of the BT474, MDA-MB-231, and MDA-MB-435 cells were < 50% at 5 μM doxorubicin, and the viability of T47D cells was < 50% until the concentration of doxorubicin reached 10 μM. Among these breast cancer cell lines, the T47D cell line exhibited low sensitivity to doxorubicin, with a
IC50 value of 8.53 µM (Fig. 1i). By contrast, the MDA-MB-453 and MDA-MB-468 cells were more sensitive to doxorubicin than the T47D cells; they had lower IC50 values (0.69 and 0.27 μM, respectively) than the T47D cells and had the lowest viabilities at 5 and 10 μM doxorubicin (Fig. 1g, h). Next, we analyzed whether sulbactam enhanced the cytotoxicity of doxorubicin in the breast cancer cells. When the cells were treated with a combination of sulbactam and doxorubicin, the viabilities of the eight breast cancer cell lines signifi-cantly decreased (Fig. 1b–i). The IC50 values of doxo-rubicin in all the cell lines in the presence and absence of sulbactam are summarized in Table 2. The IC50 val-ues of doxorubicin decreased from 1.14 to 0.54 μM in the BT474 cells, from 0.69 to 0.37 μM in the MCF-7 cells, from 3.16 to 1.25 μM in the MDA-MB-231 cells, from 0.89 to 0.46 μM in the MDA-MB-361 cells, from
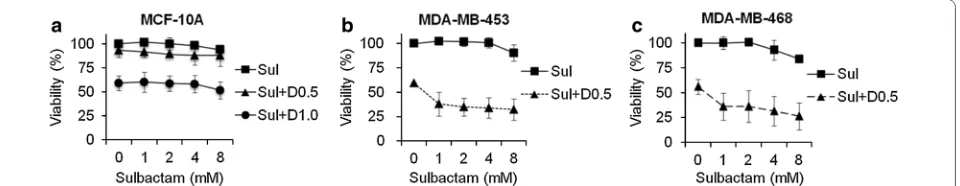
1.22 to 0.51 μM in the MDA-MB-435 cells, from 0.69 to 0.27 μM in the MDA-MB-453 cells, from 0.27 to 0.05 μM in the MDA-MB-468 cells, and from 8.53 to 3.83 μM in the T47D cells in the presence of sulbactam. The IC50 of doxorubicin in breast cancer cells treated with a combination of sulbactam and doxorubicin was less than half of the IC50 of doxorubicin in the breast cancer cells treated with doxorubicin alone excluding the resistance of the MCF-7 and MDA-MB-361 cells, showed 1.85- and 1.96-fold decreases, respectively. By contrast, the MCF-10A cells (breast epithelial cells), did not exhibit evident differences in cell viability in the absence and presence of sulbactam; the IC50 val-ues were 2.51 and 2.50, respectively (Fig. 1a). Among all the breast cancer cell lines, sulbactam considerably increased doxorubicin sensitivity in the MDA-MB-453 and MDA-MB-468 cells, by reducing the IC50 of doxo-rubicin by 2.6- and 5.0-fold, respectively, Subsequently, the cytotoxicity of sulbactam alone was analyzed in the
MCF-10A, MDA-MB-453, and MDA-MB-468 cells. The cells were treated with 0, 1, 2, 4, and 8 mM sulbactam. Sulbactam did not exhibit an evident cytotoxic effect on any of the three cell lines at concentrations of up to 8 mM (Fig. 2). However, when combined with 0.5 μM doxorubicin, sulbactam potentiated the cytotoxicity of doxorubicin without evident dose dependence in the MDA-MB-453 and MDA-MB-468 cells. Thus, sulbac-tam has low cytotoxicity and can enhance the sensitiv-ity of breast cancer cells toward doxorubicin.
Proteomic profiling of total proteins from MDA‑MB‑468 cells treated with and without sulbactam in presence of doxorubicin
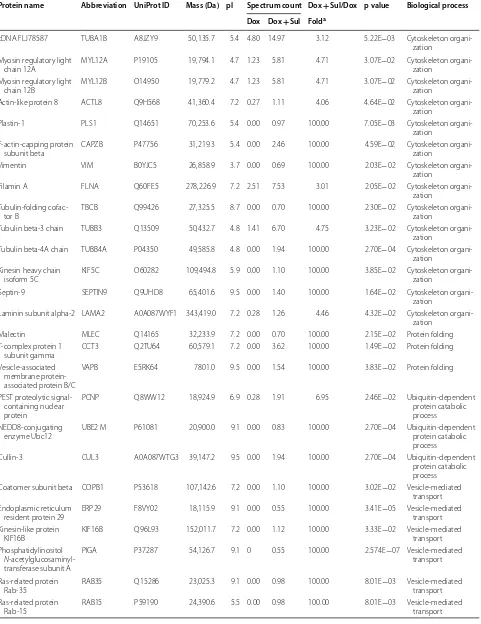
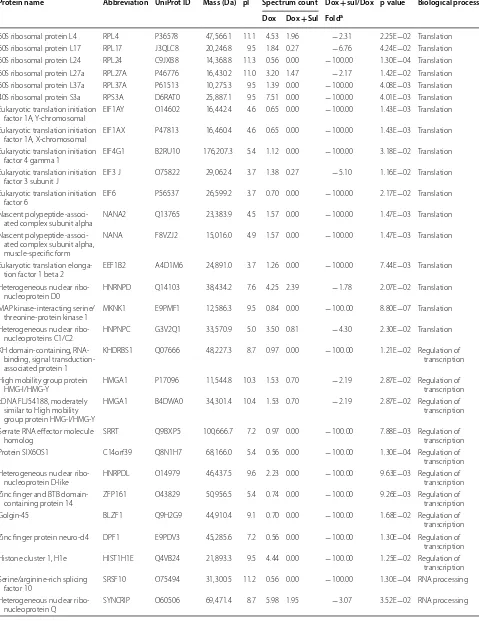
The MDA-MB-468 cells were treated with or without 2 mM sulbactam in the presence of 0.1 μM doxorubicin for 24 h. The total cell lysates were harvested for LC–MS/ MS analysis. In total, 2937 proteins were identified using Sequest, which were validated using Scaffold. The expres-sion of 66 and 70 proteins were significantly upregulated and downregulated, respectively, in the MDA-MB-468 cells treated with a combination of sulbactam and dox-orubicin (based on p value < 0.05 and fold change > 2; Tables 3 and 4). The UniProt database was used to clas-sify the identified proteins according to their biological processes. The upregulated proteins were classified as RNA processing, response to DNA damage, response to stress, cytoskeleton organization, protein folding, ubiq-uitin-dependent protein catabolic process, vesicle-medi-ated transport, carbohydrate metabolism, amino acid metabolism, and positive regulation of apoptosis proteins (Table 3). The downregulated proteins were classified as translation, regulation of transcription, RNA processing, ABC transporter, cytoskeleton organization, protein fold-ing, protein catabolic process, carbohydrate metabolism, mitochondrial metabolic process, negative regulation of apoptosis, and signal transduction proteins (Table 4). The connections among the proteins and GO biological Table 2 IC50 and resistance fold of breast cell lines
in the present of sulbactam and doxorubicin
IC50 was calculated from the results of Fig. 1 using CompuSyn. Resistance fold
was determined by dividing the IC50 values of cells treated with doxorubicin and 2 mM sulbactam (Dox + Sul) by the IC50 of cells treated with doxorubicin (Dox)
Cell line IC50 of Doxorubicin (Dox,
μM) Resistance fold
Dox Dox + Sul Dox + Sul/Dox
MCF10A 2.51 2.50 1.00
BT474 1.14 0.54 0.47
MCF‑7 0.69 0.37 0.54
MDA‑MB‑231 3.16 1.25 0.40
MDA‑MB‑361 0.89 0.46 0.51
MDA‑MB‑435 1.22 0.51 0.42
MDA‑MB‑453 0.69 0.27 0.39
MDA‑MB‑468 0.27 0.05 0.20
T47D 8.53 3.83 0.45
Table 3 List of upregulated proteins in the Dox- and Sul-treated MDA-MB-468 cells
Protein name Abbreviation UniProt ID Mass (Da) pI Spectrum count Dox + Sul/Dox p value Biological process Dox Dox + Sul Folda
Putative pre‑mRNA‑ splicing factor ATP‑dependent RNA helicase DHX15
DHX15 O43143 90,932.8 7.1 0.00 0.82 100.00 2.57E−07 RNA processing
U5 small nuclear ribonucleoprotein 200 kDa helicase
SNRNP200 O75643 244,507.6 5.7 0.00 1.10 100.00 2.41E−02 RNA processing
Spliceosome RNA
helicase DDX39B DDX39B Q5STU3 48,826.1 7.2 0.00 1.85 100.00 2.52E−05 RNA processing
ATP‑dependent RNA
helicase DDX3X DDX3X O00571 73,112.2 6.7 0.00 1.39 100.00 7.43E−04 RNA processing
Nucleolar protein 14 NOP14 P78316 97,668.7 9.1 0.00 0.96 100.00 1.50E−03 RNA processing
Growth arrest and DNA damage‑inducible proteins‑interacting protein 1
GADD45GIP1 Q8TAE8 25,383.9 9.5 0.00 1.09 100.00 2.70E−02 Response to DNA
damage
26S protease regulatory
subunit 6A PSMC3 P17980 49,203.5 5.1 0.27 1.11 4.06 4.64E−02 Response to DNA damage
Proteasome subunit
beta type‑4 PSMB4 P28070 29,204.3 9.1 0.00 0.96 100.00 1.08E−03 Response to DNA damage
Transformation/tran‑ scription domain‑ associated protein
TRRAP Q9Y4A5 437,601.8 9.1 0.00 0.55 100.00 3.412E−05 Response to DNA
damage
Protein DEK DEK P35659 42,674.4 9.3 0.00 1.53 100.00 6.37E−03 Response to DNA
damage Serine/threonine‑pro‑
tein kinase BRSK1 BRSK1 Q8TDC3 85,087.0 9.5 0.00 0.55 100.00 2.57E−07 Response to DNA damage Adenomatous polyposis
coli protein APC E7EMH9 32,790.8 5.4 0.00 0.55 100.00 3.41E−05 Response to DNA damage
Dihydropyrimidinase‑
related protein 2 DPYSL2 Q16555 62,293.6 5.9 0.00 0.98 100.00 1.32E−02 Response to stress
Sodium/potassium‑ transporting ATPase subunit beta‑1
ATP1B1 P05026 35,061.3 9.1 0.00 1.11 100.00 7.81E−03 Response to stress
ERO1‑like protein alpha ERO1L Q96HE7 51,991.8 5.4 0.00 0.56 100.00 1.12E−04 Response to stress STE20‑like serine/threo‑
nine‑protein kinase SLK Q9H2G2 142,695.4 3.7 0.00 0.70 100.00 2.30E−02 Response to stress
Heat shock‑related
70 kDa protein 2 HSPA2 P54652 70,021.0 5.6 0.00 2.69 100.00 9.41E−04 Response to stress
Putative heat shock
70 kDa protein 7 HSPA6 P48741 40,244.4 7.7 0.00 3.08 100.00 5.50E−03 Response to stress
Lipoprotein, Lp(A) LPA Q1HP67 226,516.1 7.2 0.00 0.55 100.00 2.57E−07 Response to stress
Apolipoprotein(a) LPA P08519 501,319.8 7.2 0.00 0.55 100.00 2.57E−07 Response to stress
Peroxiredoxin‑6 PRDX6 P30041 24,903.8 6.0 0.27 1.68 6.15 1.42E−02 Response to stress
Solute carrier family 12
member 2 SLC12A2 P55011 131,447.1 6.0 0.37 2.21 6.03 4.53E−03 Response to stress
Thioredoxin‑related transmembrane protein 1
TMX1 Q9H3N1 31,791.3 3.7 0.00 0.83 100.00 2.70E−04 Response to stress
Transmembrane protein
109 TMEM109 Q9BVC6 26,210.1 11.2 0.00 0.56 100.00 2.70E−04 Response to stress
MICOS complex subunit
MIC60 IMMT Q16891 80,026.5 5.7 1.12 2.74 2.45 1.34E−04 Response to stress
Signal transducer and activator of transcrip‑ tion
Table 3 (continued)
Protein name Abbreviation UniProt ID Mass (Da) pI Spectrum count Dox + Sul/Dox p value Biological process Dox Dox + Sul Folda
cDNA FLJ78587 TUBA1B A8JZY9 50,135.7 5.4 4.80 14.97 3.12 5.22E−03 Cytoskeleton organi‑
zation Myosin regulatory light
chain 12A MYL12A P19105 19,794.1 4.7 1.23 5.81 4.71 3.07E−02 Cytoskeleton organi‑zation
Myosin regulatory light
chain 12B MYL12B O14950 19,779.2 4.7 1.23 5.81 4.71 3.07E−02 Cytoskeleton organi‑zation
Actin‑like protein 8 ACTL8 Q9H568 41,360.4 7.2 0.27 1.11 4.06 4.64E−02 Cytoskeleton organi‑
zation
Plastin‑1 PLS1 Q14651 70,253.6 5.4 0.00 0.97 100.00 7.05E−03 Cytoskeleton organi‑
zation F‑actin‑capping protein
subunit beta CAPZB P47756 31,219.3 5.4 0.00 2.46 100.00 4.59E−02 Cytoskeleton organi‑zation
Vimentin VIM B0YJC5 26,858.9 3.7 0.00 0.69 100.00 2.03E−02 Cytoskeleton organi‑
zation
Filamin A FLNA Q60FE5 278,226.9 7.2 2.51 7.53 3.01 2.05E−02 Cytoskeleton organi‑
zation Tubulin‑folding cofac‑
tor B TBCB Q99426 27,325.5 8.7 0.00 0.70 100.00 2.30E−02 Cytoskeleton organi‑zation
Tubulin beta‑3 chain TUBB3 Q13509 50,432.7 4.8 1.41 6.70 4.75 3.23E−02 Cytoskeleton organi‑
zation
Tubulin beta‑4A chain TUBB4A P04350 49,585.8 4.8 0.00 1.94 100.00 2.70E−04 Cytoskeleton organi‑ zation
Kinesin heavy chain
isoform 5C KIF5C O60282 109,494.8 5.9 0.00 1.10 100.00 3.85E−02 Cytoskeleton organi‑zation
Septin‑9 SEPTIN9 Q9UHD8 65,401.6 9.5 0.00 1.40 100.00 1.64E−02 Cytoskeleton organi‑
zation
Laminin subunit alpha‑2 LAMA2 A0A087WYF1 343,419.0 7.2 0.28 1.26 4.46 4.32E−02 Cytoskeleton organi‑ zation
Malectin MLEC Q14165 32,233.9 7.2 0.00 0.70 100.00 2.15E−02 Protein folding
T‑complex protein 1
subunit gamma CCT3 Q2TU64 60,579.1 7.2 0.00 3.62 100.00 1.49E−02 Protein folding
Vesicle‑associated membrane protein‑ associated protein B/C
VAPB E5RK64 7801.0 9.5 0.00 1.54 100.00 3.83E−02 Protein folding
PEST proteolytic signal‑ containing nuclear protein
PCNP Q8WW12 18,924.9 6.9 0.28 1.91 6.95 2.46E−02 Ubiquitin‑dependent
protein catabolic process NEDD8‑conjugating
enzyme Ubc12 UBE2 M P61081 20,900.0 9.1 0.00 0.83 100.00 2.70E−04 Ubiquitin‑dependent protein catabolic process
Cullin‑3 CUL3 A0A087WTG3 39,147.2 9.5 0.00 1.94 100.00 2.70E−04 Ubiquitin‑dependent
protein catabolic process Coatomer subunit beta COPB1 P53618 107,142.6 7.2 0.00 1.10 100.00 3.02E−02 Vesicle‑mediated
transport Endoplasmic reticulum
resident protein 29 ERP29 F8VY02 18,115.9 9.1 0.00 0.55 100.00 3.41E−05 Vesicle‑mediated transport Kinesin‑like protein
KIF16B KIF16B Q96L93 152,011.7 7.2 0.00 1.12 100.00 3.33E−02 Vesicle‑mediated transport
Phosphatidylinositol N‑acetylglucosaminyl‑ transferase subunit A
PIGA P37287 54,126.7 9.1 0 0.55 100.00 2.574E−07 Vesicle‑mediated
transport
Ras‑related protein
Rab‑35 RAB35 Q15286 23,025.3 9.1 0.00 0.98 100.00 8.01E−03 Vesicle‑mediated transport
Ras‑related protein
processes of the proteins were tested through STRING network analysis. The proteins are represented as nodes. The thickness of the edges indicates the strength of corre-lations between the proteins according to neighborhood, gene fusion, co-occurrence, co-expression, previous experiments, databases, and text-mining information at confidence scores higher than 0.5. As shown in Fig. 3a, 38 of the 60 proteins which were upregulated in the MDA-MB-468 cells treated with a combination of sulbactam and doxorubicin were associated with response to stim-uli. Functional clusters included proteins involved in car-bohydrate metabolism, tubulin-associated cytoskeleton organization, and ubiquitin-dependent protein catabolic process. As shown in Fig. 3b, 31 of 68 proteins which were downregulated in the MDA-MB-468 cells treated with a combination of sulbactam and doxorubicin were associated with gene expression. The functional clusters of these downregulated proteins were associated with actin remodeling, mitochondrial metabolic process, pro-tein catabolic process, transcription and RNA process, and translation.
Sulbactam downregulates mRNA levels of ABC transporters in breast cancer cell lines
Sulbactam significantly reduced ABC transporter pro-tein expression in A. baumannii ATCC 19606. Breast cancer cells can actively remove doxorubicin from inside the cells by using ABC transporters to protect the cells from being killed by doxorubicin. LC–MS/ MS results showed a reduction in the protein levels of ABCA8, ABCB1, and ABCG2; hence, we examined whether sulbactam can inhibit the mRNA expression of ABC transporters in the human breast cancer cells in the presence of doxorubicin. Two breast cancer cell lines, MDA-MB-453 and MDA-MB-468, were treated with 0.1 μM doxorubicin and 2 mM sulbactam for 24 h. The mRNA expression of the ABC transporters in these two cell lines were measured using real-time RT-PCR. In the presence of doxorubicin, sulbactam significantly reduced the mRNA expression of ABCB1, ABCB5, and ABCG2 by approximately 50% in the MDA-MB-453 and MDA-MB-468 cells (Fig. 4). Sulbac-tam also moderately reduced the mRNA expression of Table 3 (continued)
Protein name Abbreviation UniProt ID Mass (Da) pI Spectrum count Dox + Sul/Dox p value Biological process Dox Dox + Sul Folda
Ras‑related protein Rab‑
15 isoform AN2 RAB15 G5ELZ5 13,781.8 9.1 0.00 0.98 100.00 8.01E−03 Vesicle‑mediated transport Ras‑related protein Rab‑
15 isoform AN3 RAB15 G5ELZ6 12,759.7 9.1 0.00 0.98 100.00 8.01E−03 Vesicle‑mediated transport
Enolase ENO1 F5H0C8 34,762.3 3.6 0.00 0.83 100.00 2.70E−04 Carbohydrate metabo‑
lism Phosphoglycerate
mutase PGAM1 A4D2J6 28,219.6 9.5 0.00 1.40 100.00 2.15E−02 Carbohydrate metabo‑lism
ATP‑dependent 6‑phos‑ phofructokinase, platelet type
PFKP B1APP8 22,939.3 9.1 0.00 0.56 100.00 1.12E−04 Carbohydrate metabo‑
lism
Gamma‑enolase ENO2 P09104 47,268.6 4.9 0.00 0.83 100.00 2.70E−04 Carbohydrate metabo‑
lism
Transaldolase TALDO1 F2Z393 35,328.9 9.5 0.00 2.75 100.00 3.85E−02 Carbohydrate metabo‑
lism Ganglioside‑induced
differentiation‑associ‑ ated protein 1
GDAP1 Q8TB36 41,345.8 9.1 0.00 0.56 100.00 2.70E−04 Amino acid metabolic
process
Multifunctional meth‑ yltransferase subunit TRM112‑like protein
TRMT112 F5GX77 11,972.0 7.8 0.00 0.56 100.00 1.12E−04 Amino acid metabolic
process
GCSH protein GCSH Q6IAT2 19,025.8 3.7 0.00 0.96 100.00 8.84E−03 Amino acid metabolic
process Elongation factor
1‑alpha 2 EEF1A2 Q05639 50,470.2 9.1 0.00 3.21 100.00 1.94E−02 Positive regulation of apoptotic process Apoptotic chromatin
condensation inducer in the nucleus
ACIN1 Q9UKV3 151,861.9 5.4 0.00 0.82 100.00 1.30E−02 Positive regulation of
apoptotic process
Sul sulbactam, Dox doxorubicin
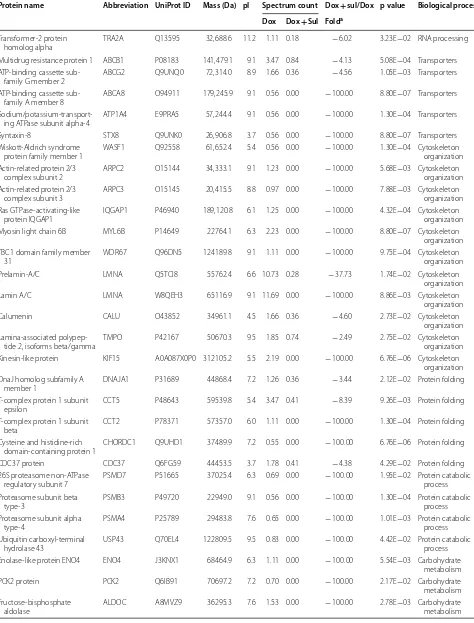
Table 4 List of downregulated proteins in the Dox- and Sul-treated MDA-MB-468 cells
Protein name Abbreviation UniProt ID Mass (Da) pI Spectrum count Dox + sul/Dox p value Biological process Dox Dox + Sul Folda
60S ribosomal protein L4 RPL4 P36578 47,566.1 11.1 4.53 1.96 − 2.31 2.25E−02 Translation 60S ribosomal protein L17 RPL17 J3QLC8 20,246.8 9.5 1.84 0.27 − 6.76 4.24E−02 Translation 60S ribosomal protein L24 RPL24 C9JXB8 14,368.8 11.3 0.56 0.00 − 100.00 1.30E−04 Translation 60S ribosomal protein L27a RPL27A P46776 16,430.2 11.0 3.20 1.47 − 2.17 1.42E−02 Translation 60S ribosomal protein L37a RPL37A P61513 10,275.3 9.5 1.39 0.00 − 100.00 4.08E−03 Translation 40S ribosomal protein S3a RPS3A D6RAT0 25,887.1 9.5 7.51 0.00 − 100.00 4.01E−03 Translation Eukaryotic translation initiation
factor 1A, Y‑chromosomal EIF1AY O14602 16,442.4 4.6 0.65 0.00 − 100.00 1.43E−03 Translation Eukaryotic translation initiation
factor 1A, X‑chromosomal EIF1AX P47813 16,460.4 4.6 0.65 0.00 − 100.00 1.43E−03 Translation Eukaryotic translation initiation
factor 4 gamma 1 EIF4G1 B2RU10 176,207.3 5.4 1.12 0.00 − 100.00 3.18E−02 Translation
Eukaryotic translation initiation
factor 3 subunit J EIF3 J O75822 29,062.4 3.7 1.38 0.27 − 5.10 1.16E−02 Translation
Eukaryotic translation initiation
factor 6 EIF6 P56537 26,599.2 3.7 0.70 0.00 − 100.00 2.17E−02 Translation
Nascent polypeptide‑associ‑
ated complex subunit alpha NANA2 Q13765 23,383.9 4.5 1.57 0.00 − 100.00 1.47E−03 Translation Nascent polypeptide‑associ‑
ated complex subunit alpha, muscle‑specific form
NANA F8VZJ2 15,016.0 4.9 1.57 0.00 − 100.00 1.47E−03 Translation
Eukaryotic translation elonga‑
tion factor 1 beta 2 EEF1B2 A4D1M6 24,891.0 3.7 1.26 0.00 − 100.00 7.44E−03 Translation Heterogeneous nuclear ribo‑
nucleoprotein D0 HNRNPD Q14103 38,434.2 7.6 4.25 2.39 − 1.78 2.07E−02 Translation
MAP kinase‑interacting serine/
threonine‑protein kinase 1 MKNK1 E9PMF1 12,586.3 9.5 0.84 0.00 − 100.00 8.80E−07 Translation Heterogeneous nuclear ribo‑
nucleoproteins C1/C2 HNPNPC G3V2Q1 33,570.9 5.0 3.50 0.81 − 4.30 2.30E−02 Translation
KH domain‑containing, RNA‑ binding, signal transduction‑ associated protein 1
KHDRBS1 Q07666 48,227.3 8.7 0.97 0.00 − 100.00 1.21E−02 Regulation of transcription
High mobility group protein
HMG‑I/HMG‑Y HMGA1 P17096 11,544.8 10.3 1.53 0.70 − 2.19 2.87E−02 Regulation of transcription cDNA FLJ54188, moderately
similar to High mobility group protein HMG‑I/HMG‑Y
HMGA1 B4DWA0 34,301.4 10.4 1.53 0.70 − 2.19 2.87E−02 Regulation of
transcription
Serrate RNA effector molecule
homolog SRRT Q9BXP5 100,666.7 7.2 0.97 0.00 − 100.00 7.88E−03 Regulation of transcription
Protein SIX6OS1 C14orf39 Q8N1H7 68,166.0 5.4 0.56 0.00 − 100.00 1.30E−04 Regulation of
transcription Heterogeneous nuclear ribo‑
nucleoprotein D‑like HNRPDL O14979 46,437.5 9.6 2.23 0.00 − 100.00 9.63E−03 Regulation of transcription Zinc finger and BTB domain‑
containing protein 14 ZFP161 O43829 50,956.5 5.4 0.74 0.00 − 100.00 9.26E−03 Regulation of transcription
Golgin‑45 BLZF1 Q9H2G9 44,910.4 9.1 0.70 0.00 − 100.00 1.68E−02 Regulation of
transcription Zinc finger protein neuro‑d4 DPF1 E9PDV3 45,285.6 7.2 0.56 0.00 − 100.00 1.30E−04 Regulation of
transcription Histone cluster 1, H1e HIST1H1E Q4VB24 21,893.3 9.5 4.44 0.00 − 100.00 1.25E−02 Regulation of
transcription Serine/arginine‑rich splicing
factor 10 SRSF10 O75494 31,300.5 11.2 0.56 0.00 − 100.00 1.30E−04 RNA processing
Heterogeneous nuclear ribo‑
Table 4 (continued)
Protein name Abbreviation UniProt ID Mass (Da) pI Spectrum count Dox + sul/Dox p value Biological process Dox Dox + Sul Folda
Transformer‑2 protein
homolog alpha TRA2A Q13595 32,688.6 11.2 1.11 0.18 − 6.02 3.23E−02 RNA processing
Multidrug resistance protein 1 ABCB1 P08183 141,479.1 9.1 3.47 0.84 − 4.13 5.08E−04 Transporters ATP‑binding cassette sub‑
family G member 2 ABCG2 Q9UNQ0 72,314.0 8.9 1.66 0.36 − 4.56 1.05E−03 Transporters
ATP‑binding cassette sub‑
family A member 8 ABCA8 O94911 179,245.9 9.1 0.56 0.00 − 100.00 8.80E−07 Transporters
Sodium/potassium‑transport‑
ing ATPase subunit alpha‑4 ATP1A4 E9PRA5 57,244.4 9.1 0.56 0.00 − 100.00 1.30E−04 Transporters
Syntaxin‑8 STX8 Q9UNK0 26,906.8 3.7 0.56 0.00 − 100.00 8.80E−07 Transporters
Wiskott‑Aldrich syndrome
protein family member 1 WASF1 Q92558 61,652.4 5.4 0.56 0.00 − 100.00 1.30E−04 Cytoskeleton organization Actin‑related protein 2/3
complex subunit 2 ARPC2 O15144 34,333.1 9.1 1.23 0.00 − 100.00 5.68E−03 Cytoskeleton organization Actin‑related protein 2/3
complex subunit 3 ARPC3 O15145 20,415.5 8.8 0.97 0.00 − 100.00 7.88E−03 Cytoskeleton organization Ras GTPase‑activating‑like
protein IQGAP1 IQGAP1 P46940 189,120.8 6.1 1.25 0.00 − 100.00 4.32E−04 Cytoskeleton organization
Myosin light chain 6B MYL6B P14649 22764.1 6.3 2.23 0.00 − 100.00 8.80E−07 Cytoskeleton
organization TBC1 domain family member
31 WDR67 Q96DN5 124189.8 9.1 1.11 0.00 − 100.00 9.75E−04 Cytoskeleton organization
Prelamin‑A/C LMNA Q5TCI8 55762.4 6.6 10.73 0.28 − 37.73 1.74E−02 Cytoskeleton
organization
Lamin A/C LMNA W8QEH3 65116.9 9.1 11.69 0.00 − 100.00 8.86E−03 Cytoskeleton
organization
Calumenin CALU O43852 34961.1 4.5 1.66 0.36 − 4.60 2.73E−02 Cytoskeleton
organization Lamina‑associated polypep‑
tide 2, isoforms beta/gamma TMPO P42167 50670.3 9.5 1.85 0.74 − 2.49 2.75E−02 Cytoskeleton organization Kinesin‑like protein KIF15 A0A087X0P0 312105.2 5.5 2.19 0.00 − 100.00 6.76E−06 Cytoskeleton
organization DnaJ homolog subfamily A
member 1 DNAJA1 P31689 44868.4 7.2 1.26 0.36 − 3.44 2.12E−02 Protein folding
T‑complex protein 1 subunit
epsilon CCT5 P48643 59539.8 5.4 3.47 0.41 − 8.39 9.26E−03 Protein folding
T‑complex protein 1 subunit
beta CCT2 P78371 57357.0 6.0 1.11 0.00 − 100.00 1.30E−04 Protein folding
Cysteine and histidine‑rich
domain‑containing protein 1 CHORDC1 Q9UHD1 37489.9 7.2 0.55 0.00 − 100.00 6.76E−06 Protein folding
CDC37 protein CDC37 Q6FG59 44453.5 3.7 1.78 0.41 − 4.38 4.29E−02 Protein folding
26S proteasome non‑ATPase
regulatory subunit 7 PSMD7 P51665 37025.4 6.3 0.69 0.00 − 100.00 1.95E−02 Protein catabolic process Proteasome subunit beta
type‑3 PSMB3 P49720 22949.0 9.1 0.56 0.00 − 100.00 1.30E−04 Protein catabolic process
Proteasome subunit alpha
type‑4 PSMA4 P25789 29483.8 7.6 0.65 0.00 − 100.00 1.01E−03 Protein catabolic process
Ubiquitin carboxyl‑terminal
hydrolase 43 USP43 Q70EL4 122809.5 9.5 0.83 0.00 − 100.00 4.42E−02 Protein catabolic process Enolase‑like protein ENO4 ENO4 J3KNX1 68464.9 6.3 1.11 0.00 − 100.00 5.54E−03 Carbohydrate
metabolism
PCK2 protein PCK2 Q6IB91 70697.2 7.2 0.70 0.00 − 100.00 2.17E−02 Carbohydrate
metabolism Fructose‑bisphosphate
ABCB8, ABCB10, ABCC1, ABCC2, ABCC3, ABCC4, and ABCC5 in the MDA-MB-453 cells and those of ABCB8, ABCB10, ABCC2, ABCC5, and ABCC10 in the MDA-MB-468 cells by 20–30%. These results indicate that sulbactam downregulated the mRNA expression of several ABC transporters, particularly ABCB1, ABCB5, and ABCG2. These results also demonstrate that the combination of sulbactam and doxorubicin enhanced the sensitivity of the cells to doxorubicin by downreg-ulating the expressions of ABC transporters related to the efflux of doxorubicin.
Sulbactam prolongs doxorubicin retention in breast cancer cells
To investigate whether the sulbactam-induced reduc-tion in the expression of ABC transporters inhibits the efflux of doxorubicin, the distribution of doxorubicin in breast cancer cells was observed using a confocal microscope. A time-course study was performed in the presence and absence of sulbactam. For comparison, the cells were also pretreated with verapamil, a well-known inhibitor of ABCB1 and ABCG2. The fluores-cent signal corresponding to doxorubicin was primarily observed in nuclei of the cells, and the concentration Table 4 (continued)
Protein name Abbreviation UniProt ID Mass (Da) pI Spectrum count Dox + sul/Dox p value Biological process Dox Dox + Sul Folda
Cytochrome c oxidase subunit
5A, mitochondrial COX5A H3BNX8 17234.9 7.2 1.24 0.00 − 100.00 4.42E−02 Mitochondrial met‑abolic process
Cytochrome b5 type B CYB5B J3KNF8 16694.6 6.3 0.82 0.00 − 100.00 4.69E−02 Mitochondrial met‑
abolic process Cytochrome b‑c1 complex
subunit 1, mitochondrial UQCRC1 P31930 52646.0 7.2 0.56 0.00 − 100.00 1.30E−04 Mitochondrial met‑abolic process MICOS complex subunit MIC19 CHCHD3 Q9NX63 26152.4 9.1 0.70 0.00 − 100.00 1.68E−02 Mitochondrial met‑
abolic process Phosphoenolpyruvate carbox‑
ykinase [GTP], mitochondrial PCK2 Q16822 70730.2 7.2 0.70 0.00 − 100.00 2.17E−02 Mitochondrial met‑abolic process Dihydrolipoyllysine‑residue
succinyltransferase com‑ ponent of 2‑oxoglutarate dehydrogenase complex, mitochondrial
DLST P36957 48755.5 9.5 0.56 0.00 − 100.00 1.30E−04 Mitochondrial met‑
abolic process
Pyruvate dehydrogenase E1 component subunit alpha, somatic form, mitochondrial
PDHA1 P08559 43295.8 9.1 0.56 0.00 − 100.00 1.30E−04 Mitochondrial met‑
abolic process
Apoptosis inhibitor 5 API5 Q9BZZ5 59004.7 9.1 1.21 0.27 − 4.44 4.79E−02 Negative regula‑
tion of apoptotic process Epidermal growth factor
receptor EGFR A9CB80 132022.7 6.2 6.03 0.54 − 11.12 5.65E−03 Signal transduction
A‑kinase anchor protein 9 AKAP9 Q99996 453668.7 3.7 0.84 0.00 − 100.00 7.75E−05 Signal transduction Rho GDP‑dissociation inhibi‑
tor 1 ARHGDIA J3KS60 9944.0 4.2 0.65 0.00 − 100.00 5.33E−03 Signal transduction
Serine/threonine‑protein phosphatase PP1‑alpha catalytic subunit
PPP1CA P62136 37512.2 7.2 1.81 0.00 − 100.00 4.26E−03 Signal transduction
Sul sulbactam, Dox doxorubicin
a The fold is from Dox/Dox + Sul, and “−” means the expression of protein was decrease in Dox + Sul group. If the number of Dox + Sul is 0.00, the fold would be
shown as − 100.00
Fig. 3 Differentially expressed proteins in the MDA‑MB‑468 cells in the presence of sulbactam and doxorubicin. Proteins are represented as nodes. a Upregulated proteins in the Dox/Sul‑treated MDA‑MB‑468 cells. Red nodes indicate proteins that are related to the response to stimulus. b Downregulated proteins in the Dox/Sul‑treated MDA‑MB‑468 cells. Red nodes indicate the proteins that are related to gene expression. Sul sulbactam, Dox doxorubicin
of doxorubicin decreased time-dependently (Fig. 5). Pretreatment with sulbactam increased the doxoru-bicin concentration in the cell nuclei by 15, 45, and 74% in the MDA-MB-453 cells and 17, 26, and 44% in the MDA-MB-468 cells at 8, 12, and 16 h, respectively, compared with that in cells without sulbactam treat-ment. The intensities of doxorubicin were comparable between the sulbactam- and verapamil-treated MDA-MB-453 cells. Doxorubicin concentration was higher in the sulbactam-treated MDA-MB-468 cells than in the verapamil-treated cells. These results indicate that sulbactam inhibited the efflux of doxorubicin, thus prolonging doxorubicin retention in the breast cancer cells. The increase in intracellular doxorubicin levels resulted in an increase in its cytotoxicity in the breast cancer cells.
Discussion
The coadministration of sulbactam and a β-lactam anti-biotic, such as ampicillin, is an effective therapy against bacteria, such as A. baumannii [42]. Sulbactam alone has intrinsic bactericidal effects against multidrug-resistant
A. baumannii because it inhibits the expression of the
ABC transporters as well as that of 30S and 50S riboso-mal subunit proteins [38]. However, the effects of sul-bactam have not been explored in mammalian cells, thus far. Our study results suggest that sulbactam enhanced the cytotoxicity of doxorubicin in many of the tested breast cancer cell lines. Because of the high heterogene-ity of breast cancer, we classified breast cancer cell lines as hormone-receptor-positive cancer, HER2-positive cancer, and TNBC; the cells were then treated with sul-bactam and doxorubicin. All the cell lines responded to doxorubicin and sulbactam—a finding is evidently uncor-related with the characteristic of these cell lines. Thus, a combination of doxorubicin and sulbactam exhibited the most significant cytotoxicity in the MDA-MB-453 and MDA-MB-468 cells. Dose-dependency tests showed that approximately 1–8 mM sulbactam was not cytotoxic to MDA-MB-453, MDA-MB-468, and MCF10A cells, which are typically used as normal breast cell lines; hence, in combination with doxorubicin, sulbactam exerted a syn-ergistic effect on doxorubicin.
The results of LC–MS/MS indicated that most of the upregulated proteins (21/66) associated with stress and DNA damage response, such as heat shock-related 70-kDa protein 2 and adenomatous polyposis coli pro-tein, may respond to the stress caused by sulbactam. When used as a drug, sulbactam also stimulates some metabolic pathways and cytoskeleton organizations, such as carbohydrate metabolism and tubulin-associated cytoskeleton organization. In the presence of doxoru-bicin and sulbactam evidently inhibited the initiation of
RNA processing, transcription, and translation (Fig. 6). Doxorubicin interacts with DNA through intercalation between bases and macromolecular biosynthesis inhibi-tion [19]. This inhibits the progression of topoisomerase II, which relaxes supercoils in DNA during transcription. Through intercalation, doxorubicin can also induce his-tone eviction from transcriptionally active chromatin [43]. Consequently, here, RNA processing and transla-tion were downregulated in the doxorubicin-exposed cells. Sulbactam increased the doxorubicin retention time in the breast cancer cells. Therefore, in the pres-ence of sulbactam, the effects of doxorubicin on tran-scription and translation were enhanced, and the 60S ribosomal proteins, namely L4, L17, L24, L37a, and 40S ribosomal protein 3A, and translation initiation-asso-ciated proteins, namely eIF1A, eIF3, eIF4G1, eIF6, and eEF1B, were downregulated. Hence, the initiation of the translation pathway was inhibited (Fig. 6). The results of LC–MS/MS also indicated that the expression of ABC transporter proteins ABCA8, ABCB1, and ABCG2 were
downregulated, corresponding to our previous finding that sulbactam inhibits ABC transporters of A. bauman-nii and thus kills the bacterium [38]. Most ABC trans-porter families are transmembrane proteins, which are difficult to isolate and identify through total protein LC– MS/MS; hence, we used real-time RT-PCR to determine the effects of sulbactam on the mRNA expression of the ABC transporter proteins. The expression of ABC trans-porter proteins in breast cancer cells is highly heteroge-neous [33, 44]; thus, we selected the ABCB superfamily, the ABCC superfamily, and ABCG2, which are strongly associated with drug resistance in breast cancer cells [23, 26, 32]. Based on the results of other studies and our PCR analysis, we selected ABCB1, ABCB2, ABCB8, ABCB10, ABCC1, ABCC2, ABCC3, ABCC4, ABCC5, ABCC10, and ABCG2, which exhibit high mRNA expression levels for precise real-time RT-PCR analysis.
Although the effects of sulbactam on these ABC transporters were different in MDA-MB-453 and MDA-MB-468 cells, we conclude that in the presence
of sulbactam and doxorubicin, the mRNAs levels of the indicated ABC transporter proteins were evidently downregulated. ABCB1, ABCB5, ABCB8, ABCC1, ABCC2, ABCC3, and ABCG2 [22, 45–48] were consid-ered to confer resistance to doxorubicin on the breast cancer cells. We further found that ABCB10, ABCC4, and ABCC5 in the MDA-MB-453 cells and ABCB10, ABCC5, and ABCC10 in the MDA-MB-468 cells also responded to sulbactam treatment. Studies have reported that ABCB5, ABCB8, ABCB10, ABCC2–5, and ABCC10 are overexpressed in breast cancer cells or are associated with breast cancer progression [44, 49–53]. Our doxoru-bicin efflux assay also indicated that in the presence of sulbactam, the retention time of doxorubicin in MDA-MB-453 and MDA-MB-468 cells was prolonged sig-nificantly. We used the computer simulation and found that sulbactam may compete with ATP for the ATP-docking sites of ABCB1, ABCB10, ABCC1, and MsbA, which exhibit structures similar to the ABCG2 (data not shown). This result provides a possibility how sulbactam
inhibits the expression and function of ABC transporters, and this possibility is worthy to do more experiments to confirm it.
Conclusion
In conclusion, this is the first study that using tam in the mammalian cell. The combination of sulbac-tam and doxorubicin can enhance the cytotoxicity of doxorubicin in the breast cancer cells by inhibiting the transcription and initiation of translation associated proteins and ABC transporters, reducing their expres-sion, and blocking the efflux of doxorubicin, thus trig-gering apoptosis in the breast cancer cells. From these results, sulbactam can be used in breast cancer treat-ment which can decrease the prescribed dose of doxo-rubicin to avoid the adverse effects.
Abbreviations
MDR: multidrug resistance; ATP: adenosine triphosphate; ABC: ATP‑binding cassette; MTT: 3‑(4,5‑dimethylthiazol‑2‑yl)‑2,5‑diphenyltetrazolium bromide; HER2: human epidermal growth factor receptor 2; TNBC: triple‑negative breast cancer; P‑gp: P‑glycoprotein; PBP: penicillin‑binding protein; DMEM: Dul‑ becco’s modified Eagle’s medium; FBS: fetal bovine serum; RPMI: Roswell Park Memorial Institute; IC50: the half maximal inhibitory concentration; RT‑PCR: reverse transcription‑polymerase chain reaction; PCR: polymerase chain reac‑ tion; PBS: phosphate buffered saline; SDS‑PAGE: sodium dodecyl sulfate–poly‑ acrylamide gel electrophoresis; ACN: acetonitrile; LC: liquid chromatography; MS/MS: tandem mass spectrometry; ICR: ion cyclotron resonance; ΔG: Gibbs free energy; ER: estrogen receptor; PR: progesterone receptor; Sul: sulbactam; Dox: doxorubicin; Vera: verapamil.
Authors’ contributions
KRL conceived and supervised the study. SHW and SCS performed most of the experiments, analyzed and interpreted the data, and wrote the first manuscript draft. BHL involved the discussion and supervised the study. CHL conducted some of the experiment and undertook some data interpretation. All authors read and approved the final manuscript.
Author details
1 Department of Molecular Medicine and Institute of Life Science, National Tsing Hua University, No. 101, Section 2, Kuang‑Fu Road, Hsinchu 30013, Taiwan, ROC. 2 Department of Internal Medicine, Puli Christian Hospital, No. 1, Tieshan Road, Puli Township, Nantou 54546, Taiwan, ROC. 3 Department of Internal Medicine, Hsinchu Mackay Memorial Hospital, No.690, Section 2, Guangfu Road, East District, Hsinchu 300, Taiwan, ROC.
Acknowledgements
Not applicable.
Competing interests
The authors declare that they have no competing interests.
Availability of data and materials
All data generated or analysed during this study are included in this published article.
Consent for publication
Not applicable.
Ethics approval and consent to participate
Not applicable.
Funding
This research was supported by a grant from the “Good‑Neighbor Fund” of Mackay Memorial Hospital (Hsin‑chu, Taiwan).
Publisher’s Note
Springer Nature remains neutral with regard to jurisdictional claims in pub‑ lished maps and institutional affiliations.
Received: 19 June 2018 Accepted: 29 August 2018
References
1. Fitzmaurice C, Dicker D, Pain A, Hamavid H, Moradi‑Lakeh M, Mac‑ Intyre MF, et al. The global burden of cancer 2013. JAMA Oncol. 2015;1(4):505–27.
2. Siegel RL, Miller KD, Jemal A. Cancer statistics, 2015. CA Cancer J Clin. 2015;65(1):5–29.
3. Martin HL, Smith L, Tomlinson DC. Multidrug‑resistant breast cancer: cur‑ rent perspectives. Breast Cancer. 2014;6:1.
4. Liu P, Kumar IS, Brown S, Kannappan V, Tawari PE, Tang JZ, et al. Disulfiram targets cancer stem‑like cells and reverses resistance and cross‑resistance in acquired paclitaxel‑resistant triple‑negative breast cancer cells. Br J Cancer. 2013;109(7):1876.
5. Gonzalez‑Angulo AM, Morales‑Vasquez F, Hortobagyi GN. Overview of resistance to systemic therapy in patients with breast cancer. In: Breast cancer chemosensitivity. New York: Springer; 2007. p. 1–22.
6. Musgrove EA, Sutherland RL. Biological determinants of endocrine resist‑ ance in breast cancer. Nat Rev Cancer. 2009;9(9):631.
7. Clarke R, Dickson RB, Brünner N. The process of malignant progression in human breast cancer. Ann Oncol. 1990;1(6):401–7.
8. Coley HM. Mechanisms and consequences of chemotherapy resistance in breast cancer. Eur J Cancer Suppl. 2009;7(1):3–7.
9. Szakács G, Paterson JK, Ludwig JA, Booth‑Genthe C, Gottesman MM. Tar‑ geting multidrug resistance in cancer. Nat Rev Drug Discov. 2006;5(3):219. 10. Higgins CF. Multiple molecular mechanisms for multidrug resistance
transporters. Nature. 2007;446(7137):749.
11. Longley DB, Ferguson PR, Boyer J, Latif T, Lynch M, Maxwell P, et al. Char‑ acterization of a thymidylate synthase (TS)‑inducible cell line: a model system for studying sensitivity to TS‑and non‑TS‑targeted chemothera‑ pies. Clin Cancer Res. 2001;7(11):3533–9.
12. Wang HY, Cheng Z, Malbon CC. Overexpression of mitogen‑activated protein kinase phosphatases MKP1, MKP2 in human breast cancer. Can‑ cer Lett. 2003;191(2):229–37.
13. Longley DB, Johnston PG. Molecular mechanisms of drug resistance. J Pathol. 2005;205(2):275–92.
14. Colmegna B, Morosi L, D’Incalci M. Molecular and pharmacological mech‑ anisms of drug resistance: an evolving paradigm. Handb Exp Pharmacol. 2017. https ://doi.org/10.1007/164_2017_20.
15. Chaney SG, Sancar A. DNA repair: enzymatic mechanisms and relevance to drug response. J Natl Cancer Inst. 1996;88(19):1346–60.
16. Arcamone F, Cassinelli G, Fantini G, Grein A, Orezzi P, Pol C, et al. Adriamy‑ cin, 14‑hydroxydaunomycin, a new antitumor antibiotic from S. peucetius var. caesius. Biotechnol Bioeng. 2000;67(6):704–13.
17. Momparler RL, Karon M, Siegel SE, Avila F. Effect of adriamycin on DNA, RNA, and protein synthesis in cell‑free systems and intact cells. Cancer Res. 1976;36(8):2891–5.
18. Wang S, Kotamraju S, Konorev E, Kalivendi S, Joseph J, Kalyanaraman B. Activation of nuclear factor‑kappaB during doxorubicin‑induced apoptosis in endothelial cells and myocytes is pro‑apoptotic: the role of hydrogen peroxide. Biochem J. 2002;367(Pt 3):729.
19. Tacar O, Sriamornsak P, Dass CR. Doxorubicin: an update on anticancer molecular action, toxicity and novel drug delivery systems. J Pharm Pharmacol. 2013;65(2):157–70.
•fast, convenient online submission
•
thorough peer review by experienced researchers in your field
• rapid publication on acceptance
• support for research data, including large and complex data types
•
gold Open Access which fosters wider collaboration and increased citations maximum visibility for your research: over 100M website views per year
•
At BMC, research is always in progress.
Learn more biomedcentral.com/submissions
Ready to submit your research? Choose BMC and benefit from: 21. Taylor CW, Dalton WS, Parrish PR, Gleason MC, Bellamy WT, Thompson
FH, et al. Different mechanisms of decreased drug accumulation in doxo‑ rubicin and mitoxantrone resistant variants of the MCF7 human breast cancer cell line. Br J Cancer. 1991;63(6):923.
22. Wind NS, Holen I. Multidrug resistance in breast cancer: from in vitro models to clinical studies. Int J Breast Cancer. 2011;2011:967419. 23. Noguchi K, Katayama K, Sugimoto Y. Human ABC transporter ABCG2/
BCRP expression in chemoresistance: basic and clinical perspectives for molecular cancer therapeutics. Pharmacogenomics Pers Med. 2014;7:53. 24. Clarke R, Leonessa F, Trock B. Multidrug resistance/P‑glycoprotein and
breast cancer: review and meta‑analysis. In: Seminars in oncology. Vol. 32. New York: Elsevier; 2005. p. 9–15.
25. Kathawala RJ, Gupta P, Ashby CR Jr, Chen ZS. The modulation of ABC transporter‑mediated multidrug resistance in cancer: a review of the past decade. Drug Resist Updat. 2015;18:1–7.
26. Borst P, Evers R, Kool M, Wijnholds J. A family of drug transport‑ ers: the multidrug resistance‑associated proteins. J Natl Cancer Inst. 2000;92(16):1295–302.
27. Fletcher JI, Haber M, Henderson MJ, Norris MD. ABC transporters in can‑ cer: more than just drug efflux pumps. Nat Rev Cancer. 2010;10(2):147. 28. Bao L, Haque A, Jackson K, Hazari S, Moroz K, Jetly R, et al. Increased
expression of P‑glycoprotein is associated with doxorubicin chem‑ oresistance in the metastatic 4T1 breast cancer model. Am J Pathol. 2011;178(2):838–52.
29. Kunická T, Souček P. Importance of ABCC1 for cancer therapy and prog‑ nosis. Drug Metab Rev. 2014;46(3):325–42.
30. Futscher BW, Foley NE, Gleason‑Guzman MC, Meltzer PS, Sullivan DM, Dalton WS. Verapamil suppresses the emergence of P‑glycoprotein‑ mediated multi‑drug resistance. Int J Cancer. 1996;66(4):520–5. 31. Akimoto H, Bruno NA, Slate DL, Billingham ME, Torti SV, Torti FM.
Effect of verapamil on doxorubicin cardiotoxicity: altered muscle gene expression in cultured neonatal rat cardiomyocytes. Cancer Res. 1993;53(19):4658–64.
32. Li W, Zhang H, Assaraf YG, Zhao K, Xu X, Xie J, et al. Overcoming ABC transporter‑mediated multidrug resistance: molecular mechanisms and novel therapeutic drug strategies. Drug Resist Updat. 2016;27:14–29. 33. Szakács G, Annereau JP, Lababidi S, Shankavaram U, Arciello A, Bussey KJ,
et al. Predicting drug sensitivity and resistance: profiling ABC transporter genes in cancer cells. Cancer Cell. 2004;6(2):129–37.
34. Adnan S, Paterson DL, Lipman J, Roberts JA. Ampicillin/sulbactam: its potential use in treating infections in critically ill patients. Int J Antimicrob Agents. 2013;42(5):384–9.
35. Penwell WF, Shapiro AB, Giacobbe RA, Gu RF, Gao N, Thresher J, et al. Molecular mechanisms of sulbactam antibacterial activity and resistance determinants in Acinetobacter baumannii. Antimicrob Agents Chemother. 2015;59(3):1680–9.
36. Noguchi JK, Gill MA. Sulbactam: a beta‑lactamase inhibitor. Clin Pharm. 1988;7(1):37–51.
37. Papp‑Wallace KM, Senkfor B, Gatta J, Chai W, Taracila MA, Shanmu‑ gasundaram V, et al. Early insights into the interactions of different β‑lactam antibiotics and β‑lactamase inhibitors against soluble forms of Acinetobacter baumannii PBP1a and Acinetobacter sp. PBP3. Antimicrob Agents Chemother. 2012;56(11):5687–92.
38. Lin CH, Su SC, Ho KH, Hsu YW, Lee KR. Bactericidal effect of sulbactam against Acinetobacter baumannii ATCC 19606 studied by 2D‑DIGE and mass spectrometry. Int J Antimicrob Agents. 2014;44(1):38–46. 39. van Veen HW, Callaghan R, Soceneantu L, Sardini A, Konings WN, Higgins
CF. A bacterial antibiotic‑resistance gene that complements the human multidrug‑resistance P‑glycoprotein gene. Nature. 2014;391(6664):291.
40. Ter Beek J, Guskov A, Slotboom DJ. Structural diversity of ABC transport‑ ers. J Gen Physiol. 2014;143(4):419–35.
41. Shevchenko A, Tomas H, Havli J, Olsen JV, Mann M. In‑gel digestion for mass spectrometric characterization of proteins and proteomes. Nat Protoc. 2006;1(6):2856.
42. Levin AS. Multiresistant Acinetobacter infections: a role for sulbactam combinations in overcoming an emerging worldwide problem. Clin Microbiol Infect. 2002;8(3):144–53.
43. Pang B, Qiao X, Janssen L, Velds A, Groothuis T, Kerkhoven R, et al. Drug‑induced histone eviction from open chromatin contributes to the chemotherapeutic effects of doxorubicin. Nat Commun. 2013;4:1908. 44. Gillet JP, Schneider J, Bertholet V, De Longueville FR, Remacle J, Efferth
T. Microarray expression profiling of ABC transporters in human breast cancer. Cancer Genomics Proteomics. 2006;3(2):97–106.
45. Elliott AM, Al‑Hajj MA. ABCB8 mediates doxorubicin resistance in mela‑ noma cells by protecting the mitochondrial genome. Mol Cancer Res. 2009;7(1):79–87.
46. Frank NY, Margaryan A, Huang Y, Schatton T, Waaga‑Gasser AM, Gasser M, et al. ABCB5‑mediated doxorubicin transport and chemoresistance in human malignant melanoma. Cancer Res. 2005;65(10):4320–33. 47. Cui Y, König J, Buchholz U, Spring H, Leier I, Keppler D. Drug resistance
and ATP‑dependent conjugate transport mediated by the apical mul‑ tidrug resistance protein, MRP2, permanently expressed in human and canine cells. Mol Pharmacol. 1999;55(5):929–37.
48. Young LC, Campling BG, Cole SP, Deeley RG, Gerlach JH. Multidrug resistance proteins MRP3, MRP1, and MRP2 in lung cancer: correlation of protein levels with drug response and messenger RNA levels. Clin Cancer Res. 2001;7(6):1798–804.
49. Yang JY, Ha SA, Yang YS, Kim JW. p‑Glycoprotein ABCB5 and YB‑1 expression plays a role in increased heterogeneity of breast cancer cells: correlations with cell fusion and doxorubicin resistance. BMC Cancer. 2010;10(1):388.
50. Balaji SA, Udupa N, Chamallamudi MR, Gupta V, Rangarajan A. Role of the drug transporter ABCC3 in breast cancer chemoresistance. PLoS ONE. 2016;11(5):e0155013.
51. Ge G, Zhou C, Ren Y, Tang X, Wang K, Zhang W, et al. Enhanced SLC34A2 in breast cancer stem cell‑like cells induces chemotherapeutic resist‑ ance to doxorubicin via SLC34A2‑Bmi1‑ABCC5 signaling. Tumor Biol. 2016;37(4):5049–62.
52. Liu Y, Peng H, Zhang JT. Expression profiling of ABC transporters in a drug‑resistant breast cancer cell line using AmpArray. Mol Pharmacol. 2005;68(2):430–8.