Method development and validation for the simultaneous estimation of saxagliptin and metformin in tablet dosage form by RP-HPLC method
7
0
0
Full text
(2) P.Srisowmya,. et al / Int. J. of Pharmacy and Analytical Research Vol-3(4) 2014 [363-369]. hemoglobin (HbA1c) level near 6% to 7% without predisposing patients to hypoglycemia. Currently available anti-diabetic agents work by different mechanisms to lower blood glucose levels. The usual adult dose is 2.5 to 5 mg once daily regardless of meals. A daily dose of 2.5 mg is recommended for patients with moderate to severe renal impairment or those who are taking potent CYP 3A4 inhibitors. In randomized clinical trials, Saxagliptin alone lowered HbA1c levels by about 0.5%; with better efficacy seen when combined with other agents.. MATERIALS AND METHODS Apparatus and chemicals Waters HPLC system connected with UV dual λ absorbance Detector 2487 and Empower-2 Software was used. MET and SGL pure drugs were kindly supplied as a gift sample by Natco Pharma Ltd., Hyderabad, Andhra Pradesh, India. Methanol was of HPLC grade, collected from E.Merck, Mumbai. Potassium dihydrogenortho phosphate, di-sodium hydrogen orthophosphate were analytical reagent grade supplied by Fischer Scientific Chemicals, India. Water HPLC grade was obtained from a Finar Limited, Ahmedabad, India.. Accurately weighed 5mg of saxagliptin , dissolve in 5ml of mobile phase as diluent that gave1000µg/ml, from hat take 1ml and diluted to 10ml with mobile phase as diluent it gives 100µg/ml. from that take 1ml and diluted to 10ml,it gave 10µg/ml, from this take the serial dilutions 1-6ml,that take the concentrations 1,2,3,4,5 and 6 µg/ml.. Preparation of test solution 20 tablets of combined formulation of Metformin and Saxagliptin were weighed, average weight was calculated and triturated in a mortar with pestle from that, powder equivalent to 500 mg of Metformin and 5 mg of Saxagliptin was weighed and dissolved in diluent and test concentration was prepared by further dilution with same.. Chromatographic Conditions The mobile phase, a mixture of 0.1M phosphste buffer pH 5.3 and acetonitrile (60:40 v/v) pumped at a flow rate of 0.7 ml/min through the column (Phenomex C18, 5μ, 4.6 × 250 mm). The mobile phase was degassed prior to use under vacuum by filtration through a 0.22 μ membrane filter. Both drugs showed good absorbance at 242 nm, which was selected as wavelength for further analysis.. Commercial Formulation MET and SGL tablets available in the market in composition of Metformin HCL (500 mg),Saxagliptin (5 mg). The tablets were checked and stored properly.. Reagents and Solutions Preparation of mobile phase Preparation of 0.1M Phosphate buffer (pH 5.3) Accurately weighed portion of 2.722g of potassium dihydrogen orthophosphate was dissolved in 200 ml of HPLCwater. Mobile phase consisting of phosphate buffer(pH5.3),acetonitrile in the ratio of 60:40 respectively. The mobile phase was filtered through 0.22µ membrane filter and sonicated for 15 min. Mobile phase is used as diluent.. Preparation of standard solution Accurately weighed 100mg of Metformin and it is dissolved in 100ml of mobile phase as diluent ,that gave 1000µg/ml. from that gave at take serial dilutions 1-6,that gave concentrations 100,200,300,400,500 and 600µg/ml.. DEVELOPMENT AND VALIDATION OF HPLC METHOD Present study was conducted to obtain a new, affordable, cost-effective and convenient method for HPLC determination of MET and SGL in tablet dosage form. The experiment was carried out according to the official specifications of ICH. The method was validated for the parameters like system suitability, specificity, linearity, precision, accuracy, LOD, LOQ and robustness.. System Suitability System suitability study of the method was carried out by six replicate analysis of solution containing 100% test concentration of MET and SGL. Various chromatographic parameters such as retention time, peak area, tailing factor, theoretical plates of the column and resolution between the peaks were determined and the method was evaluated by analyzing these parameters.. www.ijpar.com. ~ 364~.
(3) P.Srisowmya,. et al / Int. J. of Pharmacy and Analytical Research Vol-3(4) 2014 [363-369] LOQ = 10 × SD/SLOPE. Specificity Specificity test determines the effect of excipients on the assay result. To determine the specificity of the method, standard solution of MET and SGL were injected first. Then commercial product, blank and excipients solution were run in the instrument one after another. No any interference at retention time of drugs was observed.. Linearity Linearity of the method was determined by constructing calibration curves. Standard solutions of MET and SGL of different concentrations level (100,200,300,400,500,600 and 1,2,3,4,5,6 μg/ml) were used for this purpose. Each measurement was carried out in 6 replicates and the peak areas of the chromatograms were plotted against the concentrations to obtain the calibration curves and correlation coefficients.. Accuracy Accuracy is the percentage of analyte recovered by assay from a known added amount. To check the degree of accuracy of the method, recovery studies were performed in six times by standard addition method at 50%, 100% and 150%. Known amounts of standard MET and SGL were added to preanalyzed samples and were subjected to the proposed HPLC method.. Precision Precision was evaluated by carrying out six independent sample preparation of a single lot of formulation. The sample solution was prepared in the same manner as described in sample preparation. Percentage relative standard deviation (% RSD) was found to be less than 2% for within a day and day to day variations, which proves that method is precise.. Limit of detection (LOD) and Limit of quantification (LOQ) LOD and LOQ were calculated for the sensitivity of the method. They were quantified based on the signal to noise ratio. LOD is lowest detectable concentration of the analyte by the method while LOQ is the minimum quantifiable concentration. LOD and LOQ were calculated according to ICH guidelines. LOD = 3.3 × SD/SLOPE. Robustness of Method The robustness study was performed to evaluate the influence of small but deliberate variation in the chromatographic condition. The robustness was checked by changing parameters like flow rate of mobile phase and detection wavelength Change in the detection wavelength by ± 2nm (238nm and 242nm) Change in flow rate by ± 0.2 ml/min (0.6 ml/min and 0.9 ml/min) After each change, sample solution was injected and % assay with system suitability parameters were checked.. RESULTS AND DISCUSSION The developed method has been validated as per ICH guidelines. Every 20 μL of the working standard solution of SGL in the concentration range of 1 to 6 μg/mL, and that for MET in the concentration range of 100 to 600 μg/mL were injected into the chromatographic system. The chromatograms were recorded and the peak area was determined for each concentration of the drug solution. Calibration curves of SGL and MET were obtained by plotting the peak area versus concentrations of SGL and MET. System suitability and precision study are shown in Table No.1. Precision study of the developed method is in Table No.2. Standard chromatogram and marketed formulation chromatogram are in Figure No.1 and 2. Accuracy of the method was tested by carrying out recovery studies at different spiked levels. The estimation was carried out as described earlier. At each level, three determinations were performed and results obtained. The amounts recovered and the values of percent recovery were calculated, Limit of detection (LOD) and limit of quantification (LOQ) were calculated. Results of accuracy study are presented in Table No.3. The measured value was obtained by recovery test. Spiked amount of both the drugs were compared against the recovery amount. All the results indicate that the method is highly accurate. The results of robustness of the present method showed that small changes were made in the flow rate did not produce significant changes in analytical results, we can say that the method is robust. Results of robustness are presented in Table No. 4.. www.ijpar.com. ~ 365~.
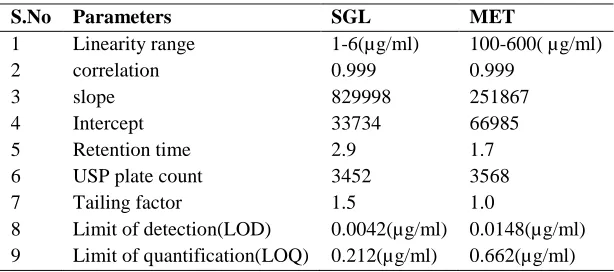
(4) P.Srisowmya,. et al / Int. J. of Pharmacy and Analytical Research Vol-3(4) 2014 [363-369]. Table No.1: Result of system suitability tests of MET and SGL S.No 1 2 3 4 5 6 7 8 9. Parameters Linearity range correlation slope Intercept Retention time USP plate count Tailing factor Limit of detection(LOD) Limit of quantification(LOQ). SGL 1-6(µg/ml) 0.999 829998 33734 2.9 3452 1.5 0.0042(µg/ml) 0.212(µg/ml). MET 100-600( µg/ml) 0.999 251867 66985 1.7 3568 1.0 0.0148(µg/ml) 0.662(µg/ml). Intermediate Precision Table:No.2: Intermediate Precision Repeatability (% RSD) (n=6) SGL MET. Intermediate precision (% RSD) (n=6) Day 1 Day 2 Analyst 1 Analyst 2 Analyst 1 Analyst 2 0.8656 0.7324 0.6322 0.8213 1.1563 1.7669 0.1935 0.8241. Accuracy Table:No.3: Recovery Studies Sample. SGL. MET. Spiked Amount (mg) 3 4 5 200 300 400. Recovered Amount (mg) 3.02 4.03 5.01 200.76 300.03 400.01. % Recovered 99.54 100.03 100.006 100.7 100.27 101.07. % Average Recovery 100.6. 99.9. Table:No.4:Robustness Drug SGL. Parameters count Flow rate (ml/min). MET. Flow rate (ml/min). Changes 0.6 0.9 0.6 0.9. RT(min) 3.0 2.8 1.6 1.9. www.ijpar.com. ~ 366~. USP Tailing 1.5 1.0 1.0 1.5. USP Plate 7241 5835 5167 7334.
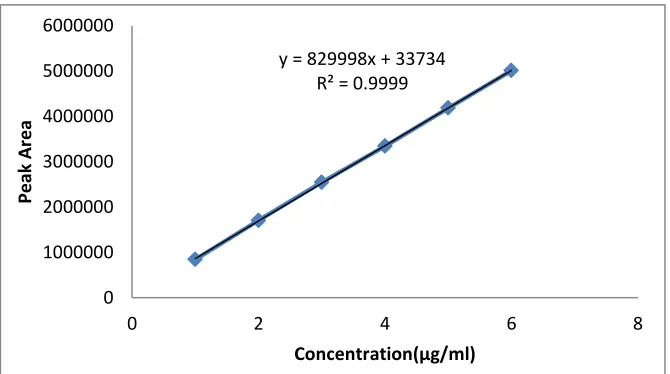
(5) P.Srisowmya,. et al / Int. J. of Pharmacy and Analytical Research Vol-3(4) 2014 [363-369]. Figure No.1: Typical Chromatogram of standard MET and SGL. Figure No.2: Typical chromatogram of MET and SGL in marketed formulation 6000000 y = 829998x + 33734 R² = 0.9999. Peak Area. 5000000 4000000 3000000 2000000 1000000 0 0. 2. 4 Concentration(µg/ml). Figure No.4: Linearity of SGL. www.ijpar.com. ~ 367~. 6. 8.
(6) P.Srisowmya,. et al / Int. J. of Pharmacy and Analytical Research Vol-3(4) 2014 [363-369] 16000000 14000000. y = 25187x + 66985 R² = 0.9999. Peak Area. 12000000 10000000 8000000 6000000 4000000 2000000 0. 0. 100. 200. 300. 400. 500. 600. 700. Concentration(µg/ml) Figure No.3: Linearity of MET. CONCLUSION The new RP-HPLC method developed and validated for simultaneous estimation of MET and SGL in pure and in pharmaceutical dosage form and assured the satisfactory precision and accuracy and also determining lower concentration of each drug in its solid combined dosage form. The method was found to be simple, accurate, economical and rapid and they can be applied for routine analysis in laboratories and is suitable for the quality control of the raw materials, formulations, dissolution studies and can be employed for bioequivalence studies for the same formulation. The developed method was validated in terms of. accuracy, repeatability, and precision. The assay experiment showed that the contents of SGL and MET estimated in the tablet dosage form were free from the interference of excipients. This demonstrated that the developed HPLC method was simple, linear, precise, and accurate, and could be conveniently adopted for the routine quality control analysis of SGL and MET simultaneously, from its pharmaceutical formulations and pure drug.. ACKNOWLEDGEMENT The authors are thankful to Natco Pharma Ltd., Hyderabad for providing gift samples and SIMS college of Pharmacy for providing necessary facilities.. REFFERENCE [1] Sharma BK. Instrumental Methods of Chemical Analysis. 7th ed. Meerut: Goel Publishing Housing; 2000. p. 1-2. [2] Sethi PD. Quantitative Analysis of Drugs in Pharmaceutical Formulations. 3rd ed. New Delhi: CBS Publisher: 1986. p. 46-54. [3] Michael E, Schartz IS, Krull. Analytical method development and Validation. 2004: p. 25-46. http://en.wikipedia.org/wiki/Chromatography [4] Pascal Bailon, George KE, Wen JF, Wolfgang Berthold. An Overview of Affinity Chromatography, Humana Press, 2000. ISBN 978-0-89603-694-9, ISBN 978-1-60327-261-2 http://www.chromatography-online.org/ quant/Historical%20Introduction/The%20Importance%20of%20Chromatography%20as%20an%20Analytical%2 0%20Technique.html. [5] Yuri Kazakevich, Rosario Lobrutto. HPLC for Pharmaceutical Scientist: Wiley-interscienceJohn Wiley & Sons Inc.; 2007. p. 10-14. [6] Lough WJ, Wainer IW. High Performance Liquid Chromatography: fundamental principles &practice.Glasgow (UK): Blackie Academic & Professional; 1995. p. 2-28. [7] Sastry CSP, Prasad TNV, Rao EV. Recent applications of High Performance Liquid Chromatography in Pharmaceutical Analysis (Review). Indian J Pharm Education 1987; 21:37.. www.ijpar.com. ~ 368~.
(7) P.Srisowmya,. et al / Int. J. of Pharmacy and Analytical Research Vol-3(4) 2014 [363-369]. [8] ICH: Text on validation of analytical procedure Q2A; 1994. [9] ICH: Validation of analytical procedure: Methodology Q2B; 1996. [10] ICH: Validation of analytical procedures: text and methodology Q2 (R1); 2005.. www.ijpar.com. ~ 369~.
(8)
Figure
Related documents
When growth was visible on SC-Met-His and SC-Met-Cys-His plates in the high- throughput C2H screen, indicating potential PPI, the corresponding bait- and prey- harboring strains
Higher concentrations of both caspase-cleaved CK18 and total CK18 were measured in bile samples compared to serum samples, suggesting that cell death is prominent in the
Conclusions: The findings from this study indicate the importance of “ pushing ” active classroom teachers from the design to the mapping arena by instituting curriculum
Results: There were not significative differences in clinical characteristics between patients that used enoxaparin or fondaparinux as thromboprpophylaxis for SARS
The study ’ s primary objective was to demonstrate the ability of the harmonic scalpel (H) to reduce intra- operative conversion rates compared to the conventional monopolar
The purpose of this study is to characterize the very eld- erly population, who received emergency general surgery, and examine their surgical outcomes including identifica- tion
attenuated virus, as it is clear from the tissue culture studies that this virus replicates well; direct comparisons in which the two isolates are used to infect a compatible cell
In this paper we describe how a participatory, multi- method, continuous informed consent process developed by researchers, study participants and community stake- holders during
