M at h e M at i ca l M o d e l i n g
o f b i o c h e M i ca l p ro c e s s
M at h e M at i ca l M o d e l i n g
o f b i o c h e M i ca l p ro c e s s
UDC 577.3
a MatheMatical Model of the Metabolic
process of atherosclerosis
V. I. GrytSay
Bogolyubov Institute for theoretical Physics, National academy of Sciences of Ukraine, Kyiv; e-mail: vgrytsay@bitp.kiev.ua
a mathematical model of the metabolic process of atherosclerosis is constructed. the functioning of the polyenzymatic prostacyclin-thromboxane system of blood and the influence of a level of “bad cholesterol”, namely low density lipoproteins (LDL), on it are studied. With the help of the numerical experiment, we ana-lyze the influence of the concentration of molecules of fat on hemostasis of blood in blood vessels. The kinetic curves for components of the system, phase-periodic bifurcation diagrams, attractors for various modes, and Poincaré cross-section and image of a strange attractor are constructed. the complete spectra of Lyapunov’s exponents, divergencies, KS-entropies, predictability horizons, and Lyapunov dimensions of the fractality of strange attractors are calculated. Conclusions about the structural-functional connections, which determine the dependence of hemostasis of a circulatory system on the level of cholesterol in blood are drawn.
K e y w o r d s: self-organization, hemostasis, chaos, circulatory system, prostacyclin-thromboxane system, Lyapunov’s exponents, KS-entropy.
I
n the present work we continue the study of a prostacyclin-thromboxane system of blood with the help of a mathe matical modeling. We will investigate how low density lipoproteins (LDL) in-fluence the dynamics of this metabolic process. In the construction of equations (Eqs.) of our model and determination of its parameters, we used the re-sults obtained by Prof. S. D. Varfolomeev and Prof. A. T. Mevkh. Their book and the fruitful collabo-ration with them [1-3] allow Prof. V.P. Gachok and the author to obtain calculation results similar to the experimental ones in the case where the system is in a stable state of hemostasis [4-9], which state charac-terizes a healthy blood vessel. It is the ideal state, which is attained by synchronization of the systems of thrombosis and antithrombosis. The dynamical stationary equilibrium arises. The desynchroniza-tion of these systems results in the appearance of autooscillatory modes in the metabolic process of a prostacyclin-thromboxane system. If the stationary kinetics is broken so that the level of thromboxane increases, then the coagulability of blood grows as well, and the appearance of thrombosis becomespossible in the circulatory system. On the contrary, if the level of prostacyclin increases, then the coagu-lability of blood decreases, and hemophilia occurs. If the autooscillatory mode arises, then the appearance of a thrombus as a result of increased coagulabili-ty on some time interval and its abruption under a decrease of the coagulability in the following time interval are possible. The actions of external and in-ternal factors induce various modes in the system.
The metabolic process of coagulability of blood is considered by the author of the article as an open nonlinear system. The study was conducted using methods of nonlinear dynamics.
The kinetic model [4-9] allowed us to trace the effect of various levels of activities of phospholipases and concentrations of prostacyclin and thromboxane on properties of a biosystem, to determine the role of the arachidonic acid exchange between thrombo-cytes and endothelium, to analyze the influence of parallel processes running with the participation of arachidonic acid on kinetics of changes and on sta-tionary levels of prostanoids, and to find the struc-tural-functional connections of self-organization in the biosystem.
We will modify the given model by adding four nonlinear Eqs. Other parameters remain unmodi-fied. Within the model, we will study the influence of concentration of “bad cholesterol” (LDL) on the metabolism of a hemostasis of blood vessels. The principal reason for its elevated level is high dietary fat content. The excessive content of fat in organism causes formation of atheromatous plaques. They are aggregates of LDL on internal walls of blood ves-sels, causing stenosis. The atheromatous plaques grow over time. As a result, blood circulation slows down that creates a deficit of nutrients in tissues. In this case, the arteries become denser and gradual-ly lose their elasticity; i.e., atherosclerosis develops [10-17].
Atherosclerosis does not appear instantly, but arises gradually during the whole life. The excess of LDL is accumulated on arterial walls and is chemi-cally modified. The modified LDL then stimulate adhesion of the endothelial cells to monocytes and Т-cells. In addition, the endothelial cells secrete chemokines, which entrap Т-cells in a trap of intima. Macrophages and Т-cells produce numerous media-tors of inflammation such as cytokines and cell divi-sion signaling molecules. In addition, macrophages express waste receptors, which help them to absorb modified LDL. Macrophages absorb LDL by filling themselves by drops of fat. These foamy macropha-ges loaded with fat and Т-cells form fat strips, which are earlier manifestations of atherosclerotic plaques. Molecules participating in inflammation facilitate further growth of a plaque and formation of a fibrous capsule above the lipid core. Thus, the dynamics of the metabolic process of accumulation of cholesterol in the intima of an arterial wall has the autocatalytic character. The unusual accumulation of cholesterol occurs. Its amount depends on aggregated throm-bocytes and oxidized lipoproids, which depend, in turn, on the concentration of cholesterol in blood. This can explain the sharp growth of cholesterol plaques and the unexpected appearance of athero-sclerosis in a person with medium level of choles-terol in blood [10].
During person’s life, the metabolic process of the circulatory system permanently adapts to the conditions of nutrition. Respectively, the amount of cholesterol in the intima of blood vessels varies. At a high level of cholesterol, atherosclerotic damage to walls of blood vessels occurs. Inflammation induces propagation of atherosclerosis under imbalanced
nutrition, unhealthy life style, and associated path-ological conditions. Inflammation of blood vessels and thrombosis result from the permanent shift of hemostasis to a critical state for an organism. Studies of the oscillatory dynamics of the given metabolic process will allow one to investigate the process of self-organization of the metabolic process of hemo-stasis of a circulatory system under changes in blood cholesterol level. The presented model can serve as an example of the self-organization in the open dis-sipative system of human organism. This will allow one to study the regularity of metabolic processes in human organism from a single physical viewpoint of synergetics.
the mathematical model and methods of its study
The general scheme of the hemostasis with re-gard for the entry of “bad cholesterol” into blood is presented in Fig. 1 [6, 10]. According to this scheme, we construct the mathematical model of the given metabolic process (1)-(12) [6, 10]:
, (1)
, (2)
, (3)
, (5)
, (6)
, (7)
. (8)
Fig. 1. General kinetic scheme of hemostasis , (9)
, (10)
, (11)
. (12)
The model includes the following collection of parameters [6]: k = 4; k1 = 3; k2 = 1; k3 = 5; k4 = 10;
k5 = 2.1; k6 = 5; k7 = 2; k8 = 1.5; k9 = 5; k10 = 0.75;
k11 = 0.3; k12 = 15; k13 = 0.75; k15 = 1; k16 =0.5; k17 = 5;
k18 = 5; k19 = 0.02; k20 = 25; k21 = 0.5; kp = 0.1; kt = 0.1;
S = 2; α1 = 0.01; α2 = 0.01; α3 = 0.01; α4 = 0.173; α5 = 0.05; α6 = 0.07; α7 = 0.2; α8 = 0.0021; α9 = 0.2;
F0 = 0.01; l = 2; μ = 4; μ0 = 0.437; μ1 = 2.3; E30 = 11;
N = 0.05.
The parameters of the system and time are di-mensionless quantities [8].
These Eqs. (1)-(12) describe changes of concen-trations of the dimensionless corresponding agents.
The input substances in a blood vessel are ara-chidonic acid S and molecules of fat F, which are supplied into blood from the intestinal tract. The output agents of the system are aggregated thrombo-cytes tx* and oxidized lipoproteins L*, which are
ac-cumulated on internal walls of arteries. In the model we utilize the law of mass action and the kinetics of enzyme catalysis. The Eqs. involve the balance of masses of the intermediate products of reactions on separate stages of the metabolic process.
Eqs. (1) and (3) describe, respectively, changes in the concentrations of arachidonic acid at and apin thrombocytes and in endothelial cells of the vessel. These processes are affected by activity of the corre-sponding phospholipases. The coefficients k5 and k2
characterize, respectively, the rate of these proces ses. The accumulated arachidonic acid is transformed then by prostaglandin-H-synthase of thrombocytes
E1 and prostaglandin-H-synthase of prostacyclins E2. Respectively, thromboxanes tx (2) and prostacyclins
changes of the concentrations of enzymes E1 and E2. The coefficients k13 and k15 determine the intensity of biosynthesis in thromboxanes and endothelial cells. The inactivation of these enzymes is guided by the corresponding terms with the coefficients k7 and k10
in Eqs. (2) and (4). Eqs. (1)-(6) satisfy completely the balance of masses in enzyme catalysis. Eq. (7) de-scribes changes in the concentration of the control-ling component, cyclic adenosine monophosphate (cAMP) r. Its presence in Eqs. (1) and (3) creates the negative feedback that affects the level of activity of phospholipases of thrombocytes at and endothe-lial cells ap. Equation (8) describes aggregation of thrombocytes tx* and their dissipation under the
ef-fect of prostacyclin. Its concentration depends also on blood LDL level. Eqs. (9)-(12) characterize the metabolic process of formation of LDL in blood and the accumulation of plaques on walls of the vessel. Fat mole cules F (9) are supplied by blood to arte-ries from the liver and small intestine. Eqs. (9)-(10) describe the process of creation of “bad cholesterol”
L from fat. Its deposition on walls of blood vessels in the form of oxidized lipoproteids L* (plaques) is
described by Eqs. (10)-(11). In the metabolic pro-cess, the positive feedback controlled by enzyme E3
is formed (12). The accumulation of cholesterol in arteries and the growth of plaques cause thrombo-philia. In this case, the lumen of an artery becomes narrower, i.e., stenosis develops. The above Eqs. in-volve also the dissipation of the corresponding sub-stances at the expense of other metabolic processes and the flow of blood in an artery.
The given system is an open nonequilibrium one. Its study was carried out with the use of the
theory of nonlinear differential Eqs. [18, 19] and the methods of mathematical modeling used earlier in [20-27].
results of studies
The investigation of the mathematical model (1)-(12) has shown that, in addition to the ideal stationary modes of the metabolic process of the thrombosis-antithrombosis system [4-9], the model includes also autooscillatory modes. Depending on the rate of supply of molecules of fat F0 to blood, the level of “bad cholesterol” L varies. The metabolic process of hemostasis becomes unstable. The study of autooscillatory modes will enable us to compre-hend the dynamics of the metabolic process and to reveal the structural-functional connections in this system.
In Fig. 2, we show a phase-parametric dia-gram of the system for L(t) at a variation of F0 in the corresponding intervals. In order to construct the phase-parametric diagrams, we have used the cut-ting method. In the phase space of a trajectory of the system, we place a cutting plane for the value of concentration of cyclic adenosine monophosphate (cAMP) r = 1.77. If the trajectory crosses this plane in some direction, we mark the value of chosen vari-able on the phase-parametric diagram (L(t) in this case). Such choice is explained by the symmetry of oscillations of the given component relative to such point in multiply calculated earlier modes. For every value of L, we mark the intersection of the trajectory and this plane after the trajectory falls into the at-tractor. If a multifold periodic limiting cycle arises, we will see a number of points on the plane, which
Fig. 2. Phase-parametric diagram of the system for the variable L(t): a – F0∈ (0.01, 0.01005); b – F0∈ (0.010005, 0.010015)
coincide in the period. If a deterministic chaos ari-ses, the points of intersection are located chaotically.
It is convenient to consider the phase-para-metric diagram from right to left. As F0 decreases (Fig. 2, a), we observe the successive transition to autoperiodic modes with higher multiplicity due to a cascade of bifurcations with the doubling of a period, until the chaotic mode is finally established due to the intermittence. Such scenario is shown in Fig. 3, a-f. The phase portraits of regular attractors transfer to a strange attractor. As the given parame-ter decreases further, the chaotic modes hold in the system. In the interval F0 ∈ (0.010007, 0.010012) (Fig. 2, a, b), chaos is destroyed, and the periodic-ity window arises. In this window, the transition from autoperio dic modes to chaotic ones occurs also as a result of the cascade of bifurcations with the doubling of a period by Feigenbaum’s scenario. The transition finishes analogously to the previous scenario. Due to the intermittence, chaos is formed. The analogy of these scenarios indicates the fractal nature of the given cascades of bifurcations.
In Fig. 4, a,b, as an example, we show the pro-jections of the strange attractor 2x for F
0 = 0.01 in the
planes (L, F) and (E1, at ). The obtained strange at-tractor is formed due to the funnel effect. An element of the phase volume of such attractor is stretched in
Fig. 3. Projections of the phase portraits of attractors of the system in the plane (F, L): a – 1·20, for F
0 = 0.0102;
b – 1·21, for F
0 = 0.01005; c – 1·22, for F0 = 0.010045; d – 1·24, for F0 = 0.0100383; e – 1·28, for F0 = 0.010037;
f – 1·2x, for F = 0.010036
a b c
d e f
some direction and contracts in other directions, by preserving its stability. Therefore, the mixing of tra-jectories happens in narrow contracted regions of the phase space of a funnel, and the deterministic chaos arises.
For the given strange attractor in Fig. 5 a, b, c, we constructed the projection of the intersection with the plane r = 1.77 and the Poincaré image. The inter-section plane was chosen so that the phase trajectory
r(t) crosses it the maximal number of times, as the given component decreases, without any touching of the intersection plane by the phase curve.
The obtained intersection points and the Poin-caré image do not possess a geometric self-similari-ty. The number of points permanently increases with the duration of a numerical integration of the sys-tem. This demonstrates the chaoticity of the attractor and the impossibility of some reduction of the given complicated kinetic scheme of metabolic processes to a one-dimensional discrete approximation of the system under study.
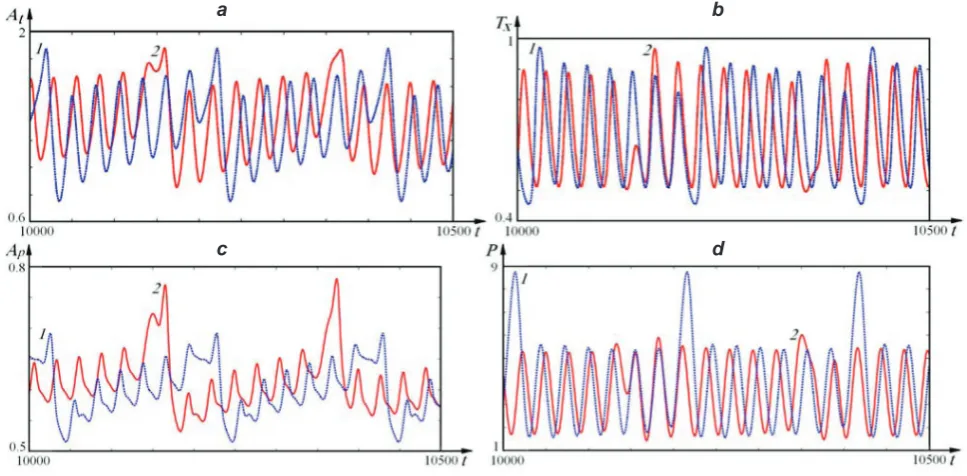
In Fig. 6 we compare the kinetics of some com-ponents of the system in the periodic (1) and chaotic (2) modes.
Fig. 4. Projections of phase portraits of strange attractor 2x, for F
0 = 0.01: a – in the plane (L, F), b – in the
plane (E1, at )
a b
Fig. 5. Intersection projection (a) and the Poincaré images (b), (с) with the plane R = 1.61 for a strange attrac-tor formed for F0 = 0.01
a b c
Fig. 6. Kinetic curves of the metabolic process of atherosclerosis during the running of the autoperiodic (1) (F0 = 0.0102) and chaotic (2) (F0 = 0.01) modes; a – at; b – tx; c – ap; d – P
a b
change of LDL affects the thrombosis-antithrombo-sis system by destroying a steady hemostathrombosis-antithrombo-sis of an artery. The balance between the amounts of choles-terol deposited in a blood vessel and that taken out with blood is violated. At certain point the amount of deposited cholesterol becomes larger. This favors the formation of plaques in a blood vessel. Thus, the appearance of atherosclerosis depends on the self-organization of the metabolic process in the thrombosis-antithrombosis system. Under the self-organization, blood vessels adapt to the conditions of nutrition. If a desynchronization of these processes occurs, the risk of atherosclerosis development be-comes more significant.
For the unique identification of the type of the obtained attractors and for the determination of their stability for various values of parameter F0, we cal-culated the complete spectra of Lyapunov’s
expo-nents and their sum: . The calculation
was carried out by Benettin’s algorithm with the orthogonali zation of the vectors of perturbations by the Gram-Schmidt method [18].
Using the Pesin theorem [28] and the values of Lyapunov indices, we calculated also the KS-entro-py (Kolmogorov-Sinai entroKS-entro-py) h and the Lyapunov index “predictability horizon” tmin [29]. The Lyapu-nov dimension DFr of the fractality of strange attrac-tors was found by the Kaplan-Yorke formula [30, 31]:
.
Below, as an example for comparison, we pre-sent some results of calculations of the mentioned indices.
For F0 = 0.01, the strange attractor 1·2x arises.
Fig. 7. Kinetic curves of variations of the concentrations of F and L in the chaotic metabolic process of athe-rosclerosis for F0 =0.01
3.5
L F
10200 0
10900 t
λ1 – λ16: 0.00192, 0.000197, -0.00432, -0.05045, -0.08331, -0.10046, -0.10209, -0.20994, -0.21184, -0.42267, -0.42267, -0.42267.
λ = -2.02831; h = 0.00192; tmin = 520.83;
DFr = 2.44.
For F0 = 0.010005, the strange attractor 1·2x arises.
λ1 – λ16: 0.00172, 0.00018, -0.00370, -0.05334, -0.08149, -0.09988, -0.10109, -0.20985, -0.21308, -0.42381, -0.42381, -0.42381.
λ = -2.03197; h = 0.00172; tmin = 581.40;
DFr = 2.46.
For F0 = 0.01001, the regular attractor 1·20
arises .
λ1 – λ16: 0.00004, -0.00044, -0.00155, -0.05447, -0.07744, -0.10082, -0.10476, -0.20904, -0.21267, -0.42695, -0.42695, -0.42695. λ =-2.04199.
For F0 = 0.010015, the strange attractor 1·2x arises.
λ1 – λ16: 0.00175, 0.00013, -0.00322, -0.05278, -0.08373, -0.09726, -0.10280, -0.21050, -0.21220, -0.42382, -0.42382, -0.42382.
λ =-2.03207; h = 0.00175; tmin = 571.43;
DFr = 2.54.
For F0 = 0.01002, the strange attractor 1·2x arises .
λ1 – λ16: 0.00150, 0.00016, -0.00296, -0.05170, -0.08509, -0.09718, -0.10317, -0.21069, -0.21162, -0.42314, -0.42314, -0.42314.
λ =-2.03017; h = 0.00150; tmin = 666.67;
DFr = 2.51.
For F0 = 0.010025, the regular attractor with quasiperiodic cycle ≈ n·20 arises.
For F0 = 0.01003, the regular attractor with quasiperiodic cycle ≈ n·20 arises.
λ1 – λ16: 0.00097, 0.00018, -0.00388, -0.05107, -0.08488, -0.09845, -0.10156, -0.21077, -0.21243, -0.42252, -0.42252, -0.42252. λ = -2.02944.
For F0 = 0.010035, the regular attractor with quasiperiodic cycle ≈ n·20 arises.
λ1 – λ16: 0.00065, 0.00013, -0.00408, -0.05188, -0.08540, -0.09748, -0.10064, -0.21061, -0.21283, -0.42306, -0.42306, -0.42306. λ = -2.03131.
For F0 = 0.01005, the regular attractor with quasiperiodic cycle ≈ n·20 arises.
λ1 – λ16: 0.00002, -0.00005, -0.00158, -0.05371, -0.08570, -0.09922, -0.09722, -0.20979, -0.21411, -0.42708, -0.42708, -.42708. λ = -2.04259.
These results show the variety of geometric structures of the obtained attractors and the predicta-bility of the metabolic process depending on the con-centration of molecules of fat in blood and on the level of “bad cholesterol”.
Calculating successively various strange attrac-tors, we can find some regularity in the hierarchy of their chaotic behavior. Respectively, the variation of the given indices changes a geometric view of attrac-tors of the system.
Autooscilations in the metabolic process of he-mostasis of a blood vessel arise due to the interac-tion between thrombosis and antithrombosis systems of blood, which is regulated by the level of cyclic adenosine monophosphate. The presence of “bad cholesterol” in blood causes desynchronization of these systems and the appearance of chaotic modes in the metbolism of a hemostasis. LDL affects the binding of thrombocytes and deposits on the walls of blood vessels. This leads to the autocatalysis of cholesterol in blood.
Thus, the hemostasis under a change of the amount of cholesterol in blood characterizes the adap tation of the metabolic process of a blood vessel to these changes, by preserving its functionality in this case.
We have constructed a mathematical model of the process of atherosclerosis of a blood vessel. The mathematical model describes the metabolic process of the thrombosis-antithrombosis system based on the prostacyclin-thromboxane system of blood. We have studied how molecules of LDL affect the im-balance of this system. The autooscillatory modes determined with this model indicate a complicated internal dynamics of formation of the self-organi-zation in a blood vessel, i.e. that of the hemostasis.
We have studied the dependence of autooscillatory modes on the concentration of fat in blood. Moreo-ver, we determined the chaotic modes of strange at-tractors. During such modes, the imbalance between the amount of “bad cholesterol” deposited in a blood vessel and its removal from the system happens. This provokes the formation of plaques in an artery. It is shown that affects the binding of thrombocytes and deposits on walls of blood vessels. This causes the autocatalysis of cholesterol in blood and the increase of its level. The mathematical study of the obtained modes is performed. The phase-parametric diagram, kinetic curves, projection of phase portraits, and Poincaré cross-sections and images are constructed. The Lyapunov’s exponents, divergencies, “predict-ability horizons,” and Lyapunov dimensions of the fractali ty of strange attractors are calculated. These indices characterize the stability and structure of calculated attractors.
The obtained results clarify the metabolic pro-cess of hemostasis and to find the structural-func-tional connections affecting the appearance of athe-rosclerosis of blood vessels.
The work is supported by the project N 0113U001093 of the National Academy of Scien-ces of Ukraine.
МатеМатична Модель Метаболічного процесу атеросклерозу
В. Й. Грицай
Інститут теоретичної фізики ім. М. М. Боголюбова НАН України, Київ,
e-mail: vgrytsay@bitp.kiev.ua
ляпуновські розмірності фрактальності дивних атракторів. Зроблено висновки про
структурно-функціональні зв’язки, що визначають
залежність гемостазу кровоносної системи від рівня холестеролу в крові.
К л ю ч о в і с л о в а: самоорганізація, гемо-стаз, хаос, кровоносна система, простациклін-тромбоксанова система, показники Ляпунова, КС-ентропія.
МатеМатическая Модель Метаболического процесса атеросклероза
В. И. Грицай
Институт теоретической физики им. Н. Н Боголюбова НАН Украины, Киев,
e-mail: vgrytsay@bitp.kiev.ua
Построена математическая модель метабо-лического процесса атеросклероза. Исследуется функционирование полиэнзимной простаци-клин-тромбоксановой системы крови и влияние на нее уровня «плохого холестерола» – липопро-теинов низкой плотности (LDL). При помощи числового эксперимента исследуется влия ние уровня концентрации молекул жира на гемо-стаз крови в кровеносных сосудах. Построе ны кинетические кривые компонентов системы, фазопериодические бифуркационные диаграм-мы, аттракторы разных режимов, сечение и отображение Пуанкаре странного аттрактора. Рассчитаны полные спектры показателей Ля-пунова, дивергенции, КС-энтропии, горизонты прогнозируемости и ляпуновские размерности фрактальности странных аттракторов. Сделаны выводы о структурно-функциональных связях, которые определяют зависимость гемостаза кровеносной системы от уровня холестерола в крови.
Ключевые слова: самоорганизация, гемо-стаз, хаос, кровеносная система, простациклин-тромбоксановая система, показатели Ляпунова, КС-энтропия.
references
1. Varfolomeev SD, Mevkh AT. Prostaglandins – Molecular Bioregulators. M.: Moscow University, 1985. 308 p. (In Russian).
2. Varfolomeev SD, Mevkh AT, Gachok VP. Kinetic model of a multienzyme system of blood prostanoid synthesis. I. Mechanism of stabilization of thromboxane and prostacyclin levels. Mol Biol. (Mosk). 1986; 20(4): 957-967. (In Russian).
3. Varfolomeev SD, Gachok VP, Mevkh AT. Kinetic behavior of the multienzyme system of blood prostanoid synthesis. Biosystems. 1986; 19(1): 45-54.
4. Grytsay VI. The conditions of the self-organization in the multienzyme prostacyclin-thromboxane system. Visn Kyiv Univ. 2002; (3): 372-376.
5. Grytsay VI, Gachok VP. The modes of self-organization in prostacyclin-thromboxane system. Visn Kyiv Univ. 2002; (4): 365-370.
6. Grytsay VI, Gachok VP. Ordered structures in the mathematical system of prostacyclin and thromboxane model. Visn Kyiv Univ. Ser. Fiz. Mat. Nauk. 2003; (1): 338-343.
7. Grytsay VI. Modeling of processes in the multienzyme prostacyclin and thromboxane system. Visn Kyiv Univ. 2003; (4): 379-384. 8. Gachok VP. Kinetics of Biochemical Processes.
K.: Naukova Dumka, 1988. 224 p. (In Russian). 9. Gachok VP. Strange Attractors in Biosystems. K.:
Naukova Dumka, 1989. 238 p. (In Russian). 10. Libby P. Atherosclerosis: the new view. Sci am.
2002; 286(5): 46-55.
11. Verkhusha VV, Staroverov VM, Vrzhesh PV. The model of adhesive interaction of cells in the flow of a fluid. Biol Membr. 1994; 11(4): 437-450. 12. Baluda VP, Baluda MV, Deyanov II. Physiology
of the System of Hemostasis. Moscow: Meditsina, 1995. 243 p.
13. Shitikova AS. Thrombocytic Hemostasis. St.-Petersburg, 2000. 225 p.
14. Libby P. Molecular bases of the acute coronary syndromes. Circulation. 1995; 91(11): 2844-2850.
15. Davies MJ. Stability and instability: two faces of coronary atherosclerosis. The Paul Dudley White Lecture 1995. Circulation. 1996; 94(8): 2013-2020.
16. Berliner J, Leitinger N, Watson A, Huber J, Fogelman A, Navab M. Oxidized lipids in atherogenesis: formation, destruction and action.
17. Steinberg D. Low density lipoprotein oxidation and its pathobiological significance. J Biol Chem. 1997; 272(34): 20963-20966.
18. Anishchenko VS. Complex Oscillations in Simple Systems. Moscow, Nauka, 1990. 312 p. (In Russian).
19. Kuznetsov S.P. Dynamical Chaos. Moscow: Nauka, 2001. 296 p. (In Russian).
20. Kosterin SO, Miroshnychenko MS, Davydo-vska TL, Tsymbaliuk OV, Prylutskyy YuI. Phenomenologic mechanokinetic model of Ca2+
-dependent contraction-relaxation of smooth muscle. Ukr Biokhim Zhurn. 2001; 73(6): 138-142. (In Ukrainian).
21. Kosterin SO, Miroshnychenko MS, Prylu-tskyy YuI, Davydovska TL, Tsymbaliuk OV. Mathematical model of trans-sarcomere exchange of calcium ions and Ca2+-dependent
control of smooth muscle contractile activity.
Ukr Biokhim Zhurn. 2002; 74(2): 128-133. (In Ukrainian).
22. Suprun AD, Prylutsky YuI, Shut AM, Miroshnichenko MS. Towards a Dynamical Model of Skeletal Muscle. Ukr J Phys. 2003; 48(7): 704-707.
23. Prylutskyy YuI, Shut AM, Miroshnychenko MS, Suprun AD. Thermodynamic and Mechanical Properties of Skeletal Muscle Contraction. Int J thermophys. 2005; 26(3): 827-835.
24. Kosterin SO, Prylutskyy YuI, Borysko PO, Miroshnychenko MS. Kinetic analysis of the
influence of inverse effectors (inhibitors and activators) on enzymatic (transport) activity of proteins. Ukr Biokhim Zhurn. 2005; 77(1): 113-125. (In Ukrainian).
25. Suprun AD, Shut AM, Prylutskyy YuI. Simulation of the Hill Equation for Fiber Skeletal Muscle Contraction. Ukr J Phys. 2007; 52(10): 997-1000. 26. Grytsay VI, Musatenko IV. Self-organization
and fractality in a metabolic processes of the Krebs cycle. Ukr Biokhim Zhurn. 2013; 85(5): 191-200.
27. Grytsay VI, Musatenko IV. Self-organization and chaos in the metabolism of a cell. Biopolym Cell. 2014; 30(5):404-409.
28. Pesin Ya.B. Characteristic Lyapunov indices and the ergodic theory. Usp Mat Nauk. 1977; 32(4): 55-112.
29. Kolmogorov AN. On the entropy per unit time as a metric invariant of automorphisms. DaN SSSr. 1959; 154: 754-755.
30. Kaplan JL, Yorke JA. The onset of chaos in a fluid flow model of Lorenz. ann N y acad Sci.
1979; 316(1): 400-407.
31. Kaplan JL, Yorke JA. A chaotic behaviour of multidimensional differential equations, in: Functional Differential Equations of Fixed Points, edited by H. O. Peitgen, H. O. Walther, Springer, Berlin, 1979. P. 204-227.