881
Int. J. Data Envelopment Analysis (ISSN 2345-458X)
Vol.4, No.1, Year 2016 Article ID IJDEA-00411, 12 pages
Research Article
Calculation of the Efficiency of Two-Stage Network
Structures with Additional Inputs to the Second Stage
by SBM Approach: A Case Study on Credit Branches
of an Iranian State Bank in Guilan Province
Saeed Jahangard Patavani
a*, Nasima Mahboubi
b(a) M.Sc, Department of Applied Mathematics, Islamic Azad University, Lahijan Branch, Lahijan, Assessor Keshavarzi Bank, Guilan, Iran.
(b) M.Sc, Department of Applied Mathematics, Islamic Azad University, Lahijan Branch, Lahijan, Iran.
Received 2 January 2016, Revised 9 March 2016, Accepted 29 May 2016 Abstract
Many studies have been conducted to determine the efficiency of two-stage network structures in the recent years. The two-stage network with additional inputs to the second stage, in which the second stage is independent of the first stage are one of these structures. Thus, there is a need for a model capable of calculating the efficiency of two-stage structures as well as efficiency of each stage which can then provide managers with recommendations to increase the efficiency of the entire system and its sub-processes. In this study, a non-cooperative game adapted from game theory and SBM approach is used to calculate the efficiency of a two-stage network structure to provide a unique analysis of the overall efficiency as the product of efficiency scores of the two stages. SBM approach is a non-radial DEA model capable of providing modification recommendations for inputs and outputs. The model then is implemented on 29 credit branches of an Iranian state bank in Guilan province and the results are analyzed.
Keywords: DEA, Two-Stage Network, Stackelberg Game, SBM Model, Bank.
* Corresponding Author: [email protected]
882
1. Introduction
Data Envelopment Analysis (DEA) was first introduced and developed by Charnes et al. [1]. DEA is a non-parametric mathematical programming method for analyzing the relative efficiency of homogeneous decision making units (DMU). It has received much attention due to its many advantages compared to parametric methods. The literature has indicated that DEA can be applied in different situations such as bank performance, bankruptcy evaluation, R & D, agriculture economic, etc. [2].
In primary DEA models, DMUs are used as a black box and the DMU's internal structure is ignored [2]. Recent studies such as F¨are & Grosskopf [3], Tone & Tsutsui [4], Liang et al. [5], Ashrafi et al.[6] and Li et al.[2]. however, have aimed to resolve this issue. DEA network structure has also been studied And its applications. For example, Ghafoorian et al. [7] used the two-stage data envelopment analysis (DEA) model to investigate the effects of credit risks on bank efficiency. Keramati and Shaeri [8] also investigated credit risk management as well as efficiency management in 19 Iranian banks using network DEA. They used a three-stage DEA model which once assessed bank efficiency without considering the credit risk factor, and used the credit risk factor for a second time as an additional input to the third stage and assessed the decision unit efficiency employing the same model. Zha et al. [9] used a dynamic Slack-Based Measure (SBM) two-stage DEA model to study Chinese banks. Chilingerian and Sherman
[10] developed another two-stage process for Healthcare applications. In recent studies on two-stage network systems, geometric/arithmetic means are used to decompose overall efficiency. Kao and Hwang [11] developed a method in which, for instance, if a set of insurance companies include the two-stage operations “premium acquisition” and “profit generation”, then the overall efficiency is the efficiency multiplication of the two stages. Chen et al. [12] developed envelopment and multiplier models to decompose two-stage systems' efficiencies as well as to project an inefficient unit on the efficient frontier. Moreover, they proposed a variable intermediate measures SBM (VSBM) model to assess the efficiency of two-stage systems. They also proved through a dual VSBM model that the overall system inefficiency is obtained by summing the inefficiency of the two stages. Tone and Tsutsui [4] developed a network DEA model by SBM which assessed both efficiency types, i.e. the overall efficiency and the sub-process efficiency. the overall efficiency of a network in this model is a weighted harmonic mean of its divisional scores with the weights set exogenously.
883
overall efficiency was not studied.
Figure 1 was investigated by Liang et al. [5] and Kao & Hwang [11]. This Figure assumes that all the inputs of the second stage are the outputs of the first stage (intermediate measures).
Figure 2 which was proposed by Li et al. [2] shows the model presented in Figure 1 with inputs to the second stage in addition to the intermediate measures.
This model assumes that each DMUj (j=1,...,n) includes m inputs, xij (i=1,...,m) and D outputs (intermediate measures), zdj (d=1,...,D) in the first stage. D outputs of the first stage become a part of inputs to the second stage. The other inputs of the second stage are xhj 2 (h=1,...,H). The set, yrj (r =1,...,s) are outputs of the second stage.
Ashrafi et al. [6] exploited the Tone and Tsutsui’s study [4] to use SBM model for evaluating the overall efficiency of the system shown in Figure 1 without additional inputs.
z , d 1, … , D
x , i 1, … , m y , r 1, … , s
Figure 1: A two-stage process of DMUj
z , d 1, … , D
x ,i=1,…,m y , r 1, … , s
x , h 1, … , H
Figure 2: A two-stage process with additional inputs to the
second stage for DMUj
1 1/ ∑
1 1/ ∑
s.t:
∑ , 1, … ,
∑ , 1, … , 1
∑ ∑ , 1, … ,
, , , 0
In this model, the third constraint is used to connect two sub-processes, but it does not specify how the processes are related to each other. If stage 1 be more important than stage 2, how it is reflected in the model? In addition, the Model (1) does not provide a decomposition for the overall efficiency of the system. Is it possible to present a model that provides a decomposition of the overall efficiency of the system?
Liang et al. [5] used the game theory to present cooperative and non-cooperative (Stackelberg) multiplier models to resolve aforementioned issues. Li et al. [2] used Liang’s model with additional inputs to the second stage to develop cooperative and non-cooperative (leaders and followers) multiplier models with the help of a heuristic approach. Their model is able to evaluate the overall efficiency and efficiencies of all stages. It should be noted that the optimal solutions of multiplier models are optimal weights. Thus, the zero weights will not help managers in analyzing the system. Therefore, there is a need for a model to clearly determine the efficiency score of each unit and sub-Processes
Stage1 Stage2
884
and to reduce or increase inputs and outputs, respectively.
The aim of the present study is to calculate the overall efficiency of the network and its sub-processes (Fig. 2) assuming the additional inputs for the second stage using SBM model and non-cooperative game to provide a unique decomposition of the overall efficiency as the product of the efficiency scores of the two stages. the rest of the article is organized as follows. Section 2 introduces the production possibility set. Section 3 presents the model and projected DMU for an inefficient DMU is calculated. The relevant theorems are presented in Section 4. Section 5 presents the results obtained from implementation of the model on 29 credit branches of an Iranian state bank in Guilan province and concluding remarks.
2. Production possibility set
According to Tone & Tsutsui [4], the production possibility set of the model shown in Fig. 2 is defined as follows:
P={ , , , | ,
,
,
,
; 0, 0 }
, and are defined in section 1 under the introduction to Fig. 1.The fifth property of the above production possibility set shows that the constraints z≤ Zλ and z ≥ Zμ cannot
simultaneously exist in a mathematical model.
3. Model
We need to determine the leader and follower in the non-cooperative game. The first stage is assumed to be the leader. Therefore, this stage is more important. The second stage is known as the follower player which takes decisions according to the decisions of the leader. The following model calculates the efficiency of the first stage (leader):
1 ∑
1 ∑
s.t:
∑ , 1, … ,
∑ , 1, … ,
, , 0 2 The Model (2) is the primary SBM model for
the single-stage DMUs where , and
are the optimal solutions. Since the two sub-processes are linked together by intermediate measures and the follower’s decisions are intended to be taken according to
the decisions of the leader, therefore and
should be considered in the calculation of the efficiency of the follower (see Doyl & Green [16]). Based on the Li et al. [2], the following model is proposed to calculate the efficiency of the second stage:
1 ∑ ∑
1 ∑
s.t:
885
∑ , 1, … ,
∑ , 1, … ,
∑ , 1, … ,
∑ ∑ , 1, … ,
1 ∑
1 ∑ 3
, , , , , , 0
The constraint number 6 guarantees that
and related to the efficiency of the first stage are considered in the calculation of the efficiency of the second stage. the above models are under the constant returns-to-scale assumption(CRS). By adding the relations (4) to the Models (2) and (3), calculation can also be done under the variable returns-to-scale assumption (VRS).
∑ 1 and ∑ 1 4)
After calculating the efficiency of the second stage, the overall efficiency of the system is calculated as follows:
, , 5)
Equation (5) gives an decomposition of the overall efficiency of the system. Moreover, clearly, , , 1 if and only if ρ1o = 1 and
ρ2o = 1.
Definition 1 (efficient NSBM): A DMUo is an efficient network SBM, if and only
if , , 1.
This definition is equivalent to =0, =0, =0, =0and =0. In other words, there is no inputs excesses and outputs Shortfalls in the inputs and outputs of the model.
If the second stage is the leader, then:
1 ∑ ∑
1 ∑
s.t:
∑ , 1, … ,
∑ , 1, … ,
∑ , 1, … , 6
… . , , , 0
1 ∑
1 ∑
s.t:
∑ , 1, … ,
∑ , 1, … ,
∑ , 1, … ,
∑ , 1, … ,
∑ ∑ , 1, … , 7
1
∑ ∑
1 ∑
, , , , , , 0
And the overall efficiency is calculated as follows:
η , , η η 8
3.1. SBM projection
It is assumed that the optimal solutions of Models (3) and (7) are available for DMUo
like ( , , , , ). Then, the DMUo
886
∑ ∑ (9)
4. Theorems
Theorem 1: The virtual DMU obtained from the Model (9) is globally efficient.
Proof: Assume that the virtual DMU obtained from the Model (9) is not globally efficient. It is also assumed that the optimum solution of the virtual DMU is obtained from the Model (3) as follows:
, ́ , ́, , ́
Therefore:
∑ ́ .
∑ ́ ́ . (10)
∑ ́ .
Substituting relation (9) in relation (10):
∑ ́
∑ ́ ́ (11)
∑ ́
Given the objective function of the Model (3):
́
1 ∑ ∑
1 ∑
(12) According to proof by contradiction, since the solution of the Model (9) is not efficient, then:
́ 0 0
Therefore: ́
This is inconsistent with the optimality of ρ2 *. Thus, the absurd hypothesis is canceled and the virtual DMU obtained from the Model (9) is globally efficient.
Theorem 2: If and are respectively the efficiencies of the first and second stages when
the first stage is the leader and and are the corresponding efficiencies when the second stage is leader, then:
,
Proof: Assume that the solution of the Model (7) is as follows:
, , , , , , , , , , , ,
, , , , , , , ,
φ is defined as follows:
, , , , , , , ,
φ is a feasible solution for the Model (2). Given the objective function of the Model (2):
1 ∑ , ,
1 ∑ , , 13
The term on right hand of the relation (13) is the optimal solution of the Model (7). Thus,
ρ η .
Similarly, it can be proved that ρ η . According to the first theorem in the Li et al. model [2], (where e and π1* are the efficiencies of the first stage when the first and second stages are leaders respectively). However, the opposite occurred in the above theorem because of the nature of SBM model seeking the maximum value of inputs excesses and outputs shortfalls. Therefore, when the first stage is chosen as leader, the SBM model suggests maximum slack variables to modify inputs and outputs. Accordingly, the efficiency of the leader stage will be minimal.
887
the second stage as well as the efficiency of the sub-processes, and ultimately derive a unique decomposition for the overall efficiency. We also defined projections of inefficient DMUs on the efficient frontier so that CEOs could distinguish efficient units from inefficient ones, and lead the inefficient units towards efficiency. An application of the model is presented as follows.
5. Application
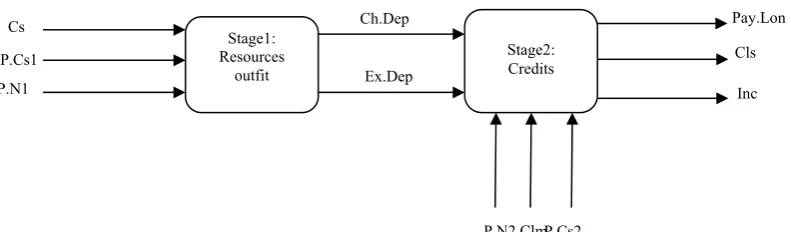
The models and findings of this paper are applied on 29 credit branches of an Iranian state bank in Guilan province. Figure 3 shows the processes of the branches to attract and distribute resources which consist of two sub- processes of resources outfit and credits.
In the first stage (resources outfit), bank branches try to attract deposits and give the absorbed deposits to the second stage (credits) to be used for payments and revenue. In addition to new payment loans in the second stage, it also has the task of collecting paid loans. Since a part of the new loans are supplied by reception of the previously paid loans, the lack of reception of loans would be costly for the branch. As a result, the claims
from customers who received loans and did not pay more than three months past their payment due can be considered as an input for the second stage. Measures, which sure would be costly, should be taken to collect loans.
The bank service posts include cashier, Head of fund, resources outfit, Head of finance, senior user, collection, credits, expert, assessor, archivist, vice president and president. Given the role of each post, the branch staffs are partitioned into two sets. staff at the first 5 roles are a member of resource outfit set and the personnel in the next 5 roles are placed in the credits group. Given the supervisory nature of the roles of vice president and president, these were placed in the resource outfit and credits groups respectively based on the recommendations of the bank experts.
Given the above description, the inputs and outputs of each stage are explained in Figure 3.
The inputs to the resource outfit stage
include:
Cs: Operational, administrative, improvement and maintenance of buildings and computer
Figure 3: The two-stage model of credit branches with additional inputs to credits stage P.Cs2
P.N2 Clm Stage1:
Resources outfit
Stage2: Credits Cs
P.Cs1
P.N1
Ch.Dep
Ex.Dep
Pay.Lon
Cls
888
systems costs.
P.Cs1: Personnel costs of the resources outfit division
P.N1: Number of personnel in the resource outfit division
The outputs of this stage include:
Ch.Dep: Public low-cost deposits such as checking accounts
Ex.Dep: Public long term deposits that the branch has to spend money for attracting them. These outputs are inputs to the second stage.
The additional inputs to the second stage
are independent of the first stage and
include:
P.Cs2: Personnel cost of the credits stage P.N2: Number of personnel in the credits stage
Clm: Branch claims consisting of past due loans and overdue and doubtful receivables
The outputs of the credits stage include:
Pay.Lon: payment loans from the resources collected by the branch.
Clc: Collection including the reception of all paid loans.
Inc: Total income branch.
Table 1 shows data from 29 credit branches of an Iranian state bank in Guilan province in 2013 collected from the management of the bank branches.
According to Table 2, Theorem 2 is true for the results.
Four branches are efficient when the first stage is leader and two branches are efficient when the second stage is leader. In most
cases, ρ , , ≥ η , , reflecting the
importance of the resources outfit stage in the bank branches
.
6.Conclusion
889
Table 1: Inputs and outputs of the 29 branches of a bank in Guilan province
DMU input to the first stage intermediate
measures
additional inputs to the
second outputs of the second stage
890
Table 2: The results of non-cooperative (Stackelberg) model
Stage 2 is Leader Stage 1 is Leader
891
cooperative (Stackelberg) model of behavior and its outcomes; since in practice, network processes consider leaders and followers in financial and nonfinancial organizations as well as state and private organizations.
We also proved that if the first stage is the leader, then its efficiency score is lower than when the second stage is considered as the leader. This is concluded from SBM model which indicates all units' inefficiencies. Therefore, careful attention must be paid to the selection of the leader stage so that it is in line with the nature of the studied network.The method presented in this paper can be used for multi-stage network structures.
Acknowledgements
Many thanks to Professor Alireza Amirteimoori(Full professor in Applied Mathematics and Operations Research,Islamic Azad University,Rasht, Iran,) for guides he that offered in the study.
References:
[1] Charnes A, Cooper WW, Rhodes E. Measuring the efficiency of decision making units. European Journal of operational Research. 1978; 2(6):429-44.
[2] Li Y, Chen Y, liang L, Xie J. DEA models for extended two-stage network, structures. Omega. 2012; 5(40): 611-18.
[3] F¨are R, Grosskopf S. Network DEA. Socio-Economic Planning Sciences. 2000; 34, 35–49.
[4] Tone K, Tsutsui M. Network DEA: a slacks-based measure approach. European Journal of Operational Research. 2009; 197(1): 243–52.
[5] Liang L, Cook WD, Zhu J. DEA models for two-stage processes :game approach and efficiency decomposition. Naval Research Logistics. 2008; 55(7): 643-53.
[6] Ashrafi A, Jaafar AB, Lee LS, Abu Bakar MR. A Slacks-Based measure of sufficiency in two-stage data envelopment analysis. int.Journal of math. analysis. 2011; 5(29): 1435-44.
[7] Ghafoorian H, Anuar M, Norhan N, Abubakar M, Mahammadi F. Efficiency Considering Credit Risk in Banking Industry, using two-stage DEA. Journal of social and Development Sciences. 2013; 4(8):356-60. [8] Keramati MA, Shaeri M. Assessment of credit Risk management and Managerial Efficiency of Banks Using Data Envelopment Analysis (DEA) Network. Biological Forum-An International Journal. 2014; 2(6): 320-28. [9]Zha Y, Liang N, Wu M, Bian Y. Efficiency evaluation of banks in China: A dynamic two-stage slacks-based measure approach. Omega. 2016; 60: 60-72.
[10] Chilingerian J, Sherman HD. Health care applications in: From hospitals to physician, from productive efficiency to quality frontiers, Handbook on data envelopment analysis. Cooper ww, Seiford LM, Zhu j, Editors. Boston: Springer; 2004.
892
in two-stage data envelopment analysis: an application to non-life insurance companies in Taiwan. European Journal of operational Research. 2008; 185(1): 418-29.
[12] Chen Y, Li Y, Liang L, Salo A, Wu H. Frontier projection and efficiency decomposition in two-stage processes with slacks-based measures. European Journal of Operational Research. 2016; 250(2): 543-54. [13] Chen Y, Cook WD, Li N, Zhu J. Additive efficiency decomposition in two-stage DEA. European Journal of Operational Research. 2009; 196(3): 1170–6.
[14] Chen Y, Zhu J. Measuring information technology’s indirect impact on firm performance. Information Technology & Management Journal. 2004; 5(1-2): 9–22. [15] Tone K, Tsutsui M. Dynamic DEA with network structure: A slacks-based measure approach. Omega. 2014; 42(1): 124–31.
![Figure 1 was investigated by Liang et al. [5] and](https://thumb-us.123doks.com/thumbv2/123dok_us/10109.2000795/3.595.313.521.108.250/figure-investigated-liang-et-al.webp)