AUT J. Civil Eng., 3(1) (2019) 129-136 DOI: 10.22060/ajce.2018.14522.5482
Using Empirical Correlations to Evaluate the Compression Index of Tehran Clay
D. Akbarimehr, E. AflakiDepartment of Civil and Environmental Engineering, Amirkabir University of Technology, Tehran, Iran
ABSTRACT: Correlations between different parameters are used extensively in geotechnical engineering. Using correlations reduces the costs of testing and more speeds in determining the geotechnical properties of soils. Various relations have been proposed to evaluate geotechnical properties in different regions across the globe. Correlations facilitate the evaluation of geotechnical properties. The correlation between different parameters depends on the type of the soil and the experimental method. Considering the fact that these relations depend on local soil properties, using these relations for other regions is contingent upon a careful evaluation. This study evaluates the feasibility of using correlations presented by researchers in different years for Tehran clay. The evaluation uses different statistical criteria. The study shows the Bowles (1979) relation, correlating the soil compression index and the initial void ratio, is the best fit for Tehran clay among the studied correlations. In addition, the quality of the correlations can be evaluated for Tehran clay. Correlations between the soil compression index and initial void ratio often estimate the compression index with acceptable accuracy while correlations between the compression index and other geotechnical properties, such as the initial water content, plasticity index, shrinkage index, the liquid limit, and the soil density, are less accurate.
Review History:
Received: 29 May 2018 Revised: 21 July 2018 Accepted: 29 July 2018 Available Online: 15 August 2018
Keywords:
Compression Index Physical Properties Correlation Tehran Clay Consolidation Test
1- Introduction
Consolidation parameters are important factors, particularly in cases regarding the soil settlement. Consolidation parameters can be calculated and evaluated by consolidation testing. In the consolidation test, the specimen undergoes different consolidation pressures, often resulting in two distinguished regions in the e-log p’ diagram considering the in-situ stresses. The first region is located before pre-consolidation stress where the slope is denoted by Cs, whereas
the second region is located after the pre-consolidation stress and the slope in this region is known as the soil compression index and is denoted by Cc. Used to calculate soil settlement, the soil compression index is an important parameter. The correlation between the compression index and different physical properties of the soil has been investigated by many researchers for various regions. Skempton first introduced the relationship between the compression index and liquid limit [1] in 1944. Many relations were later proposed, correlating the soil compressibility with its physical parameters, including the dry density, initial void ratio, liquid limit, plasticity index, and others. In 1976, Azzouz et al. proposed different relations to evaluate the compression index and the compression ratio using the soil physical parameters [2]. Other researchers including Sridharan and Nagaraj [3], Ozer et al. [4] and Widodo and Ibrahim [5] have proposed relations to evaluate
the soil compression index and its physical properties. Komar et al. [6] have also proposed relations to evaluate the soil compression index using the plasticity index. In addition, similar correlations have been proposed for marine clays to evaluate the soil compression index, including a study by Kootahi and Moradi [7]. The most prominent of these relations are listed in Table 1. As evident from the table, there are many correlations between the soil compression index and other parameters. Naturally, each relation is proposed for a specific region and its use in other locations is contingent upon a careful study. The study of Onyejekwe and Kang [8] in Missouri, Nigeria, can be mentioned as an example of evaluating the correlations of the soil compression index for other regions to be applied for the fine soil in a specific area. The soil in the areas south of Tehran are predominantly clay; therefore, the fast estimation of soil compression index is important for calculating the settlement in this region. Furthermore, no relation has been proposed yet for evaluating the compression index of the clay soil in this area. In view of that, this study addresses the feasibility of using the available relations for the clay soil in south Tehran area.
determining the geotechnical properties of the soil using appropriate correlation relations, it is possible to determine the soil quality of the area for construction and possibly its improvement.
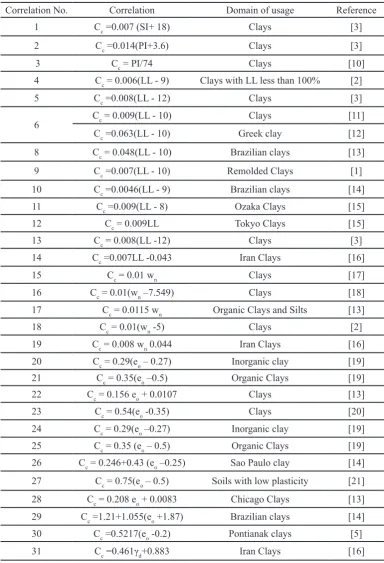
Table 1. Correlations available for estimation of soil compression index
Correlation No. Correlation Domain of usage Reference
1 Cc =0.007 (SI+ 18) Clays [3]
2 Cc =0.014(PI+3.6) Clays [3]
3 Cc = PI/74 Clays [10]
4 Cc = 0.006(LL - 9) Clays with LL less than 100% [2]
5 Cc =0.008(LL - 12) Clays [3]
6 Cc = 0.009(LL - 10) Clays [11]
Cc =0.063(LL - 10) Greek clay [12]
8 Cc = 0.048(LL - 10) Brazilian clays [13]
9 Cc =0.007(LL - 10) Remolded Clays [1]
10 Cc =0.0046(LL - 9) Brazilian clays [14]
11 Cc =0.009(LL - 8) Ozaka Clays [15]
12 Cc = 0.009LL Tokyo Clays [15]
13 Cc = 0.008(LL -12) Clays [3]
14 Cc =0.007LL -0.043 Iran Clays [16]
15 Cc = 0.01 wn Clays [17]
16 Cc = 0.01(wn –7.549) Clays [18]
17 Cc = 0.0115 wn Organic Clays and Silts [13]
18 Cc = 0.01(wn -5) Clays [2]
19 Cc = 0.008 wn 0.044 Iran Clays [16]
20 Cc = 0.29(eo – 0.27) Inorganic clay [19]
21 Cc = 0.35(eo –0.5) Organic Clays [19]
22 Cc = 0.156 eo + 0.0107 Clays [13]
23 Cc = 0.54(eo -0.35) Clays [20]
24 Cc = 0.29(eo –0.27) Inorganic clay [19]
25 Cc = 0.35 (eo – 0.5) Organic Clays [19]
26 Cc = 0.246+0.43 (eo –0.25) Sao Paulo clay [14] 27 Cc = 0.75(eo – 0.5) Soils with low plasticity [21]
28 Cc = 0.208 eo + 0.0083 Chicago Clays [13]
29 Cc =1.21+1.055(eo +1.87) Brazilian clays [14]
30 Cc =0.5217(eo -0.2) Pontianak clays [5]
2- Data
Data from specimens gathered by sampling was used in this study. Considering the fact that the soil is often disturbed in the surface layers, the specimens used in this study were all collected from a depth of 2 m, using a 15 cm core cutter, at an aspect ratio of 5.5%. It must be noted that the specimens were considered undisturbed as the aspect ratio is smaller than 10%. The undisturbed soil specimens were consolidation-tested while the disturbed ones were consolidation-tested for determination of physical properties. The tests were conducted in the soil mechanics laboratory at Amirkabir University of Technology with a high accuracy. A preliminary study of the soils in south Tehran revealed they are predominantly clay; accordingly, specimens were collected and tested from Eslamshahr, Varamin, Shahriar, Robatkarim, Pakdasht, and Rey counties. The sampling locations are shown on the map in Figure 1.
Figure 1. Positions from which samples were taken
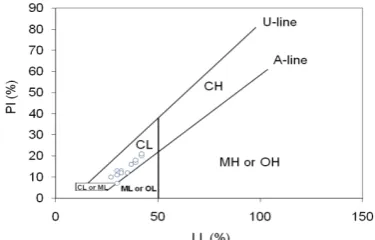
Using the Casagrande chart is a typical method of classifying fine clay soil specimens. The Atterberg limit tests were conducted on soil specimens for locating them on the chart with the results presented in Figure 2. According to this chart, the clay soil specimens are chiefly located in the CL range.
Figure 2. Sampled data in the Casagrande chart
Tests in this study were conducted in compliance with ASTM standards and include determining the natural water content (D2216-10), the liquid limit, plasticity limit, and plasticity index (D4318-10), the specific gravity (D854-10), and consolidation testing (D2435-11). The properties of the studied soils are listed in Table 2 as determined by the said tests. According to the table, the geotechnical properties of the clay soil specimens from different regions are largely similar and change within a limited range. This may significantly impact the relations that can be used in this region.
3- Analysis Methods
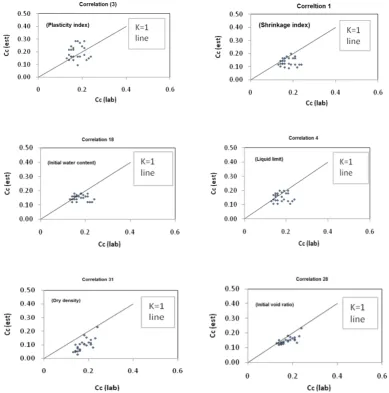
Various relations and correlations have been proposed by researchers for different geographies. Using these relations in regions other than what they were developed for without the necessary considerations may produce inaccurate results, thus undermining any plan based on them. Figure 3 compares the compression indices obtained for Tehran clay soil specimens from experimental results with results from available empirical relations as an example of the correlation between the soil compression index and various parameters (plasticity index, shrinkage index, natural water content, liquid limit, initial void ratio, and dry density). In this figure, Cc(lab) represents the compression index obtained from experimental consolidation testing whereas Cc(est) denotes the
compression index resulting from the empirical relations.
Parameter Number of samples Minimum Maximum average Deviation from criterion W (%)
31
17 23 20 2
LL (%) 27 42 34 5
PI (%) 7 21 14 4
Void ratio 0.536 1.08 0.679 0.119
Density 1.31 1.74 1.59 0.1
Cc 0.13 0.24 0.18 0.03
According to Figure 3, some correlations including parameters such as the liquid limit, plasticity index, shrinkage index, natural water content, and dry density, are associated with a wide distribution, thus lacking enough accuracy to be applied to Tehran soil. Others such as initial void ratio, however, come with a narrower dispersion, thus offering a higher accuracy to estimate the Tehran soil compression index.
This study reviews the feasibility of relations proposed by different researchers for estimating the geotechnical properties of Tehran clay. It is evident that the soil compression index is estimated accurately by some relations, meaning they can be used to evaluate and estimate the geotechnical properties of Tehran clay. On the other hand, the results from some of these relations are far from realistic.
That not all relations may be applicable to all regions can be attributed to a few reasons. For one, soils from different regions vary in geotechnical properties. Using different experimental standards of determining soil properties can also contribute to the difference between the relations. The
Figure 3. Compression index obtained from the tests versus the compression index obtained from the experimental relations
another factor in play. Furthermore, the water content of the specimens can also impact the resulting relations.
about comparing and evaluating the available correlations based on the results they produce for Tehran clay soil. Given the complications of the soil composition and its conditions, all relations were evaluated to find the best ones. The validity and feasibility of the said relations are evaluated by the following statistical methods:
1. Root Mean Square Error (RMSE)
2. The mean and standard deviation method, comparing the estimated compression index with the consolidation test results (K).
3. Ranking Index (RI)
4. Ranking Distance (RD)
Each of these methods will be readily discussed in detail. 3- 1- The RMSE Criterion
The RMSE is the root mean square of the difference between Cc(est) and Cc(lab). Where Cc(est) is the obtained from
available correlations and Cc(lab) is found by experiment. This method has been used by many researchers [4, 8, 24-27] to evaluate the efficiency of the empirical correlations. RMSE is obtained as follows:
RMSE=√(1/n ∑1n(Cc(est) -Cc(lab) )2) (1)
Where n represents the number of data points. According to the above relation, the lower the RMSE, the more valid the correlation.
3- 2- The K Method
In this method, the coefficient K is obtained using the following relation.
K=Cc(est) /Cc(lab) (2) This method has been practiced by many researchers for the purpose of statistical evaluation [8, 28-30]. Accuracy is defined with respect to the dispersion of the data [28-30]. In theory, K can assume any value between 0 to infinity, with an optimal value of 1. This method has been practiced by many researchers to evaluate the efficiency of the empirical correlations [8, 29, 31-33]. The use of the K or RSME method has also been observed in the composition of soil additives [34,35].
3- 3- The Ranking Index (RI)
The normal distribution diagram and ranking index have been utilized by many researchers to overcome the problem of asymmetrical distribution of the data obtained from the K method [8, 28]. This method evaluates the correlation quality when using the average and standard deviations method (K). The parameter can be obtained as follows [28].
RI=|μ(ln[K]) |+S(ln[k]) (3)
Where μ represents the average and S denotes the standard deviation.
3- 4- Ranking Distance (RD)
In this method, the correlation quality is evaluated based on the known average and the standard deviation [29]. Different researchers have practiced this method for the
represents the average (μ) whereas the other one shows the standard deviation (S). In this method, the difference between the average and standard deviations corresponding to the empirical relation are calculated from the optimal mean and standard deviation (μ=1, S=0) and denoted by RD. The parameter can be obtained as follows:
RD=√((1-μ(K))2+(S(K))2) (4)
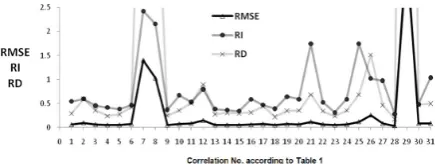
Figure 4. Results of RMSE, RI and RD Results in Tehran Clay
4- Analysis and Discussion
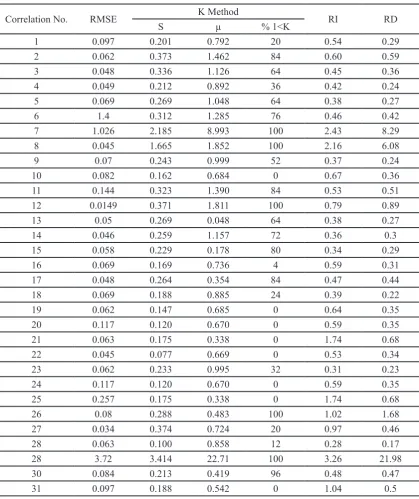
Table 3 summarizes the results using different criteria including RI, K, RMSE, and RD for data obtained from different geographies and from the Tehran fine-grain soil. Furthermore, Figure 4 depicts the results diagram.
4- 1- Evaluation by RMSE
According to Table 3, with an RMSE of 0.034, Equation 27 (proposed for low-plasticity soils and correlating the soil compression index to the initial void ratio) is the best fit among single-parameter correlations [21]. In addition, Equation 8, a correlation between the soil compression index and the liquid limit for Brazil clay soils with an RMSE of 0.045, and Equation 22, correlating the soil compression index to the initial void ratio for all clays with an RMSE of 0.45, are also suitable relations according to this criterion [13].
4- 2- Evaluation by K
Table 3. Results of RMSE, K and RD Values in Tehran Clay
Correlation No. RMSE K Method RI RD
S μ % 1<K
1 0.097 0.201 0.792 20 0.54 0.29
2 0.062 0.373 1.462 84 0.60 0.59
3 0.048 0.336 1.126 64 0.45 0.36
4 0.049 0.212 0.892 36 0.42 0.24
5 0.069 0.269 1.048 64 0.38 0.27
6 1.4 0.312 1.285 76 0.46 0.42
7 1.026 2.185 8.993 100 2.43 8.29
8 0.045 1.665 1.852 100 2.16 6.08
9 0.07 0.243 0.999 52 0.37 0.24
10 0.082 0.162 0.684 0 0.67 0.36
11 0.144 0.323 1.390 84 0.53 0.51
12 0.0149 0.371 1.811 100 0.79 0.89
13 0.05 0.269 0.048 64 0.38 0.27
14 0.046 0.259 1.157 72 0.36 0.3
15 0.058 0.229 0.178 80 0.34 0.29
16 0.069 0.169 0.736 4 0.59 0.31
17 0.048 0.264 0.354 84 0.47 0.44
18 0.069 0.188 0.885 24 0.39 0.22
19 0.062 0.147 0.685 0 0.64 0.35
20 0.117 0.120 0.670 0 0.59 0.35
21 0.063 0.175 0.338 0 1.74 0.68
22 0.045 0.077 0.669 0 0.53 0.34
23 0.062 0.233 0.995 32 0.31 0.23
24 0.117 0.120 0.670 0 0.59 0.35
25 0.257 0.175 0.338 0 1.74 0.68
26 0.08 0.288 0.483 100 1.02 1.68
27 0.034 0.374 0.724 20 0.97 0.46
28 0.063 0.100 0.858 12 0.28 0.17
28 3.72 3.414 22.71 100 3.26 21.98
30 0.084 0.213 0.419 96 0.48 0.47
31 0.097 0.188 0.542 0 1.04 0.5
4- 3- Evaluation by RI
Based on RI, Equation 28 (correlating the compression index to the initial void ratio for Chicago clay) with an average RI of 0.28 [13], Equation 23 (correlating the compression index to the liquid limit for all clay soils) with an average RI of 0.31 [20], and Equation 15 (correlating the compression index to the natural water content for all clay soils) with a RI of 0.34 offer the highest accuracy among the studied single-parameter correlations [17].
4- 4- Evaluation by RD
5- Conclusion
Drawing on four different statistical methods (RI, K, RMSE, and RD), the fitness of the available empirical correlations was evaluated to estimate the compression index of Tehran clay.
The analysis results can be summarized as follows:
Given the different conditions and types of soil minerals in different areas, it was revealed that a few of the relations can be used for the Tehran clay soil.
In cases where K is greater than 1, the correlation overestimates the parameter and must be used with care. Based on this criterion, the average can be overestimated by up to 2.5 times in some cases, which requires them to be used with particular care.
Among the single-parameter correlations, the one proposed by Bowles (1979), correlating the soil compression index to the initial void ratio for Chicago clay, offers the highest accuracy and can be recommended for Tehran clay. The correlation is as follows:
Cc=0.208 e0+0.0083
The evaluations revealed that correlations between the soil compression index and the initial void ratio are often valid and applicable to Tehran clay.
The accuracy of correlations between the compression index and other parameters including the Atterberg limits, initial water content, and specific weight was found to be below par for Tehran clay.
References
[1] A.W. Skempton, O. Jones, Notes on the compressibility of clays, Quarterly Journal of the Geological Society, 100(1-4) (1944) 119-135.
[2] A.S. Azzouz, R.J. KRIZEK, R.B. COROTIS, Regression analysis of soil compressibility, Soils and Foundations, 16(2) (1976) 19-29.
[3] A. Sridharan, H. Nagaraj, Compressibility behaviour of remoulded, fine-grained soils and correlation with index properties, Canadian Geotechnical Journal, 37(3) (2000) 712-722.
[4] M. Ozer, N.S. Isik, M. Orhan, Statistical and neural network assessment of the compression index of clay-bearing soils, Bulletin of Engineering Geology and the Environment, 67(4) (2008) 537-545.
[5] S. Widodo, A. Ibrahim, Estimation of primary compression index (CC) using physical properties of Pontianak soft clay, International Journal of Engineering Research and Applications (IJERA), 2(5) (2012) 2232-2236.
[6] V.K. Jain, M. Dixit, R. Chitra, Correlation of plasticity index and compression index of soil, International Journal of Innovations in Engineering and Technology (IJIET), 5(3) (2015) 263-270.
[7] K. Kootahi, G. Moradi, Evaluation of compression index of marine fine-grained soils by the use of index tests, Marine Georesources & Geotechnology, 35(4) (2017) 548-570.
[8] S. Onyejekwe, X. Kang, L. Ge, Assessment of empirical equations for the compression index of fine-grained soils in Missouri, Bulletin of Engineering Geology and the Environment, 74(3) (2015) 705-716.
[9] D. Akbarimehr, E. Aflaki, An Experimental Study on the Effect of Tire Powder on the Geotechnical Properties of Clay Soils, Civil Engineering Journal, 4(3) (2018) 594-601.
[10] C. Wroth, D. Wood, The correlation of index properties with some basic engineering properties of soils, Canadian Geotechnical Journal, 15(2) (1978) 137-145.
[11] K. Terzaghi, R.B. Peck, Soil mechanics in engineering pratice, 1967.
[12] F. Abdrabbo, M. Mahmoud, Correlations between index tests and compressibility of egyptian clays, Soils and Foundations, 30(2) (1990) 128-132.
[13] J.E. Bowles, Physical and geotechnical properties of soils, (1979).
[14] V. Cozzolino, Statistical forecasting of compression index, in: Proceedings of the 5th international conference on soil mechanics and foundation engineering Paris, 1961, pp. 51-53.
[15] T. Tsuchida, A new concept of e-logp relationship for clays, in: Proceedings of the 9th Asian regional conference on soil mechanics and foundation engineering, Bangkok, Thailand, 1991, pp. 87-90.
[16] n. aBBASI, A new Empirical Equation for Compression Behavior of Unconsolidated Clay Soils, Journal of Civil Engineering Ferdowosi University of mashhad 24(2) (1392) ( in Persion).
[17] S. Koppula, Statistical estimation of compression index, ASTM Geotechnical Testing Journal, 4(2) (1981). [18] O. Rendon-Herrero, Closure to “Universal Compression
Index Equation” by Oswald Rendon-Herrero (November, 1980), Journal of Geotechnical Engineering, 109(5) (1983) 755-761.
[19] B.K. Hough, Basic Soils Engineering, (1957).
[20] Y. Nishida, A brief note on compression index of soil, Journal of the Soil Mechanics and Foundations Division, 82(3) (1956) 1-14.
[21] G. Sandvik, G. Sowers, Introductory soil mechanics and foundations, Introductory soil mechanics and foundations, (1970).
[22] C. Cherubini, Compressibility characteristics of the Matera Blue Clays as determined by means of statistical correlations, in: Proceedings of the 10th European conference on soil mechanics and foundation engineering (AGI), Firenze, 1991, pp. 59-62.
[23] A. Al-Khafaji, O. Andersland, Equations for compression index approximation, Journal of geotechnical engineering, 118(1) (1992) 148-153.
[24] M.A. Grima, R. Babuška, Fuzzy model for the prediction of unconfined compressive strength of rock samples, International Journal of Rock Mechanics and Mining Sciences, 36(3) (1999) 339-349.
[26] C. Gokceoglu, A fuzzy triangular chart to predict the uniaxial compressive strength of the Ankara agglomerates from their petrographic composition, Engineering Geology, 66(1) (2002) 39-51.
[27] I. Yilmaz, Indirect estimation of the swelling percent and a new classification of soils depending on liquid limit and cation exchange capacity, Engineering Geology, 85(3) (2006) 295-301.
[28] J.-L. Briaud, L.M. Tucker, Measured and predicted axial response of 98 piles, Journal of Geotechnical Engineering, 114(9) (1988) 984-1001.
[29] C. Cherubini, T. Orr, A rational procedure for comparing measured and calculated values in geotechnics, Coastal Geotechnical Engineering in Practice, Yokohama, 1 (2000) 261-265.
[30] C. Giasi, C. Cherubini, F. Paccapelo, Evaluation of compression index of remoulded clays by means of Atterberg limits, Bulletin of Engineering Geology and the Environment, 62(4) (2003) 333-340.
[31] H. Titi, M. Farsakh, Evaluation of Bearing Capacity of Piles from Cone Penetration Test, Lousiana Transportation Research Center, (1999).
[32] M.Y. Abu-Farsakh, H.H. Titi, Assessment of direct cone penetration test methods for predicting the ultimate capacity of friction driven piles, Journal of Geotechnical and Geoenvironmental Engineering, 130(9) (2004) 935-944.
[33] C. Cherubini, C. Giasi, Correlation equations for normal consolidated clays, Coastal Geotechnical Engineering in Practice, Yokohama, 1 (2000) 15-20.
[34] D. Akbarimehr, E. Aflaki, A. Eslami, Experimental Investigation of the Densification Properties of Clay Soil Mixes with Tire Waste, Civil Engineering Journal, 5(2) (2019) 363-372.
[35] D. Akbarimehr, E. Aflaki, An Experimental Study on the Effect of Tire Powder on the Geotechnical Properties of Clay Soils, Civil Engineering Journal, 4(3) (2018) 594-601.
[36] D. Akbarimehr, E. Aflaki, Site investigation and use of artificial neural networks to predict rock permeability at the Siazakh Dam, Iran, Quarterly Journal of Engineering Geology and Hydrogeology, 52(2) (2019) 230-239.
Please cite this article using:
D. Akbarimehr, E. Aflaki, Using Empirical Correlations to Evaluate the Compression Index of Tehran Clay, AUT J. Civil Eng., 3(1) (2019) 129-136.