The benefits
of being
late?
84
The benefits of being late? – An empirical analysis on the
validity of the concept of "Advantages of Backwardness"
Mariam Dehghan Mobaraki
11.
Introduction
In recent years controversial ideas in alternate economic literature have developed, suggesting that the initial state of underdeveloped nations can act as an advantageous position for future economic growth. In 1962 Gerschenkron was the first to present this highly disputable theory, which undermines the previous train of thought led by Rostow’s stages of economic growth. The emphasis of Gerschenkron in his work “Economic Backwardness in Historical Perspective: A book of Essays” is to overthrow the idea of a single correct approach to economic growth. “[He] understood the development of backward countries as a contextual process that varied from county to country depending on which perquisites are present or absent” (Alston & Mueller, 2016). Therefore, according to Gerschenkron, the industrialization process in a backward country is substantially different in terms of speed and nature compared to advanced countries (Chandrasekhar, 2005). This new model on the future growth of less developed countries reflects contemporary relevance and provokes an empirical study in order to examine the validity of this established economic theory, called “advantages of backwardness”.
According to Weede (2007), the advanced economies carry the financial burden of innovative technology, business models and marketing procedures while less developed economies can replicate these innovations without research and development (R&D) costs. In Weede´s words, “Imitation may be easier and faster than innovation, on which the leading economies have to rely” (Weede, 2007). This accelerated way of increasing productivity and facilitating economic growth is based on the initial situation of “backwardness”. This line of reasoning is of special relevance in today´s globalized world. The forces of globalization penetrate the aforementioned process through faster communication and
1 Mariam Dehghan Mobaraki received a bachelor degree in International Economic Studies at Maastricht
University in 2016. Currently she works at the EU Delegation to the United Nations in Geneva in the field of Migration and Development. Contact: [email protected]
ABSTRACT
85
Marble
Research
Papers
economies opened up to the international market. In the following, the “process of globalization” is not defined as a general force in history, such as the establishment of silk trade routes, but rather as a new
process, which started in the end of the 20th century. This research emphasizes the path of development
of low-income countries in the past three decades and aims to provide an answer to this main research question:
In which scenarios is the concept of advantages of backwardness applicable?
First a literature review is provided. Second, the terminology of economic development is clarified. Third, the methodology of the conducted empirical analysis is explained and its results are interpreted. Fourth, the validity of the proposed theories is evaluated. Finally, a discussion of this study and a conclusion follows.
2.
Literature review
The influence of underdevelopment on economic growth is considered in an open-economy setting. Consequently, the proposed analysis of this study is extended to include arguments in free-trade scenarios given the unceasing liberalization of financial, capital and labour markets. In the following, the important terminology is clarified and a brief overview of relevant economic models is given. Additionally, paradigms, which are essential to the study of development economics and are incorporated in Western culture and science, are exhibited. Finally, the relevance of this study and its contribution to existing literature is illustrated.
2.1.
The Solow framework
The benefits
of being
late?
86
2.2.
Export-led growth
The theory of export-led growth also proposes positive effects on economic growth based on an initial situation of underdevelopment. Resources, which previously have not been used in the most intensive or efficient way, for instance abandoned land or disguised labour, can be fully employed when engaging in international trade. Therefore, under the given assumption, a less developed country can reap benefits from its underdeveloped position or “backwardness” when engaging into trade (Perkins, Radelet, Lindauer, & Block, 2013).
2.3.
The Prebisch-Singer hypothesis
However, the literature also contains many theoretical arguments why advantages of backwardness are outweighted by “advantages of forwardness”, which identify further benefits for advanced economies (Harada, 2012). The Prebisch-Singer hypothesis contributes to this debate (United Nations Department of Economic Affairs, 1950; Singer, 1950). It states that the terms of trade of developing countries consistently deteriorate. According to this theory, low income countries dominantly export primary products, which prices that do not rise as quickly as the prices of manufactured goods that are imported. Thus, these countries need to produce more primary goods in exchange for the same amount of import goods as time passes. This puts developing countries in a disadvantaged position and reinforces their deprived state of development. Additionally, the current world trading system based on negotiations within the WTO framework consistently represents the interest of the economies with the highest trading volumes, thus, the industrialised economies (Hopper, 2012).
2.4.
Limited advantages of backwardness
87
Marble
Research
Papers
2.5.
Paradigms present in economic theory and research question development
As one element of this study, the paradigms encompassed by the advanced countries are elaborated. In general, paradigms are patterns, stereotypical examples, models, or general conceptual frameworks within which theories in a particular area of research are constructed (Colman, 2015). In academia, it is often the case that established theories and models are presented as a fact and contribute to the knowledge of science. The aim is to set aside a major paradigm of development economics per se. It is widely accepted as a fact that economic growth indicates development. Sometimes this is even used as the defining measure of development. This particular approach is subject to framing in the western culture. The terminology of “developed and developing” countries contributes to some presence of haughtiness since these terms imply the superiority of the state of development of high-income countries. The science of development economics is very much based on neoliberalism and presents capitalism, free markets and mass consumptions as the aim to strive for. But this lifestyle also entails much new harm, such as global warming, obesity and the destruction of a culture which is in harmony with nature. The idea is that it is due to these paradigms that the common believe of advanced economies is that development is identical to economic growth.
An alternative definition of development utilized in this research study follows from Nobel Prize winner Amartya Sen. He defines economic development as a combination of three concepts, namely political freedom, freedom of opportunity and economic protection from abject poverty (Sen, 2000). Therefore, economic growth is a simplistic approach to assess the stage of development of a country and is only used as an additional measure in this study. Therefore, the “Development as Freedom” (“DF”) index is constructed to uniquely assess the stage of development of an individual country. It includes measures of political rights and civil liberties as well as poverty gap estimates and human capital formation. This research provides a critical overview of existing and opposing views with regards to advantages of backwardness. However, most frameworks define development rather narrowly and miss to include other factors that are highly relevant to the path of development of a country. Based on the literature review, more specific research questions are formulated.
1) How are advantages of backwardness slowed down or excelled by individual country characteristics and institutional factors?
2) How is the concept of limited advantages of backwardness more appropriate to real-life conditions than the original theory?
Several variables are considered in this study such that it leads to identifying conditional factors for either path of development. With this approach the theory of limited advantages of backwardness can be explicitly tested. A statistical analysis is employed to test which of the existing theories can be supported best by empirical evidence.
3.
Empirical research study
3.1.
Economic growth vs. economic development
The benefits
of being
late?
88
Liberties are measured on a one-to-seven scale, with one representing the highest degree of Freedom and seven the lowest. The Poverty gap at $1.90 a day (2011 PPP) is utilized as the second dimension of the “DF”- index. It indicates the mean shortfall in income or consumption from the poverty line $1.90 a day expressed as a percentage of the poverty line. The information on the poverty gap on most nations is provided by the World Data Bank. The third dimension measures the net enrolment rate into primary education, thus, the ratio of children of official school age, who are enrolled in primary schools to the population of the corresponding official school age. These figures are also provided by the World Data Bank. While a higher score entails a positive interpretation of the net enrolment rate measures, a lower value of the political rights, civil liberties and poverty gap is strived for. Because of this, the standardized values are not simply added up but the standardized measures of the sum of the poverty gap, political rights and civil liberties are subtracted from the net enrolment rate standardized measures. No weights are given to either dimension of the index, such that a geometrical average is the result. The paradigm in development economics, exhibited in the previous literature review, can be empirically falsified under the assumption that the “DF”-index truly depicts economic development. The “DF”-index can be correlated with a conventional measure of growth, namely percentage of GDP growth. This simple statistical tool reveals a value of -0,017 for the correlation value. A plot of the two measures also did not reveal any non-linear relationship. This backs the initially presented argument that economic growth and economic development are two distinct concepts and shall not be used interchangeably. In the following empirical research, the “DF”-index composed of the three aforementioned dimensions is used as the primary measure of the state or progress of development.
3.2.
Data and Methodology
The empirical research of this work is based on the following regression equation, which uses several cross-sectional datasets.
Equation 1:
∆𝐷𝐹∆5𝑦= 𝛼0+ 𝜶𝟏𝐷𝐹1990+ 𝛼2𝑔𝑙𝑜𝑏𝑎𝑙̅̅̅̅̅̅̅̅̅5𝑦+ 𝜶𝟑𝑔𝑙𝑜𝑏𝑎𝑙̅̅̅̅̅̅̅̅̅5𝑦∗ 𝐷𝐹1990+ 𝛼4ℎ𝑐𝑎𝑝̅̅̅̅̅̅̅5𝑦+ 𝜶𝟓̅̅̅̅̅̅̅ℎ𝑐𝑎𝑝5𝑦∗ 𝐷𝐹1990 + 𝛼6𝑏𝑢𝑟𝑒𝑎𝑢𝑐̅̅̅̅̅̅̅̅̅̅̅5𝑦+
𝜶𝟕𝑏𝑢𝑟𝑒𝑎𝑢𝑐̅̅̅̅̅̅̅̅̅̅̅5𝑦∗ 𝐷𝐹1990+ +𝛼8𝑑𝑒𝑚𝑜𝑐̅̅̅̅̅̅̅̅̅5𝑦+ 𝜶𝟗𝑑𝑒𝑚𝑜𝑐̅̅̅̅̅̅̅̅̅5𝑦∗ 𝐷𝐹1990+ 𝜀𝑡
The change of the “DF”-index, which composition is already described above, resembles the economic development progress and constitutes the dependent variable of this equation. The subscripted
character ∆5𝑦 indicates that the “DF”-index is measured in percentage changes in five-year intervals
starting from 1990. The level of the “DF”-index of 1990 constitutes an explanatory variable and is also part of the four interaction terms. The central idea is that the state of economic development in 1990 influences the progress rate in development in the following years. The year 1990 is specifically chosen because in this period the internet was publicly accessible for the first time (McPherson, 2009). This triggered the modernization process of the economic sector and revolutionized the ways of communication. Moreover, the world trade volume started to boom and gained in influence (United Nations, 2012). Both events show that the year 1990 was decisive and triggered the globalization process worldwide.
89
Marble
Research
Papers
backwardness can only exist in the presence of globalization or, more specifically, the countries involvement into the globalization process. The basic idea of the theory is that less developed countries can learn and prosper from technologies and knowledge produced in another, more developed nation. The accessibility to this knowledge requires a degree of openness to the global order. Therefore, the variable “g𝑙𝑜𝑏𝑎𝑙” is included in the regression equation. The data used to estimate the degree of economic, social and political globalization is the KOF globalization index provided by the Swiss Federal Institute of Technology in Zurich (ETHZ). The interaction term between “g𝑙𝑜𝑏𝑎𝑙” and the index level of 1990 are of great interest in this research. A significant negative value of 𝛼3, the coefficient of the
interaction term “𝑔𝑙𝑜𝑏𝑎𝑙𝑡∗ 𝐷𝐹1990”, implies a reverse impact of past development on future growth in
development, given a higher degree of globalization. The variable “𝑔𝑙𝑜𝑏𝑎𝑙” acts as a mediator variable. On the one hand it is possible to observe an impact of globalization on development, on the other hand past development in 1990 also impacts future development. However, this interaction term captures the combined accelerated effect of globalization and a low level of development in the past. This is in line with the theory of advantages of backwardness.
The remaining explanatory variables serve as tools to test the more restrictive theory of limited
advantages of backwardness. The variable “ℎ𝑐𝑎𝑝” measures the expenditure on education as a percentage of total government spending and is an estimate for the aggregate human capital within a nation. According to Weede, “[…] advantages are greater at moderate levels of backwardness, where the level of human capital formation permits the exploitation of the opportunities of backwardness”. A significantly negative coefficient of the interaction term “ℎ𝑐𝑎𝑝̅̅̅̅̅̅̅5𝑦∗ 𝐷𝐹1990”, 𝛼5, supports his argument.
The multivariable regression equation uses further variables such as “bureauc”, which indicates
bureaucratic quality, and “democ” representing democratic accountability. The data utilized to quantify
both variables is provided by the PRS group, a commercial provider on Political Risk Services. Generally, country characteristics, such as bureaucratic quality and democratic accountability have a direct impact on the economic growth as well as development of a country. However, the regression equation also
includes interaction terms of “bureauc” and “democ” with the “DF”-index of 1990. This way, it can be
measured, whether bureaucratic quality and democratic accountability enhance the effects of advantages of backwardness. While it is expected with high certainty that bureaucratic quality impacts
the progress of advantages of backwardness, such that 𝛼7 is negative and significant; the same cannot
be stated about democratic accountability. There are many examples of prospering developing countries in Asia, which have seemingly benefited from the global spread of technology to develop. This happened even though the democratic accountability is and was often not institutionalized (Page, 1994) . These examples suggest that democratic accountability might not be relevant for the development process, thus, 𝛼9 might turn out to be insignificant.
The benefits
of being
late?
90
Lanka, Swaziland, Thailand and Ukraine. These particular nations are selected as a representative sample from different continents, cultural and regime structures, such that the external validity of this research is greater. Another major criterion however has also been the data availability for the wide spectrum of variables, which are required for the impending analysis.
3.3.
Presenting and Interpreting Empirical Results
In the following the results of all four regression sets are analysed. A sound conclusion, however, can only be drawn from a repetitive pattern in all four regression tables and is discussed in the end.
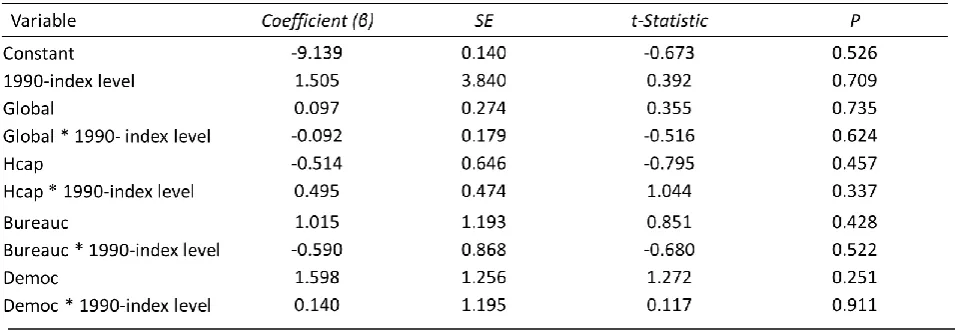
Table 1: Regression based on Equation 1 (1990-1995 period)
The first regression (Table 1), which uses the dataset from 1990 to 1995 for the twenty selected countries, reveals no significant coefficients. This first insight suggests no relationship between past index levels, thus state of developments, and the current development progress. Surprisingly, also the variables, that proxy progress of globalization, human capital accumulation, bureaucratic quality and democratic accountability, seem not to impact the DF index. A Wald test also establishes that these coefficients are also jointly insignificant with a p-value of 0.4466. Likewise, a joint significant test for the interaction terms does not reveal a significant result.
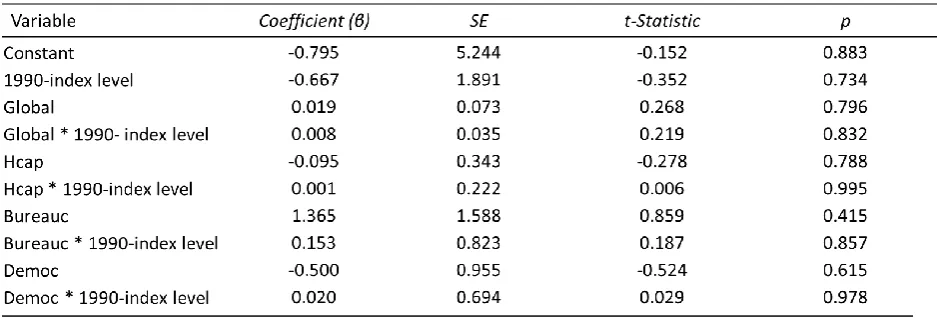
Table 2 resembles similar results for the period 1995 to 2000 as Table 2. The coefficients are not even marginally significant at the 10 percent alpha level. Again several Wald tests are computed to check for underlying joint significance. There has not been detected a joint significance for the variable group, globalization, human capital, bureaucratic quality and democratic stability, since the p-value is 0.7278. The value for the significance of all interaction terms is smaller (0.2882) but still leads to conclude that there is no joint significance of these terms. The coefficients of “bureauc” and “democ” together have also not proved to be significant in order to explain the development progress, even though this is what might have been assumed or even suggested by literature (Hopper, 2012). Thus, the second regression statistics do not support the idea of advantages or disadvantages of backwardness or even general assumptions which factors accelerate the path of development.
91
Marble
Research
Papers
Table 2: Regression based on Equation 1 (1995-2000 period)
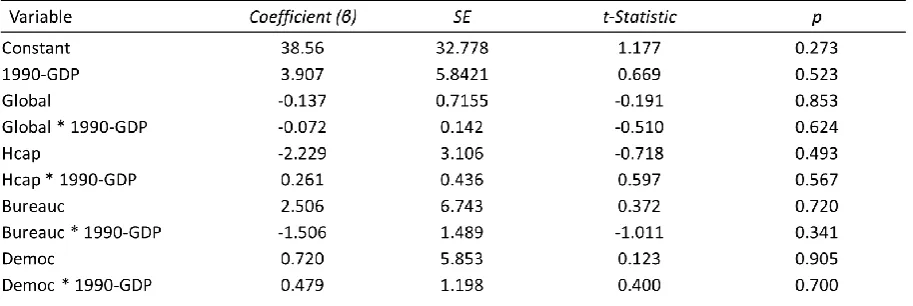
The third and fourth regressions from the periods 2000 to 2005 and 2005 and 2010 respectively provide similar results, presented in Table 3 and 4.
Table 3: Regression based on Equation 1 (2000-2005 period)
Table 4:Regression based on Equation 1 (2005-2010 period)
Adj. R² of 0.036; N= 17 (after adjustments)
Adj. R² of -0.338; N=18 (after adjustments)
The benefits
of being
late?
92
Testing different variable groups for joint significance does also not reveal any marginally significant insights. Therefore, it is concluded that the “Development as Freedom”-index from the year 1990 does not significantly impact the development progress of the following two decades. Since the research results based on the constructed DF-index did not show a repetitive pattern on a relationship of past states of development on current development progresses, the conventional GDP measure is used as an alternative proxy. Therefore equation 1 was slightly modified to equation 2.
Equation 2:
∆𝐺𝐷𝑃∆5𝑦= 𝛼0+ 𝜶𝟏𝑮𝑫𝑷𝟏𝟗𝟗𝟎+ 𝛼2𝑔𝑙𝑜𝑏𝑎𝑙̅̅̅̅̅̅̅̅̅5𝑦+ 𝜶𝟑𝑔𝑙𝑜𝑏𝑎𝑙̅̅̅̅̅̅̅̅̅5𝑦∗ 𝐺𝐷𝑃1990+ 𝛼4ℎ𝑐𝑎𝑝̅̅̅̅̅̅̅5𝑦+ 𝜶𝟓̅̅̅̅̅̅̅ℎ𝑐𝑎𝑝5𝑦∗ 𝐺𝐷𝑃1990 + 𝛼6𝑏𝑢𝑟𝑒𝑎𝑢𝑐̅̅̅̅̅̅̅̅̅̅̅5𝑦+
𝜶𝟕𝑏𝑢𝑟𝑒𝑎𝑢𝑐̅̅̅̅̅̅̅̅̅̅̅5𝑦∗ 𝐺𝐷𝑃1990+ +𝛼8𝑑𝑒𝑚𝑜𝑐̅̅̅̅̅̅̅̅̅5𝑦+ 𝜶𝟗𝑑𝑒𝑚𝑜𝑐̅̅̅̅̅̅̅̅̅5𝑦∗ 𝐺𝐷𝑃1990+ 𝜀𝑡
The above equation now includes the common GDP growth rate, which replaces the “DF”-index within the equation. The GDP growth measure focuses much more on economic growth rather than economic development, as was made aware previously. The following analysis is conducted with the awareness of present paradigms in macroeconomic research. Nonetheless, economic growth is a crucial part of the development process. An advantage of this measure is its much simpler way to obtain the required information for a broad range of countries.
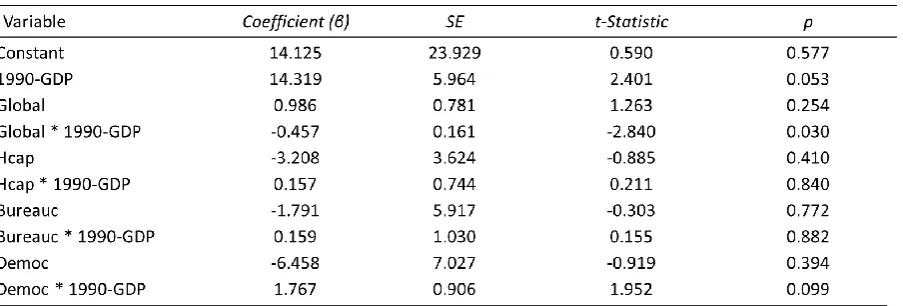
Table 5:Regression based on Equation 2 (1990-1995 period)
The regression results based on data from the period 1990 to 1995 (Table 5), indicate several highly insignificant coefficients. Nevertheless, the “1990-GDP” coefficient of 14.319 is marginally significant on the 10% alpha level. This is crucial for any debate of the existence of a relationship between past and current GDP levels, thus, between advantages or disadvantages of backwardness. This sole number suggests a positive relation, hence, a reinforcing effect of economic growth. A one percent higher GDP growth rate in 1990 results in 14.319 percent higher GDP growth, all else equal. This stands in conflict with the fundamentals of the theory of advantages of backwardness. However, the coefficient of the interaction term “Global*1990-GDP” is highly significant at the 5% significance level and its sign is negative. This is evidence on the role of the globalization progress within the advantages of backwardness. A more globalized country experiences the echo of past GDP performance differently. A higher globalization rank slightly moderates the reinforcing effect of past GDP growth rates. This suggests that the disadvantaged position of a “backward” state in the past is actually reduced through
93
Marble
Research
Papers
the engagement in the globalization process. The mechanisms of globalization do not put a low-income
country in an advantageous position; it only reduces their disadvantaged position. The last significant
coefficient of the interaction variable “democ*1990-GDP” is 1.767. It indicates that a higher presence of democratic structure within in a society reinforces the disadvantages of backwardness or “advantages of forwardness”; i.e: higher past GDP growth leads to even higher current GDP growth within countries with a greater rank on democratic accountability, ceteris paribus. Thus, the democratic component reinforces, what was observed by the coefficient of “1990-GDP”.
Since a Wald-test reveals that all four interaction terms are jointly significant at the 10 percent alpha level with a p-value of 0.0925, the coefficients of the variables “hcap*1990-GDP” and “bureauc*1990-GDP” can also be taken into account in this analysis. Both coefficients are positive, 0.157 and 0.159, respectively. Thus, human capital and bureaucratic quality act as a positive and reinforcing channel. The higher the amount of human capital and/or the higher the rank in bureaucratic quality of a country, the higher is the positive impact of the 1990 GDP growth on subsequent GDP growth. A one percent increase in educational expenditure as a percentage of GDP increases the impact of 1990-GDP growth on GDP growth in 1990 to 1995 by 0.157 percent, all else equal. Similarly, a country being ranked higher by one in bureaucratic quality on a scale from one to seven, experiences a 0.159 percent higher impact of 1990-GDP growth on GDP growth in 1990 to 1995 by 0.157 percent, all else equal.
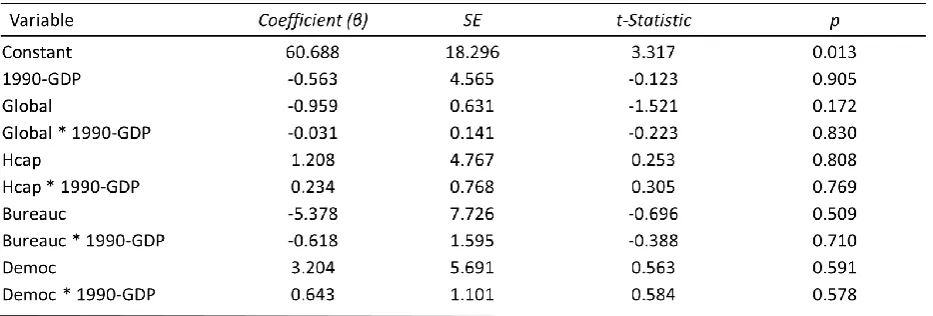
Table 6:Regression based on Equation 2 (1995-2000 period)
The regression statistics for the period 1995 to 2000 are displayed in Table 6. The coefficients of all regressors are found highly insignificant within this dataset. A Wald test of the group of interaction variables did also not show any joint significance. Therefore, no conclusions can be drawn to whether past GDP growth from 1990 directly or indirectly impacts growth rates of the period 1995 to 2000. There is no indication for either “advantages or disadvantages of backwardness”.
The benefits
of being
late?
94
Table 7: Regression based on Equation 2 (2000-2005 period)
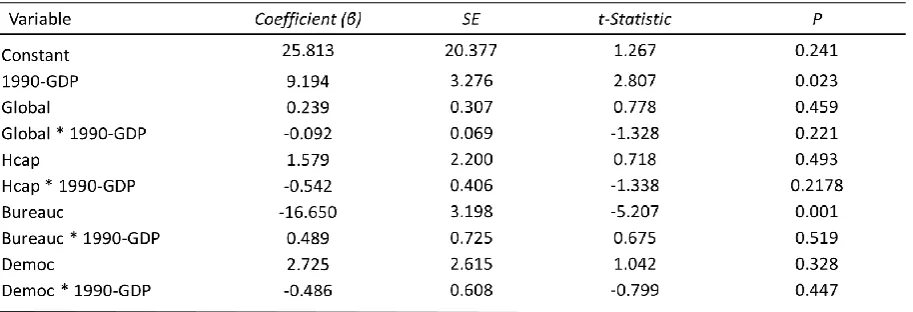
The results in Table 7 are based on the dataset 2000 to 2005. The highly significant coefficient of “1990-GDP” is again positive, 9.194. This is similar to what was observed in Table 5 (14.319). It suggests that high GDP growth in 1990 is reinforced in the GDP growth rates within the 2000 to 2005 period and state the opposite of what is suggested by the idea of “advantages of backwardness”. A one percent higher GDP growth in 1990 results in 9.194 percent higher GDP growth in the period 2000 to 2005, all else equal. The four interaction terms a jointly significant at the 10 percent alpha level with a p-value of 0.0925. The negative sign of the “Global*1990-GDP” coefficient again is explained the same way as in the GDP regression of 1995 (Table 5). It implies that the more globalized a country is, the smaller the impact of the 1990GDP growth on current GDP growth. Even though the impact seems only small, -0.092, compared to the direct impact of the “1990-GDP” of 9.194, one needs to consider the scale of the variable “global”. The index used to account for the engagement into globalization is the KOF-index. The highest rated country in 2012 was Ireland with 91.3 index points, while Solomon Islands was the least globalized nation in 2012 with an index of 25.26. This illustrates the wide scale of the KOF-index and therefore explains the seemingly small coefficient of “global*1990-GDP”. The coefficient of “hcap*1990-GDP” is also negative, -0.542. Thus, a higher human capital accumulation diminishes the observed disadvantages from lower past GDP levels. A one percent increase in the education expenditure as percentage of GDP reduces the reinforcing impact of the 1990-GDP level on the GDP growth in the period from 2000 to 2005 by -0.542 percent. The coefficient of “bureauc*1990-GDP” is 0.489, thus, much higher than in the previous regressions. A better rank by one on the scale of bureaucratic quality results in a 0.489 percent higher impact of 1990 growth in GDP on growth during 2000 to 2005. The effect of a higher rank on the scale of democratic accountability is more controversial. It reduces the impact of 1990-growth rates on current GDP growth by 0.486 percent. Higher democratic accountability counteracts the reinforcing “advantages of forwardness”.
95
Marble
Research
Papers
Table 8:Regression based on Equation 2 (2005-2010 period)
The regression based on the dataset of the period 2005 to 2010 does not reveal any significant results, as can be observed above in Table 8. Testing for joint significance does also not reveal any further insights. Thus, there is again no empirical evidence found for the existence of any echoing effects of past GDP growth or any other factors that channel the (dis-) advantages of backwardness.
3.4.
Evaluation of (limited) advantages of backwardness
Overall, there has been slight evidence that points to a situation of “disadvantages of backwardness”. The analysis based on the constructed index did not lead to any conclusive outcomes. Therefore, advantages or disadvantages of backwardness seem not to hold with the analysis based on the alternative interpretation of “Development as Freedom”. “Backwardness”, might merely be a simplistic idea of small, negative or non-existent economic growth. Hence, the second set of regressions has used GDP levels and GDP growth instead of the “DF”- index measures. These regressions resulted in rather more significant findings. There has been some evidence for a contrary impact of GDP growth on growth in later periods. The data from years 1990 to 1995 and 2000 to 2005 indicate that former success in economic growth implies greater GDP growth rates later on. This is magnified by larger bureaucratic quality. Higher human capital accumulations as well as more globalized nations seem to counteract this disadvantageous situation for low-income countries. The role of democratic accountability is uncertain. While data from the year 1990 to 1995 show a reinforcing impact of higher democratic accountability, the contrary is the case for the period 2000 to 2005. However, there was no strong pattern visible through all statistical analysis. The regression for the years 1995 to 2000 and 2005 to 2010 have not revealed any relation between past and current GDP growth. Therefore, no obvious conclusions can be reached. However, it is noteworthy that quite the opposite of benefits for low-income countries has been found. Consequently, the idea which was introduced in the very beginning:
“being underdeveloped is an advantageous position for economic growth”
cannot be empirically supported by this research study. The discussion about “limited advantages of backwardness” might appear more adequate in this context. There has been some evidence that a large human capital accumulation can outweigh the disadvantageous positon of low-income countries. A rough
The benefits
of being
late?
96
estimate based on regression results in Table 7, show that a country would be required to spent around 17 percent of its GDP on educational expenditures to counteract the “disadvantages of backwardness”. This is a very high portion of the domestic product. The average of the countries included in this study was only 4.85 percent in the period 2005 to 2010. Even a highly industrialized country such as Denmark only spent 8.55 percent of its GDP on educational expenditures in 2011. Thus, a share, as high as 17 percent, does not seem attainable. One can barely speak of a moderate level of education. Since the theory of limited advantages of backwardness is based upon this idea, this research has not exposed any evidence to support it.
4.
Limitations
There are some limitations to the findings of the study. For once, a better access to more precise data of the poverty gap, the gross intake ratio in the schooling sector and the state of globalization, can certainly improve the accuracy of this study. In particular, missing data for several years needed to be estimated based on consecutive and past data. Moreover, the constructed index to measure the development of a country in an alternate way can be advanced further. A simple geometrical average was used, thus, not ranking the importance of one development dimension over another. More generally, the previous empirical analysis based on several cross-sectional data sets can be replicated with a larger set of countries. This will increase the external validity of the research.
5.
Discussion and Conclusion
In the beginning the difference between economic development and economic growth has been established. Based on these findings a more complex model was employed. In this research study two approaches were made to assess the validity of the claim of advantages to backwardness. For once the development index based on the national poverty gap, the gross intake ratio for primary schooling and measures of political rights and social liberties is utilized. Additionally, several variables serve to control for external effects that can impact the speed of development. Due to missing significant results, an alternative model based on the GDP growth rates was used, which replaced the “DF”-index from the regression equation. Based on this model, factors that slow down and accelerate economic development have been identified.
97
Marble
Research
Papers
place in the past decades, most commonly known in Asia. Strategic investments into human capital formations as well as a further engagement into the globalization process are required to counteract the “disadvantages of backwardness”.
Regardless of what was found significant within this study, a certain level of education is necessary to make use of the newest technology provided through globalization. A stable governmental environment and political freedom also contribute to the economic development. As a result, there is no mystic solution to the issue of underdevelopment but generally accepted and mostly challenging to implement guidelines. A vital concept implication for the reader of this research study is that economic development was shown to be multi-faceted and not limited to economic growth. Hence, future research can pick up upon this innovative approach and advance this idea, so that the scope of development economics is broadened.
References
Alston, L., & Mueller, B. (2016). Economic Backwardness and Catching Up: Brazilian Agriculture, 1964-2014. (N. B. Research, Ed.) p. Working paper 21988.
Chandrasekhar, C. P. (2005). Alexander Gerschenkron and Late Industrilization. In K. Jomo, The
Pioneers of Development Economics: Great Economist on Development. New Delhi: Tulika Books.
Colman, A. M. (2015). A Dictionary of Psychology. New York: Oxford University Press.
Harada, T. (2012). Advantages of backwardness and forwardness with shifting comparative advantage. ElSevier, pp. 72-81.
Hopper, P. (2012). Understanding Development. Cambridge: Polity Press.
McPherson, S. S. (2009). Tim Berners-Lee: Inventor of the World Wide Web. Minneapolis: Twenty-First Century Books.
Nolan, P. D., & Lenski, G. (1985). Technoeconomic Heritage, Patterns of Development, and the Advantage of Backwardness. Social Forces.
Page, J. (1994). The East Asian Miracle: Four Lessons for Development Policy. In e. Stanley Fischer and Julio J. Rotemberg, NBER Macroeconomics Annual 1994, Volume 9 (pp. 219 - 282). Cambridge: MIT Press.
Perkins, D. H., Radelet, S., Lindauer, D. L., & Block, S. A. (2013). Economics of Development. New York: Norton & Company, Inc.
Sen, A. K. (2000). Development as freedom. New York: Anchor Books.
Singer. (1950, May). U.S. foreign investments in underdeveloped areas. The American Economic
Review, pp. 473-485.
United Nations. (2012). www.dgff.unctad.org. Retrieved March 17, 2016, from
The benefits
of being
late?
98
United Nations Department of Economic Affairs. (1950). The Economic Development of Latin America
and its principal problems. New York: United Nations.
Weede, E. (2007, January 31). Economic Freedom and the Advantages of Backwardness. Washington