2015-5435/14/63-98-103
INTERNATIONAL JOURNAL OF OCCUPATIONAL HYGIENE Copyright © 2015 by Irnian Occupational Health Association (IOHA) IJOH 7: 98-104, 2015
ORIGINAL ARTICLE
Indoor and Outdoor Carbon Monoxide (CO) Concentrations at
Hospital Kitchens
MAHMOUD MOHAMMADYAN
1; BEHZAD HEIBATI
2; MARYAM MOSTAFAEE
3;
NARGES GHORBANI
4; ASADOLLAH MORADI DOOST
5; MEHRAN SHESH
BARADARAN
6*; RAHELEH AMIRI
71
Associated Professor, Health Sciences Research Center, Faculty of Health, Mazandaran University of Medical Sciences, Sari, Iran; 2Health Sciences Research Center, Faculty of Health, Mazandaran University of Medical Sciences, Sari, Iran; 3Department of Environmental Pollution, School of Environment and Energy, Science and
research branch, Islamic Azad University, Tehran, Iran; 4Department of Biostatistics, Faculty of Health, Mazandaran University of Medical Sciences, Sari, Iran; 5Department of Occupational Health Engineering,
Faculty of Health, Mazandaran University of Medical Sciences, Sari, Iran; 6Department of Environmental Engineering, School of Environment and Energy, Science and research branch, Islamic Azad University, Tehran, Iran; 7Department of Environmental Health Engineering, Faculty of Health, Urmia University of
Medical Sciences, Urmia, Iran
Received January 16, 2015; Revised May 16, 2015; Accepted June 10, 2015
This paper is available on-line at http://ijoh.tums.ac.ir
ABSTRACT
Carbon Monoxide (CO) poisoning is one of the most common causes of death in Iran. The present study investigated the indoor and outdoor CO concentrations at hospitals under the supervision of Mazandaran University of Medical Sciences in Sari, Iran.Indoor and outdoor measured CO were conducted over a period of one month during the 2012 winter season in 4 hospital kitchens using a direct measurement device specialized for CO. The average concentrations of CO gas through gas measuring stations were considered at three stations both in and out of the kitchens.The highest and the lowest average concentrations of outdoor CO in Fatemeh Zahra Hospital (about 2 ppm) and Zare Hospital (about 0.33 ppm) were measured respectively. Besides, the highest and the lowest average concentrations of indoor CO were detected in Imam Hospital (as 9.66 ppm) and BuAli Hospital (as7.66 ppm). The highest ratios of I/O (approximately 10 ppm) have been conducted between 8:00 and 9:00a.m. The lowest median concentrations of CO (approximately 8 ppm) between 11:00 and 12:00 a.m. have been measured. Concentrations of CO in all hospitals in this study were significant.This fact shows poorly ventilation of kitchen due to lack of ventilation design engineering.
KEYWORDS:
Carbon Monoxide (CO), Hospital, Kitchen, Iran
INTRODUCTION
Any substance in the air, which is harmful to the environment and human health,is named as air pollutant. Air pollutionis caused by the entrance
* Corresponding Author: Mehran Shesh Baradaran
Email: sheshbaradaran@farabi.tums.ac.ir
carbon-containing compounds; it forms when there is not enough oxygen to produce carbon dioxide (CO2), such as when a stove or an internal combustion engine in an enclosed space operates [5].
High concentrations of CO can cause physiological and pathological changes, and eventually death.CO combines with hemoglobin to produce carboxyhemoglobin, which usurps the space in hemoglobin that normally carries oxygen, but is ineffective for delivering oxygen to bodily tissues. CO concentrations of more than 750 ppm may convert 50% of the body's hemoglobin to carboxyhemoglobin.
A level of 50% carboxyhemoglobin may result in seizure, coma, and fatality [6]. CO poisoning causes fatigue, chest pain, depression, hallucinations, agitation, headache, confusion, dizziness and lightheadedness, nausea, vomiting, painless, drowsiness, loss of balance, impaired vision, memory impairment, difficulty walking, problems with coordination of the nervous system, convulsions, and eventually fainting [5-6] which are often the result of inadequate ventilation of the building with a direct relationship on concentration of CO [7-9]. Unfortunately, there is not any air pollution monitoring station in the Sari City and on the other hand, a large number of vehicles have to pass through narrow streets and corridors in the city center every day. Thus, the level of traffic flow in this city is high and traffic congestion might be often happened.
According to the results of previous air pollution studies in the Sari City [10-12] and other studies [9] in similar cities, the CO concentrations in the city center of Sari are likely to be high. Some studies were conducted in Sari City to determine the drivers' exposure to respirable particles in public transportation's and to measure PM10 concentrations in different areas of the Sari city [10-12]. The aim of this study was to evaluate the CO gas concentration inside and outside the hospital kitchens in Sari, the center of Mazandaran Province, northern Iran.
the level of respiratory individuals’standing height (150 cm above the ground level) for each indoor and outdoor monitoring. Measurements were carriedout every 5 min during a 4-hour shift working inside and outside the kitchen.Total numbers of measurementswere estimated using the factorial design formula.Based on this formula (factorial design) 576 samples were obtained. The data compared results from both inside and outside parts of the kitchen.
Number of Samples = Number of repetitions (12) × number of hospitals (4) × time (3) × Location (2) × number of days per week (2).
The concentration of CO in the environment was measured using a single calibrated gas detector SnsvrhMonitoxplus gas detector 5306 500, manufactured by Compur Company (from Germany). The detector works based on electrochemical mechanism and it is specialized for measuring CO gas. The device measures the CO concentrations from 0 ppm to 500ppm and with +2 ppm accuracy of measurement.
To analyze data, the Kolmogorov-Smirnov test was used to determine the normal distribution data. Then, one-sample t-test was usedto determine the average concentration of indoor and outdoor CO. To compare the groups, Variance analysis test (and the Tukey-test to compare binary) was used for normal distributed data and Kruskal-Wallis test was used for non-normal distributed data.
RESULTS
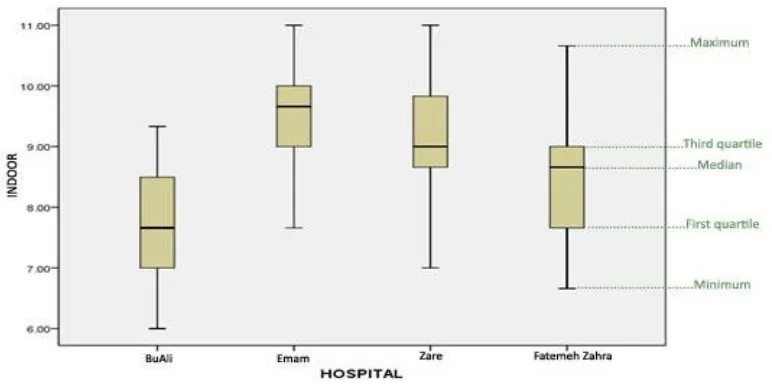
Indoor and Outdoor Carbon Monoxide … ijoh.tums.ac.ir | 100
Fig. 1. Indoor CO concentrations in 4 sample hospitals, Sari, Mazandaran, Iran
Figure2 shows the concentration of outdoor CO in each hospital as was separately done. It shows that the median amount of outdoor CO in Fatemeh Zahra Hospital was more than in other hospitals (2 ppm). At least 50% of the amount
of outdoor COin Fatima Hospital was more than 2ppm. The lowest median belongs to Zare Hospital (0.33 ppm). At least 50% of the amount of outdoor CO in Zare Hospital was more than 0.33 ppm (The points out of the boxes are outliers).
Fig 2. Outdoor CO concentrations in 4 sample hospitals, Sari, Mazandaran, Iran
Figure 3 shows the Input/output box plot for each hospital. It shows that I/O mean in Zare Hospital was more than that other hospitals (16.10 ppm). This means that at least 50% of the amount of I/O was more than 16.10 in Zare Hospital. Also, Fatemeh Zahra Hospital had the lowest median
Fig 3. Indoor/outdoor in sample hospitals, Sari, Mazandaran, Iran
Figure 4 shows changes in the indoor CO concentration trend at different times of a day. The highest median concentrations of CO have been measured from 8:00 to 9:00a.m.(10 ppm) and the lowest mean concentrations of CO have been measured between the hours of 11:00 to 12:00a.m.(8 ppm).Indoor CO, outdoor CO and I/O ratio were significantly different in the four sample hospitals (P<0.05).
Indoor and Outdoor Carbon Monoxide … ijoh.tums.ac.ir | 102
Fig. 4. Changes in trend of CO concentrations at different times of a day in different hospitals, Sari, Mazandaran, Iran
The Fisher test statistics was determined to be about 7.354 with a significant level of 0.001 (P<0.05). It showed a significant difference between the 1-hour measurements of CO concentrations in different hospitals. Post-hoc tests (Tukey-test) has shown a significant difference (P<0.05) between indoor measured CO in BuAli and Imam Hospitals, also in BuAli and Zare Hospitals. Fisher test analysis, variance analysis and Levene tests have shown significant difference among the average amounts of 1-hour measurement of outdoor COs in different hospitals. The most and the least amounts of outdoor 1hour measured CO as has been recorded in Fatemeh Zahra and Zare Hospitals were 2.19 and 0.26 respectively. Due to the Fisher statistics value of (173.858), the significant level determined was 0.0001 (P<0.05). There were significant differences between outdoor measured CO in hospitals two by two. The average
amount of 1hour indoor CO in Sari had no significant difference with the national standards of 9 ppm (Significant level=0.105>0.05). However, the average amount of 1 hour outdoor CO in Sari had a significant difference with national standards of 9 ppm (Significant level=0.001<0.05). A look at the figureshas revealed wide and negative confidence intervals withdistance from standard size.
DISCUSSION
The highest and lowest median amounts of outdoor CO have been recorded in Fatemeh Zahra and Zare Hospitals respectively. However, Fatemeh Zahra Hospital is located in a high traffic flow area in the city center thus it is likely to have a higher outdoor CO concentrations and lowest I/O ratio. On the other hand, Zare Hospital is located in a suburban area surrounded by woods, therefore the lowest outdoor CO concentrations and highest I/O ratio were found in this hospital.
Outdoor CO measurements have also shown that the amount of measured CO in hectic traffic was more than that in other places [16-17]. The highest median of CO concentration inside the kitchen was related to Imam Hospital. It is the biggest hospital in Sari City and therefore some factors such as long cooking time, lack of engineering designed ventilation system for cooking process, and high traffic flow on the road in proximity to this hospital may explain high indoor CO concentrations.
The ratio of I/O between 8:00 to 9:00 a.m. resulted the highest median. The high level of consumption of gas fuel for heating and boiling water to prepare rice and curries might be the main reason of high Indoor CO concentrations and a higher I/O ratio. However, the lowest median of I/O ratio has been calculated between the 11:00 to 12:00 a.m. The movement of people for jobs and schools, which emitted CO into the ambient air, may increase outdoor concentrations and end of cooking process in the kitchen may decrease indoor CO concentrations. Therefore, it resulted in the decrease of I/O ratio between the 11:00-12:00 a.m. The gradual increase in air temperature due to unstable weather conditions and increasing pollutants in the air also caused a reduction in I/O between the hours of 11:00 to 12:00 a.m. The ratio of I/O can be very different due to the factors such as measurement, design, construction, etc. One of the factors that plays a major part in air pollutants concentration is weather changes [16, 18].
CONCLUSION
The amount of indoor and outdoor CO in sample hospitals had no significant relationship
1. Myers RA, Linberg SE, Cowley RA. Carbon monoxide poisoning: the injury and its treatment. JACEP 1979; 8(11): 479-484. 2. Raub JA, Mathieu-Nolf M, Hampson NB, et
al. Carbon monoxide poisoning—a public health perspective. Toxicology 2000; 145(1):1-14.
3. Chaloulakou A, Mavroidis I, Duci A. Indoor and outdoor carbon monoxide concentration relationships at different microenvironments in the Athens area. Chemosphere 2003; 52(6):1007-1019.
4. Hsu D-J, Huang H-L. Concentrations of volatile organic compounds, carbon monoxide, carbon dioxide and particulate matter in buses on highways in Taiwan. Atmos Environ 2009; 43(36): 5723-5730. 5. Shokrzadeh M, Poorhosein M, Nasrabadi NN,
et al. Epidemiologic study of mortality rate from carbon monoxide poisoning recorded in Mazandaran department of forensic medicine, 2009-2011. J Mazandaran Univ Med Sci 2013; 23(99): 86-95.
6. Rupert DJ, Poehlman JA, Damon SA, Williams PN. Risk and protective behaviours for residential carbon monoxide poisoning. Inj Prev 2013; 19(2): 119-123.
7. Jo W-K, Lee J-Y. Indoor and outdoor levels of respirable particulates (PM 10) and carbon monoxide (CO) in high-rise apartment buildings. Atmos Environ 2006; 40(32): 6067-6076.
8. Hampson NB, Norkool DM. Carbon monoxide poisoning in children riding in the back of pickup trucks. Jama 1992; 267(4): 538-540.
9. Moini L, Fani A, Eshrati B, Talaei A. Effect of concentration of air pollutants (PM10, O3 and H2S) on lung capacity in the cities Arak and Khomain, Iran. Feyz J Kashan Univ Med Sci 2010; 13(4): 285-293.
10. Mohammadyan M, Alizadeh A,
Mohammadpour R. Personal exposure to PM10 among bus drivers in Sari, Iran. Indoor Built Environ 2009; 18(1):83-89.
Indoor and Outdoor Carbon Monoxide … ijoh.tums.ac.ir | 104
S. Personal exposure to PM10 among taxi drivers in Iran. I Indoor Built Environ 2010; 19(5): 538-545.
12. Mohammadyan M, Sojodi L, Etemadinejad S. Survey of concentrations of PM2.5 indoor and outdoor of shops in Sari city center. J Mazand Univ Med Sci 2011; 21(84): 72-79.
13. ACGIH R. TLVs and BEIs. Cincinnati, Ohio: ACGIH; 2008.
14. ICRCOEL. Occupational Exposure Limits 3rd
edition, Environment Institute, Tehran,
Iran,2012.
15. Ghasemkhani M, Naseri F. Comparison of indoor air quality in restaurant kitchens in Tehran with ambient air quality.JEHSE 2008; 5(1): 59-64.
16. Dehghanzadeh R, Ansarian K, Aslani H. Concentrations of Carbon Monoxide in Indoor and Outdoor Air of Residential Buildings. J Health 2013; 3(4): 29-40.
17. Lawrence A, Masih A, Taneja A. Indoor/outdoor relationships of carbon monoxide and oxides of nitrogen in domestic homes with roadside, urban and rural locations in a central Indian region. Indoor Air 2005; 15(2): 76-82.
18. Chan AT. Indoor–outdoor relationships of particulate matter and nitrogen oxides under different outdoor meteorological conditions. Atmos Environ 2002; 36(9): 1543-1551.