Please cite this article in press as: Mahmudimanesh M, Bahrampour A, Akbari-Sharak N, Farahmandinia Z. Modeling and trend analysis
J Biostat Epidemiol. 2016; 2(3): 152-7.
Original Article
Modeling and trend analysis of leukemia in children using time series methods
Marzieh Mahmudimanesh1, Abbas Bahrampour2*, Nooshin Akbari-Sharak3, Zahra Farahmandinia4
1
Department of Epidemiology and Biostatistics, School of Public Health, Kerman University of Medical Sciences, Kerman, Iran
2
Department of Epidemiology and Biostatistics, School of Public Health, Research Center for Modeling and Health, Institute for Futures Studies in Health, Kerman University of Medical Sciences, Kerman, Iran
3
Department of Epidemiology and Biostatistics, School of Public Health, Tehran University of Medical Sciences, Tehran, Iran
4
Department of Pediatrics, Afzalipour School of Medicine, Kerman University of Medical Sciences, Kerman, Iran
ARTICLE INFO ABSTRACT
Received 21.03.2016 Revised 26.05.2016 Accepted 08.07.2016 Published 27.08.2016
Background & Aim: Time series analysis is used to detect a model and predict the future amounts of the series, which is based on previous data. One of the commonly used models in time series is autoregressive integrated moving average (ARIMA) model. 30% of diseases in children are acute leukemia, out of which acute lymphoblastic leukemia (ALL) and acute myeloid leukemia (AML) consist 97% of acute leukemia types. In this study which is a modeling study, the ARIMA time series model is fitted on the acute leukemia cancer in children and the best model is selected. Methods & Materials: This study which is related to the children with cancer ALL and AML, and includes age groups from 1 year old to 15 years old, the ARIMA time series model is fitted on these data, and the best model is selected based on the Akaike information criteria. Trend analysis was also conducted based on the criteria R2 and mean squared error, mean absolute deviation, and mean absolute percentage error were considered as the best equations for the series.
Results: ARIMA models are investigated, and the best model is selected and also it was shown that the procedure of catching blood cancer has been increasingly from 82 to 88 and then decreasingly but it may get an increasing procedure in the future. Furthermore, the procedure was shown in two sexual groups and it was observed that catching blood cancer had a decreasing procedure in men and had an increasing procedure in women and appropriate ARIMA model was also determined for each group. Conclusion: According to the forecasts for the next 10 years, the incidence of this cancer will be increasing in the future. There was an increasing trend for female group and a downward trend for male group.
Key words: Time series;
Auto regressive integrated moving average; Trend analysis; leukemia; Acute lymphoblastic leukemia;
Acute myeloid leukemia
Introduction
1Although, after heart attacks and accidents and natural phenomena, cancer is the third leading cause of death in Iran, it is considered a deadly disease among children < 15 years. Therefore, it is better to run the specific analysis
* Corresponding Author: Abbas Bahrampour, Postal Address: Department of Epidemiology and Biostatistics, School of Public Health, Research Center for Modeling and Health, Institute for Futures Studies in Health, Kerman University of Medical Sciences, Kerman, Iran. Email: [email protected]
for this age group separately (1).
and acute lymphoblastic leukemia (ALL) as well as into two chronic categories: chronic myeloid leukemia and chronic lymphoblastic leukemia.
Around 30% of diseases in children are acute leukemia, out of which ALL and AML consist 97% of acute leukemia types (4).
In Japan and Italy, the leukemia is strikingly different for age groups. Mortality rates in age groups below 50 years have dropped since 1970 in both males and females. And for the elderly, mortality rates from cancer in men have increased, especially during 1960-2000.
In France, Italy, Britain, the United States of America and Great Britain, after 4 decades, the mortality rate is uniform regardless of age and gender. Mortality regarding the birth year, for all these countries, shows a similar trend for men and women. In Japan, the mortality for those born between 1880 and 1920 has risen sharply; however, in groups who were born after 1930, a decreasing trend has been observed for both males and females. In France, Italy and the United Kingdom, the mortality trends have increased until 1990 and then gradually decreased. For men and women in the United States of America, the process for people who were born after 1900 is almost unchanged (5).
Approximately, 30,800 people with blood cancer are annually diagnosed in the United States and 21,700 of whom die. Although the overall incidence of leukemia in the United States has dropped, recent reports show that this incidence may increase for a certain age and ethnic groups so that the overall rate of leukemia incidence for children below 20 years has significantly increased. In both ALL and AML groups while comparing two 10-year periods 1974-1983 and 1984-1993, there was a 15% increase in 5-year residuals (6). Blood cancer ranks first among death leading cancers of children and adolescents in Latin America during 1980-2004. Percentage of global changes in both genders in Colombia, Ecuador, and Mexico, in particular, has increased; however, this increase was only observed among women in Uruguay and a downward trend was also observed in both genders in Argentina. However, this increase is only for men in Costa Rica, and no major changes have been observed
in other countries (7).
In a study conducted in Hungary over 1988-2000, the auto regressive integrated moving average (ARIMA) model was used to predict leukemia mortality rate and first-order autoregressive (AR) was selected after investigating autocorrelation and partial autocorrelation functions (8).
In Korea during 1983-2000, time series were used to predict mortality for all types of cancers and an increasing trend was observed, and there were 5-year predictions (9).
In another study conducted in Iran during 1995-2004, leukemia death rates have increased from 0.79 to 6.45 per 100,000 persons. In addition, leukemia mortality was higher among men than women. In male population, mortality rate has increased from 0.9 (in 1995) to 0.74 (in 2004) per 100,000 persons. This rate increased from 0.67 to 5.38 for women over recent years. Increasing mortality rate is shown among children below 15 years old. In general, this study shows increased leukemia mortality rate in Iran (10).
Based on the literature, determining trends for this disease would help us to better manage leukemia cancer and to provide better health care in the future. This process can represent the importance of this disease and provide appropriate information for people who are at risk of cancer.
Methods
A time series refers to a set of statistical data collected at regular and equal intervals.
Statistical methods used for the analysis of such data are called time series analysis. Time series analysis is used to detect a model and predict the future amounts of the series, which is based on previous data. Time series has four components: Long-run trend, cyclical changes, seasonal fluctuations, and irregular changes (11, 12).
A time series can be composed of one or more of these components. The behavior of time-series is perceived as time series modeling and it consists of three stages of primary diagnosis, estimation of the detected model parameters and the occasion investigation.
Stationary time series lacks shift or period process. This is when the parameters such as the model mean and variance remain constant over time; otherwise, they are non-stationary.
Stationary series are divided into three types of processes: AR, moving average (MA), and ARMA.
In practice, most of the time series are non-stationary. If the time series of observations compared to the mean is non-stationary, the series can be made differential. A stationary series necessarily is not stationary in variance. One-way to identify non-stationary in variance is to use statistical tests such as Bartlett’s test. To stabilize the variance in the data over time, Box-Cox transformation can be used.
In cases where there is a non-stationary series, the combined MA and AR-MA are used.
Consider this series: Zt, Zt−1, Zt−2,…
For simplicity, it is assumed that the mean of Zt is zero.
Consider at, at−1, at−2,… as a sequence of uncorrelated random variables with the mean zero and variance σ2
. ARIMA (p, q) model can be shown as follows:
Zt = φ1Zt−1 +⋯+ φp Zt−p + at + θ1 at−1 +⋯+ θq at−q
Where, p is the order of AR and q is the order of moving mean (11).
Time series models are diverse uses in medical science such as anticipating the number of patients in the future, predicting mortality rate in the next few years and so on.
In this study which is a modeling study, the ARIMA time series model is fitted, and the best model is selected based on the Akaike information criterion criteria. Trend analysis was also conducted based on the criteria R2 and mean squared error, mean absolute deviation (MAD), and mean absolute percentage error (MAPE) were considered as the best equations for the series.
Information required to conduct the study was relevant to children with ALL and AML leukemia. They belonged to age groups of below one to 15 years old. All information was obtained through investigating records and recording required information of medical files which were extracted from medical
documents and archive of Afzalipour Hospital in Kerman.
To analyze the data, Microsoft Excel 2013, MINITAB 17 (Minitab 17 Statistical Software (2010); Minitab Inc., State College, PA) and R version 3.0.3 software (R Foundation for Statistical Computing, Vienna, Austria) were used.
Results
There were 259 diagnosed patients with blood cancers over 2003-2013, out of whom there were 220 patients with ALL and 39 patients with AML, 162 males and 97 females. The age mean was 6 years with a standard deviation 4.01. This age group was subdivided into three groups: 21.2% of children below 1-2 years, 53.7% in the age group of 3-9 years, and 25.1% between 10 and 15 years. Among these participants, there was 27.4% with blood group A and 32.4% with blood Type B, 6.6% with blood group O and 33.6% with blood group AB. The number of affected patients was determined for 132 months (from April 2003 to 2013). For better analysis and conclusion, these 2 months were mixed and a total of 66 times were investigated for each series.
All data were considered with shift one to have the exponential analysis. Furthermore, for data adjustment in terms of population, the number of patients in each year was divided by the population in the same year and a time series model is fitted for the new data.
According to census results obtained from the Department of Statistics and Information in Management and Planning Organization of Kerman province, the population in 1996 was equal to 2,004,328 with average annual growth of 2.81%. In 2006, the population was equal to 2,652,413, with average annual growth of 2.07%. This was 2,938,988 in 2011.
After drawing the time series graph, the Bartlett’s test was used to examine the stability of the variance and the P value for this test is equal to 0.129. Therefore, this series is stationary.
Table 1. Examination of the precision of the linear, exponential, and quadratic trends with three criteria
Trend MSD MAD MAPE
Linear 0.65 0.62 48.6
Quadratic 0.51 0.52 33.01
Exponential 0.72 0.65 44.77
MSD: Mean squared deviation; MAD: Mean absolute deviation; MAPE: Mean absolute percentage error
As it can be seen, the Grade 2 is better than the other because it has lower values of MAPE, MAD, and mean standard deviation.
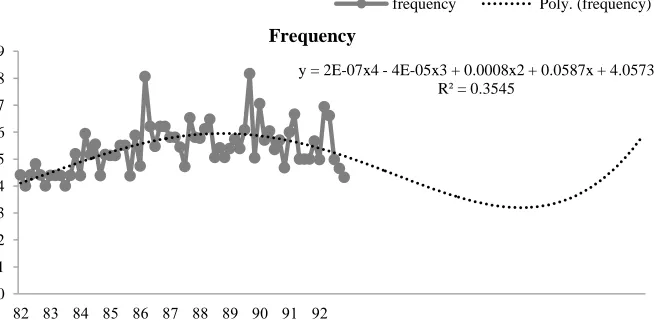
To examine trends with higher trends, the Excel software was used and finally Grade 4 models with R2 = 0.35 a are of better fit than other models (Figure 1) and its linear equation is as follows:
y = 0.0000002x4 − 0.00004x3 + 0.0008x2 + 0.0587x + 4.0573
According to figure 1, the process of leukemia in this study was the first upside and then downside. According to the forecasts for the next 10 years, the incidence of this cancer will be increasing in the future.
Using the R software of ARIMA models, data can be fitted as shown in the table 2.
Finally, the best model determined was the ARIMA (0, 1, 1) with the mathematical form
Zt = 0.014−0.826at−1.
Modeling and trend determination and forecasts were also performed separately for both genders. The stationary assumption of variance was denied for males. In female group,
the P value for the equality of variance was 0.001, and thus the series is non-stationary at variance. The Box-Cox transformation was used to remove non-stationary mode.
Table 2. Comparison of the prediction operation of the fitted ARIMA models
Time series model MSE BIC AIC
ARIMA (2,1,2) 0.6307 −0.14 0.69
ARIMA (0,1,0) 1.106 0.16 1.13
ARIMA (1,1,0) 0.7602 −0.14 0.79
ARIMA (0,1,1) 0.6406 −0.31 0.61
ARIMA (1,1,1) 0.6396 −0.25 0.64
ARIMA (0,1,2) 0.6395 −0.25 0.64
ARIMA (1,1,2) 0.6327 −0.2 0.66
ARIMA: Auto regressive integrated moving average; MSE: Mean squared error; BIC: Bayesian information criterion; AIC: Akaike information criterion
According to figures 2 and 3, children’s blood cancer decreased in male group and increased in female group. With regard to R2 for different trends, the best linear equation fitted to the series graph for these two genders was determined as follows in table 3.
Table 3. The best trend observed for each gender
Sex group Trend model R2
Male y=0.000009x3 − 0.0023x2 + 0.1415x + 3.4042
0.41 Female y=1E−09x6 – 2E−07x5 +
2E−05x4
– 0.0007x3 + 0.0132x2 – 0.0902x + 2.3183
0.149
Moreover, based on criteria previously mentioned, the best ARIMA model for each of the genders was specified and shown in table 4.
Figure 1. Forecast of the frequency of blood cancer for the next 10 years
y = 2E-07x4 - 4E-05x3 + 0.0008x2 + 0.0587x + 4.0573 R² = 0.3545
0 1 2 3 4 5 6 7 8 9
82 83 84 85 86 87 88 89 90 91 92
Frequency
Figure 2. Fitness of the best time series trend for men
Table 4. The best ARIMA model for each gender
Sex ARIMA AIC
Male ARIMA (0,1,1) 122.97
Female ARIMA (1,1,1) 37.85
ARIMA: Auto regressive integrated moving average; AIC: Akaike information criterion
Discussion
Modeling, trend analysis and forecasting time series data related to medicine and especially diseases can provide doctors and clinicians an overview of past, present, and future of a patient’s disease to make timely measures to control or reduce the morbidity and mortality rates.
In the United States during 1974-1983 and 1984-1993, the incidence of leukemia for a specific age group as well as for the diagnosis of
ALL has increased (6).
In Latin America, during 1980 and 2004, the percentage of global changes in both genders in Colombia, Ecuador and Mexico increased; however, this increase was only observed among females in Uruguay, and there was a declining trend for both genders in Argentina (7).
In Iran during 1995-2004, leukemia mortality was higher among men was than women. There was also an increasing mortality among children below 15 years (10).
In this study, according to the forecasts for the next ten years, the incidence of this cancer will be increasing in future and it is necessary to control the risk factors that affect the incidence of leukemia in children.
Figure 3. Fitness of the best time series trend for women
y = 9E-06x3 - 0.0023x2 + 0.1415x + 3.4042 R² = 0.4165
0 1 2 3 4 5 6 7 8 9
82 83 84 85 86 87 88 89 90 91 92
Male Male Poly. (Male)
y = 1E-09x6 - 2E-07x5 + 2E-05x4 - 0.0007x3 + 0.0132x2 - 0.0902x + 2.3183 R² = 0.1494
0 1 2 3 4 5 6 7 8 9
82 83 84 85 86 87 88 89 90 91 92
Further Recommendations: Factors affecting leukemia in children include pollution, diet, and exposure to the drug and infancy length. Therefore, it is suggested that the effect of these factors on the incidence of leukemia and modeling with the use of these factors are investigated in future studies.
Conclusion
In this study, time series modeling was performed for blood cancer data over 2003-2013. It was shown that the incidence of this cancer had increased until 2009 and then decreased. According to the forecasts for the next 10 years, the incidence of this cancer will be increasing in the future. There was an increasing trend for female group and a downward trend for female group.
Conflict of Interests
Authors have no conflict of interests.
Acknowledgments
The authors find it necessary to express their gratefulness and gratitude to the respected staff at the department of archives and medical documents at Afzalipour Hospital, Kerman, who kindly cooperated in examination and collection of the data concerning patients’ dossiers.
References
1. Mousavi SM, Pourfeizi A, Dastgiri S. Childhood cancer in Iran. J Pediatr Hematol Oncol 2010; 32(5): 376-82.
2. El-Mallawany NK, Frazer JK, Van Vlierberghe P, Ferrando AA, Perkins S, Lim M, et al. Pediatric T- and NK-cell lymphomas: new biologic insights and treatment strategies. Blood Cancer J 2012; 2(4): e65.
3. Bandyopadhyay R, Sinha SK, Chatterjee U,
Nag D, Mukhopadhyay S, Chowdhury SR, et al. Primary pediatric gastrointestinal lymphoma. Indian J Med Paediatr Oncol 2011; 32(2): 92-5.
4. Mehrvar A, Rahiminejad MS, Hedayati Asl AA, Tashvighi M, Faranoush M, Alebouyeh M, et al. Features of childhood acute myeloid leukemia in Iran: a report from double center study. Acta Med Iran 2015; 53(12): 749-52. 5. Xie Y, Davies SM, Xiang Y, Robison LL,
Ross JA. Trends in leukemia incidence and survival in the United States (1973-1998). Cancer 2003; 97(9): 2229-35.
6. Curado MP, Pontes T, Guerra-Yi ME, Cancela MC. Leukemia mortality trends among children, adolescents, and young adults in Latin America. Rev Panam Salud Publica 2011; 29(2): 96-102.
7. Imamura Y, Mizuno S. Comparison of leukemia mortality in five countries: France, Italy, Japan, UK and USA from the WHO Mortality Database (1960-2000). Jpn J Clin Oncol 2005; 35(7): 420-3.
8. Kis M. Time series models on analysing mortality rates and acute childhood lymphoid leukaemia. Proceedings of MIE2005: the 19th International Congress of the European Federation for Medical Informatics; 2005 Aug 28-31; Geneva, Switzerland.
9. Bae JM, Jung KW, Won YJ. Estimation of cancer deaths in Korea for the upcoming years. J Korean Med Sci 2002; 17(5): 611-5. 10. Fazeli Z, Pourhoseingholi MA, Vahedi M,
Abadi A, Fazeli Bavand-Pour FS, Baghestani AR. Leukemia cancer mortality trend in iran, from 1995 to 2004. Iran J Cancer Prev 2013; 6(3): 170-3.
11. Niroumand HA, Bozorgnia SA. Time series. Tehran, Iran: Payame Noor University Publications; 2006. [In Persian].