Iranian Journal of Economic Studies
Journal homepage: ijes.shirazu.ac.ir
The Effects of Iran's Reallocating its Oil and Gas Sales Revenues to Developing its Upstream Affairs
Fardin Farahnaka, Majid Maddaha, Abbas Shakerib
a. Department of Economics, University of Semnan, Semnan, Iran.
b. Department of Economics, University of Allame-Tabatabaei, Tehran, Iran.
Article History Abstract
Received date: 13 June 2018 Revised date: 12 September 2018 Accepted date: 1 October 2018 Available online: 15 October 2018
Oil and Gas sector, with notable participation in national product and funding public expenditures, plays a seminal role in Iran's economy. Although there is a relative lag in providing proportionate supply, Iran stands at the highest rank of owning world's related proven reserves. Using a Computable General Equilibrium (CGE) model, this study was aimed to investigate the effects of the increase in the acquisition rate of Iran's oil and gas upstream affairs from oil revenues on GNP and public budget, which are supposed to help the government keep its main obligations often funded from oil revenues .
By applying the 18% gain, instead of the current 14.5%, to the oil and gas upstream affairs, short-run recession against long-run booming effects would emerge. Accordingly, maintaining the initial level of either the Public Goods and Services (PGS) output or Government Financial Supports on PGS, GNP could boost up to 5% with over 15% of required contraction in the public budget. On the contrary, maintaining the initial level of either the Transfer Payments or Transfer Payments and Financial Supports on PGS (simultaneously), GNP would rise only 1%, due to the negligible required contraction in the public budget. Therefore, allocating more oil revenues to developing upstream affairs (even under the presence of the contemporary main obligations) is recommended due to its potential to spur notable growth in GNP.
JEL Classification: D58
G38 H3 H4 H6 Q48
Keywords: Oil and Gas Public Budget
Computable General Equilibrium Iran
1. Introduction
A comparative review of the ownership of the world's proven reserves of oil and gas bespeaks of the leading position of Iran. However, the related share of this country in providing the global supply of oil and gas shows relative retardation compared with other energy suppliers. In addition, according to
Central Bank of Iran (2017), the oil and gas sector plays a pivotal role in Iran's economy with at least 10% direct participation in GNP and 37% contribution to funding the public budget expenditures. Furthermore, for attaining a
comprehensive view of the overall contribution of oil and gas sector to Iran's economy, indirect and induced economic effects must be taken into account. Such a contemporary notable contribution of oil and gas sector to the national economy and necessity of analyzing enhancement of that contribution because of Iran's top position in owning global oil and gas reserves, is main aim of present research.
The current reallocation scheme of oil and gas revenues based on the national laws determines a specific portion of those revenues for each institution. Based on the Annual Budget Laws, the main part of these resources are devoted to the government for funding its public spending and expenditures. Only 14.5% of oil revenues are designated to oil and gas upstream affairs. The other main section, which receives part of those revenues, is the National Development Fund of Iran (NDFI).
The above-mentioned issues implicitly denote the necessity of paying more attention to reinforcing oil and gas upstream sector in order to stimulate the national economy. This assumptive policy would tighten the government’s direct gaining from oil revenues, but it would possibly lead to an increase in subsequent tax revenues.
In this regard, in the second section, by overviewing the related literature and focusing on some relevant studies, an attempt is made to highlight the important aspects of conducting this research. The third section would focus on oil and gas contribution in national product, Iran's actual and potential participation in the world's oil and gas markets, objectives and significance of the study, and model specification. Finally, the estimation results, a comparative summary, and policy suggestions would be presented in the fourth and fifth sections.
2. Literature Review
According to Moshiri and Hayati (2017), natural resources literatures could be divided into two main groups. The first group concentrates on answering an essential historic question, which is determining the final positive or negative effect of owning natural resources by focusing on the economy. Some studies, most of which zoomed in on the more resource-abundant countries, have shown that the abundance of resources often leads to negative economic outcomes. For instance, Gylfason (2006) sought to assess the crowding out effects of natural resources and concluded that natural resources had a negative impact on economic growth. On the contrary, there are some adverse findings denoting that some initially poorly-resourced countries like Japan or some nearly-developed countries like Norway, known as a rich-resource country, have illustrated that poorness of resources could never inhibit economic development while the abundance of resources and its contribution to development was dependent on the efficacious use of resources.
often leads to the enhancement of some sectors while pushing down some other sectors (Lagged Sectors). Based on Corden (1984) and Torvik (2001), DD is possibly one of the predominant approaches tapped into when analyzing natural resources economic issues, which is also expressed as the economic effects of a so-called leading sector through some lagged sectors.
Exploring the economic research conducted by Hunt and Morgan (1995), Neary (2003), and other studies (e.g. Ferguson and Maurice, 1978; Dowling, 2004; Hendrischke, 2013; and Porter, 2011), one can conclude that the abundance of production resources via related supply-demand structure could lead to lower unit costs of production and improve nation's comparative and competitive advantages. In addition, according to Wall Street Journal (2016), producing a barrel of oil and gas for Iran costs less than $10 per barrel in 2016, resulting in Iran, standing just behind Saudi Arabia, to be the second oil producer in terms of the cost of oil production in the world. Such fewer costs are turned into considerable margins for the Middle East oil exporting countries (including Iran) and give them the great potential for gaining both comparative and competitive advantages. Referring to the above-mentioned oil-related capabilities for Iran, the present research aimed to open a new area in studies revolving around issues related to natural resources and focused on investigating the reallocation of oil revenues to enhance the national economy and by tracking changes that had happened in public budget components.
According to Dudlák (2018), Iran has significant potentials in owning reserves and producing both oil and natural gas. He also investigated the structure of Iran’s economic investments, financial and legal oil and gas related issues.
Mirimoghadam and Ghazinoory (2017), by focusing on South Pars Gas Field, attempted to identify the components of an institutional structure, which affected the technological learning outcomes and confirmed that technological learning had not happened successfully in the oil and gas industry. Reviewing Iran's historical strategies and policies in energy sectors, Hafezi et al. (2017) proposed some strategic recommendations for developing Iran's market shares. Doulah and Shafee (2016) reviewed the legal regime and the laws pertinent to Iran’s oil and gas.
Azadi and Yarmohammad (2011) tried to analyze Iran's oil export capacity and the potential factors affecting its capacity. By reviewing the local energy demand, they provided their readers with some insights regarding the technical and economic aspects of the crude oil production, such as the investment aspects of Iranian oil and gas industry by focusing on the failures of recently used buyback contracts.
Sadeghi and Hosseini (2006) highlighted the importance of uncertainty concerns in energy planning and reviewed some common methods of how this factor could contribute to energy programming models, which may, in turn, lead to some possible inconsistency in results.
By applying a panel framework, Mehrara (2008) tried to examine the relationship between oil revenues and output growth in oil-exporting countries. His research confirmed the lack of institutional mechanisms in oil-dependent countries, public expenditure, and revenue linkage effect of oil revenue shocks on output. Furthermore, the stimulating effect caused by the booming oil sector on total output growth was acknowledged in his research.
Wolf (2009) investigated the efficiency of public ownership of oil affairs versus private ownership of such affairs. He referred to the International Oil Companies (IOCs) as the private ownership organization and the National Oil Companies (NOCs) as the public ownership enterprises. The findings of his study indicated that the performance of the public sector was significantly lower than that of the private sector in terms of output efficiency and profitability.
3. Methodology
3.1 The Notable Contribution of Oil and Gas in Economy
Iran stands at the first place in terms of owning proven natural gas reserves and fourth in having proven reserves of crude oil, following Venezuela, Saudi Arabia, and Canada (Dudley & Dale, 2017).1 By an annual average growth rate of 6.4% during 2005-15 and 6.6% in 2016, Iran reached a position to be able to produce 5.7% of the world's whole natural gas production and stood at the third place in supplying the global gas (mainly for domestic demand) after the United States and Russia, but slightly higher than Qatar2 and Canada. In contrast, during the same period, Qatar's average growth rate of gas production reached 14.6% and although this rate dropped to 1.3% in 2016, this country shared 5.1% of the global gas production in 2016 (Ibid). Reviewing the oil production statistics shows that the annual production of Iran's crude oil has decreased slightly during 2005-15 by an average rate of -0.8% from 4465 Thousand Barrels per Day (TB/D) to 3895 TB/D due to the international sanctions. Then, the production experienced an upturn and reached about 4600 TB/D in 2016, sharing 5% of the world’s oil production. Due to the recent dramatic global fall in the price of oil and the recent global economic and financial crisis, diminishing investment in the relevant upstream affairs versus a rising investment in downstream affairs is expected.3
Furthermore, depending on the actual oil production capacity and global prices, the oil and gas sector contributes significantly to Iran's economy, ranging from, at least, 10% to 20%. Moreover and according to Central Bank of Iran
1 According To Energy Information Administration (Annual Energy Outlook, 2018); Iran takes second
place of owning world proven reserves of natural gas after Russia and fourth place of owning crude oil.
(2017), oil revenues contribution to funding public budget differs from, at least, 37% to around 50%.
Iran's share in owning world's reserves of oil and gas as well as the seminal contribution of this sector in shaping the national economy, as evidenced above, bespeaks of its undeniable potential in shaping the national economy and meeting world's energy demand proportionately. Its full potential could be materialized due to its less unit cost, accumulating required capital stocks.
In this regard, the authors aimed to investigate the possibility of reallocating a higher portion of oil and gas revenues to enhance the upstream areas and the role of such policy in shaping the domestic oil and gas value chain. In addition, and as to address the realistic side of the research, especially issues relevant to the government obligations, some relevant scenarios are suggested. These obligations have been shaped historically and based on some legal permissions and economic responsibilities, especially in providing public goods and services or transfer payments.
3.2 The Legal Background of Allocating Oil and Gas Revenues
Based on the Iranian laws, the National Iranian Oil Company (NIOC) has been recognized as the company responsible for Oil and Gas's Upstream Affairs and 14.5% of oil revenues (ranging from domestic sales or export) belongs to it.1 This financial resource would be allocated for conducting relevant production and development activities. NIOC must pay all the required costs of crude oil and natural gas up to the supply stage; this includes study and exploration, drilling, extraction, and production and development of oil and gas fields. In addition, based on the current laws, the main portion of oil revenues, as part of the public budget resources, is to be spent on funding the deficit in the public budget annually. Another part of this revenue is deposited to National Development Fund of Iran (NDFI), and the remaining resources are deposited to Exchange Reserve Account (ERA).
Uplifting the potential energy supply, first and foremost, needs structural reforms that, in turn, can lead to the increase in the participation of the private sector, especially attracting International Oil Companies (IOCs) in the supply side of Iran’s oil and gas. Moving from the traditional buyback contracts, which did not reach the required efficiency in absorbing IOCs participation, along with introducing a new framework for oil contracts with long-run participatory capability could be among the effective steps available.
3.3 Model
This study, by utilizing a Computable General Equilibrium (CGE) model, was undertaken to investigate the effects of the increase in the acquisition rate of oil and gas upstream affairs from their revenues on the national economy,
1 First article of Iranian Law of Addendum (2), for more detail see:
specifically on Gross National Product (GNP), Public Budget Resources (PBR), and Public Budget Spending (PBS). A high level of dependency of public funds on oil revenues and also the crucial contribution of this sector in GNP are the main reasons for concentrating on these economic variables.
The GNP was analyzed in order to obtain the value added of each sector; also, changes in the output and input were reviewed. In assessing the PBR, changes in the State Share of Oil Revenues (SSOR), along with changes in each type of tax revenues including Household's Income Tax (HIT), Production Tax (PT), Corporate Tax (CT), and Import Tariffs (IT), was considered. By the same token, and analyzing the PBS, emphasis was put on the main components of the PBS, including Government Spending on Goods and Services (GSGS), and the Transfer Payments, and Cash Subsidies (TPCS).
The process of analysis followed a comparative static1 CGE model pattern which relies on the usual circular flow of economic activities and follows a small open economy approach.2 This model includes the following four agents: representative household, firms, government, and foreign sector. The model was be fed by the last revision of Iran's Social Accounting Matrix (SAM) of 2011 developed by the Research Center of the Islamic Consultative Assembly3.
This model consists of four main segments, including price blocks, production activities, agents equalities, and economic equilibrium conditions. These mentioned components signify the equilibrium conditions of a special economy via SAM. Also, due to the main goal of this study and based on the structure of the SAM used, only three groups of equations, based on Hosoe et al. (2010), were added.4 These equations are production activities, account related equations (including households, government and investment – saving equalities) along with market -clearing conditions. Under a utility maximization problem for a household subject to budget constraints, the demand function for commodity (i) can be obtained5 as follows:
𝑚𝑎𝑥
𝑋𝑖𝑝 𝑈𝑈 = ∏ (𝑋𝑖 𝑝
)𝛼𝑖
𝑖 (1)
Subject to:
1Wing (2004, 2007) explicated the uses of the foundations, and the specification of the CGE model, and
suggested some modified methods as to reach an appropriate framework for such models in order to analyze policy impacts. In addition, they insisted on CGE models as an efficient tool for deriving ultimate effects of the fiscal policies on economy and their capabilities in assessing wide-economic effects based on general equilibrium approach. For more number of CGE models applied for examining Iran’s economy, see Dadgar et al. (2008); Alshehabi (2012, 2013); Devarajan (1988); Farajzadeh and
Bakhshoodeh (2015); Shahnoushi et al. (2012); and Dahmardeh et al. (2012).
2 A domestically modified model based on Hosoe et al. (2010) model, which was extended in order to cover
the interconnections among oil and gas sector, state owned sector, and other sectors and public budget dependencies.
3 Iranian Social Accounting Matrix (SAM 2011/12).
∑ 𝑝𝑖 𝑖𝑞𝑋𝑖𝑝 = (∑ 𝑝ℎ 𝑓
𝐹𝐹ℎ− 𝐺𝐶 − 𝐹𝐶) − 𝑇ℎ𝑜ℎ𝑑 + 𝑇𝑃𝐶𝑆 − 𝐹𝐻 − 𝑆𝑝 ℎ
+𝐻𝑂𝐻𝑒𝑥𝑡− 𝐸𝑋𝑇ℎ𝑜ℎ)
(2)
𝑋𝑖𝑝 = 𝛼𝑖
𝑝𝑖𝑞((∑ 𝑝ℎ 𝑓
𝐹𝐹ℎ− 𝐺𝐶 − 𝐹𝐶) − 𝑇ℎ𝑜ℎ𝑑 + 𝑇𝑃𝐶𝑆 − 𝐹𝐻 − 𝑆𝑝 ℎ
+𝐻𝑂𝐻𝑒𝑥𝑡− 𝐸𝑋𝑇ℎ𝑜ℎ)
(3)
Government collects SSOR plus taxes, including direct taxes, production taxes, and import tariffs, spends the main part of these revenues on their expenditures, and saves the remainder. Therefore, we have:
𝑇𝑗𝑧= 𝜏𝑗𝑧𝑝𝑗𝑧𝑍𝑗 (4)
𝐼𝑇𝑖= 𝜏𝑖𝑚𝑝𝑖𝑚𝑀𝑖 (5)
𝐶𝑇 = 𝐶𝑇𝑛𝑜𝑛𝑜𝑖𝑙+ 𝑆𝑆𝑂𝐺 (6)
𝐶𝑇𝑛𝑜𝑛𝑜𝑖𝑙= 𝜏𝑛𝑜𝑛𝑜𝑖𝑙𝑑 (𝐹𝐶 − 𝑁𝐼𝑂𝐶𝑐𝑎𝑝𝑖𝑡𝑎𝑙− 𝑁𝑂𝑁𝑁𝐼𝑂𝐶𝑐𝑎𝑝𝑖𝑡𝑎𝑙) (7)
𝑋𝑖𝑔= 𝜇𝑖
𝑝𝑖𝑞(𝑇ℎ𝑜ℎ
𝑑 + ∑ 𝑇
𝑗𝑧
𝑗 + ∑ 𝑇𝑗 𝑗𝑚+ 𝐶𝑇 + 𝐺𝐶 − 𝑇𝑃𝐶𝑆 − 𝑆𝑔) (8)
Regarding equations pertinent to the government sector, it is worth noting that the government’s incomes are endogenous and based on the initial values, the combination of government spending is fixed. However, government savings is endogenous and flexible. Furthermore, and regarding the current account balance, two constraints are used: Foreign investment, which is assumed to be exogenous, and exchange rate, which is endogenous and is determined in the model. In addition, the macro closure for savings is a savings-driven closure type. According to the following equations, the savings of each sector are determined in the model, and investment, as an endogenous variable, adjusts itself as to strike a balance between savings and investment.
𝑋𝑖𝑣 = 𝜆𝑖
𝑝𝑖𝑞(𝑆
𝑝+ 𝑆𝑔+ 𝜀𝑆𝑓+ 𝑆𝑏) (9)
𝑆𝑝= 𝑠𝑠𝑝((∑ 𝑝 ℎ 𝑓
𝐹𝐹ℎ− 𝐺𝐶 − 𝐹𝐶) + 𝑇𝑃𝐶𝑆 + 𝐻𝑂𝐻𝑒𝑥𝑡− 𝐸𝑋𝑇ℎ𝑜ℎ−
ℎ 𝑇ℎ𝑜ℎ𝑑 ) (10)
𝑆𝑏= 𝑠𝑠𝑏((𝐹𝐶 − 𝑆𝑆𝑂𝐺 − 𝑁𝐼𝑂𝐶
𝑐𝑎𝑝𝑖𝑡𝑎𝑙) + 𝐹𝐻 − 𝐶𝑇𝑁) (11)
𝑆𝑔 = 𝑠𝑠𝑔(𝑇
ℎ𝑜ℎ𝑑 + 𝐶𝑇 + ∑ 𝑇𝑗 𝑗𝑧+ ∑ 𝑇𝑗 𝑗𝑚+ 𝐺𝐶) (12)
Moreover, the export and import prices and the balance of payments constraint should be taken into account as equations (13) – (15):
𝑝𝑖𝑒= 𝜀𝑝
𝑖𝑤𝑒 (13)
𝑝𝑖𝑚= 𝜀𝑝𝑖𝑤𝑚 (14)
∑ 𝑝𝑖𝑤𝑒𝐸 𝑖
𝑖 + 𝑆𝑓+𝐿𝐴𝐵𝑒𝑥𝑡/𝜀 + 𝐶𝐴𝑃𝑒𝑥𝑡/𝜀 +𝐻𝑂𝐻𝑒𝑥𝑡/𝜀
= ∑ 𝑝𝑖 𝑖𝑤𝑚𝑀𝑖+𝐸𝑋𝑇𝑙𝑎𝑏/𝜀 + 𝐸𝑋𝑇𝑐𝑎𝑝/𝜀 +𝐸𝑋𝑇ℎ𝑜ℎ/𝜀 (15)
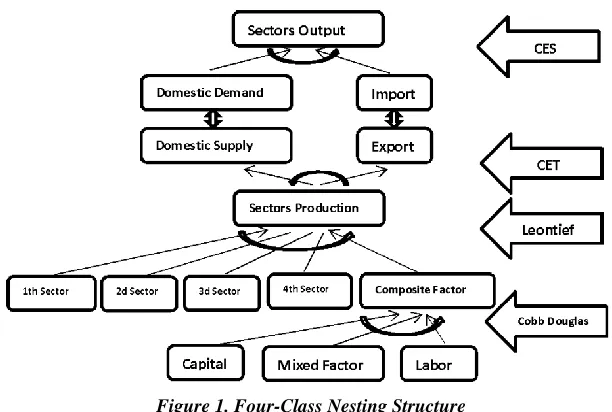
Figure 1. Four-Class Nesting Structure Source: Hosoe et al. (2010)
In the first stage, the production process of firms, in the form of a Cobb Douglas production function, generates a composite factor (value added) by using labor and capital. In the second step, this composite factor is combined with the intermediate inputs demanded from other firms and this will produce gross domestic output. The Leontief production function is used in the second stage of the production process. Firm primary factor demand and price equality, based on a profit maximization procedure, could be calculated as equations (16) – (20):
𝑌𝑗 = 𝑏𝑗∏ 𝐹ℎ,𝑗 𝛽ℎ,𝑗
ℎ (16)
𝐹ℎ,𝑗 = 𝛽ℎ,𝑗𝑝𝑗
𝑦
𝑝ℎ𝑓 𝑌𝑗 (17)
𝑋𝑖,𝑗= 𝑎𝑥𝑖,𝑗𝑍𝑗 (18)
𝑌𝑗 = 𝑎𝑦𝑗𝑍𝑗 (19)
𝑝𝑗𝑧= 𝑎𝑦𝑗𝑝𝑗 𝑦
+ ∑ 𝑎𝑥𝑖,𝑗𝑝𝑖 𝑞
𝑖 (20)
In the third stage, the transformation between exports and domestic goods would happen equations (21) – (23):
𝑍𝑖 = 𝜃𝑖[𝜉𝑒𝑖𝐸𝑖 𝜙𝑖+ 𝜉𝑑
𝑖𝐷𝑖 𝜙𝑖]
1
𝜙𝑖 (21)
𝐸𝑖 = [
𝜃𝑖𝜙𝑖𝜉𝑒𝑖(1+𝜏𝑖𝑧)𝑝𝑖𝑧
𝑝𝑖𝑒 ]
1 1−𝜙𝑖
𝑍𝑖 (22)
𝐷𝑖 = [
𝜃𝑖𝜙𝑖𝜉𝑑𝑖(1+𝜏𝑖𝑧)𝑝𝑖𝑧
𝑝𝑖𝑑 ]
1 1−𝜙𝑖
Substitution between imports and domestic goods (Armington1 composite) would determine the final output as equations (24) – (26):
𝑄𝑖= 𝛾𝑖(𝛿𝑚𝑖𝑀𝑖 𝜂𝑖+ 𝛿𝑑
𝑖𝐷𝑖 𝜂𝑖)
1
𝜂𝑖 (24)
𝑀𝑖= [
𝛾𝑖𝜂𝑖𝛿𝑚𝑖𝑝𝑖 𝑞
(1+𝜏𝑖𝑚)𝑝 𝑖𝑚
]
1 1−𝜂𝑖
𝑄𝑖 (25)
𝐷𝑖 = [ 𝛾𝑖𝜂𝑖𝛿𝑑𝑖𝑝𝑖
𝑞
𝑝𝑖𝑑 ]
1 1−𝜂𝑖
𝑄𝑖 (26)
Oil and Gas related equations are added to the model as equations (27) – (33):
𝑂𝑈𝑇𝑃𝑈𝑇𝑖= 𝑄𝑖+ 𝐸𝑖− 𝑀𝑖 (27)
𝑂𝑈𝑇𝑃𝑈𝑇𝑂𝐼𝐿𝑁𝐼𝑂𝐶= 𝑥𝑥𝑥 ∗ 𝑂𝑈𝑇𝑃𝑈𝑇𝑂𝐼𝐿 (28)
𝑁𝐼𝑂𝐶𝑛𝑜𝑛𝑐𝑎𝑝𝑖𝑡𝑎𝑙= ∑ 𝑋𝑖 𝑖,𝑜𝑖𝑙+∑ 𝐹ℎ ℎ,𝑜𝑖𝑙− 𝐹𝑐𝑎𝑝𝑖𝑡𝑎𝑙,𝑜𝑖𝑙+ 𝑀𝑜𝑖𝑙+ 𝑇𝑜𝑖𝑙𝑧 (29)
𝑁𝐼𝑂𝐶𝑐𝑎𝑝𝑖𝑡𝑎𝑙= 𝑂𝑈𝑇𝑃𝑈𝑇𝑂𝐼𝐿𝑁𝐼𝑂𝐶− 𝑁𝐼𝑂𝐶𝑛𝑜𝑛𝑐𝑎𝑝𝑖𝑡𝑎𝑙 (30)
𝑁𝑂𝑁𝑁𝐼𝑂𝐶𝑐𝑎𝑝𝑖𝑡𝑎𝑙= 𝐹𝑐𝑎𝑝𝑖𝑡𝑎𝑙,𝑜𝑖𝑙− 𝑁𝐼𝑂𝐶𝑐𝑎𝑝𝑖𝑡𝑎𝑙 (31)
𝑆𝑇𝑀 = 𝑣𝑣𝑣 ∗ 𝑂𝑈𝑇𝑃𝑈𝑇𝑂𝐼𝐿 (32)
𝑆𝑆𝑂𝐺 = 𝑁𝑂𝑁𝑁𝐼𝑂𝐶𝑐𝑎𝑝𝑖𝑡𝑎𝑙− 𝑆𝑇𝑀 − 𝐻𝑍𝐴 (33)
Ultimately, in order to achieve a balance between the demand and supply in all the markets, it is important to impose the market-clearing conditions as equations (34) – (35):
𝑄𝑖= 𝑋𝑖 𝑝
+ 𝑋𝑖𝑔+ 𝑋𝑖𝑣+ ∑ 𝑋 𝑖,𝑗
𝑗 (34)
∑ 𝐹𝑗 ℎ,𝑗= 𝐹𝐹ℎ (35)
Based on the microeconomic theories, the results should be obtained separately for the short-run and long run duration. The adjustment possibilities of inputs would distinguish short-run and long run conditions. In this regard, for the short-run duration, the capital stock level for all sectors holds fixed possibility and a limited modifying possibility is allowed for other resources. In contrast, for the long-run duration, in order to achieve maximum gains across sectors, the production inputs adjustment, as well as a possible mobility of factors, was taken into account.
In line with the objectives of the present research, i.e. investigating the effects of changing the oil upstream affairs acquisition rate from its revenues on the GNP, PBR, and PBS, the supply side of Iran's national economy were divided into four main groups of sectors as follows: Sector (1)which includes crude oil and natural gas upstream affairs; sector (2) which includes all state’s owned activities involved in providing Public Goods and Services (PGS) such as defense, social security, public administration, public health, education and etc.; Sector (3) which includes private activities and they somehow are dependent on government financial support; and sector (4) which includesall other economic activities that
generally are not under any kind of government financial support (with no share in PBS).1
In this research and based on the economic and legal responsibilities of government, four policy options were designed and evaluated. All scenarios had a point in common, i.e. increasing the NIOC’s share of oil revenues in order to develop oil and gas upstream affairs, from the current 14.5%2 rate to an assumptive 18%, as well as discharging some additional government obligations (which have relied on oil revenues due to the necessity and seriousness attached to the government responsibilities). These four scenarios are presented below.
The additional aspects of the first, second, and third scenarios are maintaining the initial level3 of the TPCS to households, maintaining the initial level of governmental spending to the PGS (activities grouped in the second sector), maintaining the initial level of the PGS output4 (output of the second sector), respectively. Finally, and for the fourth scenario which is the most conservative scenario, all additional aspects of the other three scenarios should be identified simultaneously.
4. Results
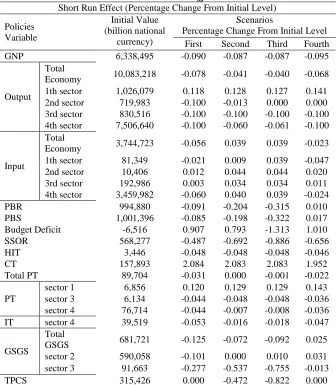
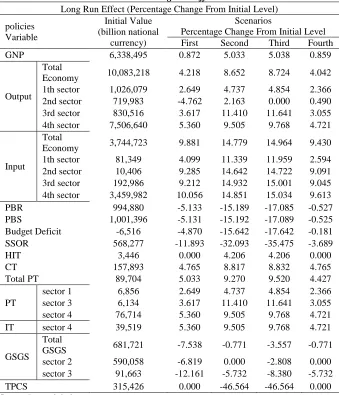
Model estimation results by applying GAMS software in accordance with the above-mentioned breakdown of a four-sector economy for short-run and long-run duration are presented in Tables 1 and 2, respectively.
1 This kind of classification of economic activities comes from the government commitment to the
economic activities and the share of government funding actually occurred according to the SAM utilized.
2 Based on the first article of Iranian Law of Addendum (2), NIOC has been recognized responsible for Oil
and Gas's Upstream Affairs and 14.5% of oil revenues is allocated to NIOC for developing the upstream areas.
3 The initial level of each variable refers to the base-year value of that variable according to the SAM used. 4 Despite apparently similar concentration on PGS sector, the imposed constraints on the second and third
Table 1. Short Run Effects
Short Run Effect (Percentage Change From Initial Level)
Policies Variable
Initial Value (billion national
currency)
Scenarios
Percentage Change From Initial Level
First Second Third Fourth
GNP 6,338,495 -0.090 -0.087 -0.087 -0.095
Output
Total
Economy 10,083,218 -0.078 -0.041 -0.040 -0.068
1th sector 1,026,079 0.118 0.128 0.127 0.141
2nd sector 719,983 -0.100 -0.013 0.000 0.000
3rd sector 830,516 -0.100 -0.100 -0.100 -0.100
4th sector 7,506,640 -0.100 -0.060 -0.061 -0.100
Input
Total
Economy 3,744,723 -0.056 0.039 0.039 -0.023
1th sector 81,349 -0.021 0.009 0.039 -0.047
2nd sector 10,406 0.012 0.044 0.044 0.020
3rd sector 192,986 0.003 0.034 0.034 0.011
4th sector 3,459,982 -0.060 0.040 0.039 -0.024
PBR 994,880 -0.091 -0.204 -0.315 0.010
PBS 1,001,396 -0.085 -0.198 -0.322 0.017
Budget Deficit -6,516 0.907 0.793 -1.313 1.010
SSOR 568,277 -0.487 -0.692 -0.886 -0.656
HIT 3,446 -0.048 -0.048 -0.048 -0.046
CT 157,893 2.084 2.083 2.083 1.952
Total PT 89,704 -0.031 0.000 -0.001 -0.022
PT
sector 1 6,856 0.120 0.129 0.129 0.143
sector 3 6,134 -0.044 -0.048 -0.048 -0.036
sector 4 76,714 -0.044 -0.007 -0.008 -0.036
IT sector 4 39,519 -0.053 -0.016 -0.018 -0.047
GSGS
Total
GSGS 681,721 -0.125 -0.072 -0.092 0.025
sector 2 590,058 -0.101 0.000 0.010 0.031
sector 3 91,663 -0.277 -0.537 -0.755 -0.013
TPCS 315,426 0.000 -0.472 -0.822 0.000
Table 2. Long Run Effects
Long Run Effect (Percentage Change From Initial Level)
policies Variable
Initial Value (billion national
currency)
Scenarios
Percentage Change From Initial Level
First Second Third Fourth
GNP 6,338,495 0.872 5.033 5.038 0.859
Output Total
Economy 10,083,218 4.218 8.652 8.724 4.042
1th sector 1,026,079 2.649 4.737 4.854 2.366
2nd sector 719,983 -4.762 2.163 0.000 0.490
3rd sector 830,516 3.617 11.410 11.641 3.055
4th sector 7,506,640 5.360 9.505 9.768 4.721
Input
Total
Economy 3,744,723 9.881 14.779 14.964 9.430
1th sector 81,349 4.099 11.339 11.959 2.594
2nd sector 10,406 9.285 14.642 14.722 9.091
3rd sector 192,986 9.212 14.932 15.001 9.045
4th sector 3,459,982 10.056 14.851 15.034 9.613
PBR 994,880 -5.133 -15.189 -17.085 -0.527
PBS 1,001,396 -5.131 -15.192 -17.089 -0.525
Budget Deficit -6,516 -4.870 -15.642 -17.642 -0.181
SSOR 568,277 -11.893 -32.093 -35.475 -3.689
HIT 3,446 0.000 4.206 4.206 0.000
CT 157,893 4.765 8.817 8.832 4.765
Total PT 89,704 5.033 9.270 9.520 4.427
PT
sector 1 6,856 2.649 4.737 4.854 2.366
sector 3 6,134 3.617 11.410 11.641 3.055
sector 4 76,714 5.360 9.505 9.768 4.721
IT sector 4 39,519 5.360 9.505 9.768 4.721
GSGS Total
GSGS 681,721 -7.538 -0.771 -3.557 -0.771
sector 2 590,058 -6.819 0.000 -2.808 0.000
sector 3 91,663 -12.161 -5.732 -8.380 -5.732
TPCS 315,426 0.000 -46.564 -46.564 0.000
Source: Research findings
5. Concluding Remarks
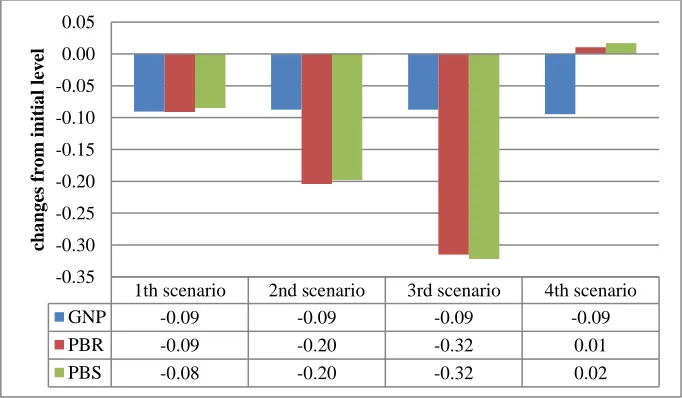
budget, except for the fourth scenario, which due to the constraint on maintaining the initial level of the TPCS and GSGS, the public spending was not found to decline.
Figure 2. Short-Run Comparative Effects of the Scenarios
Source: Research findings
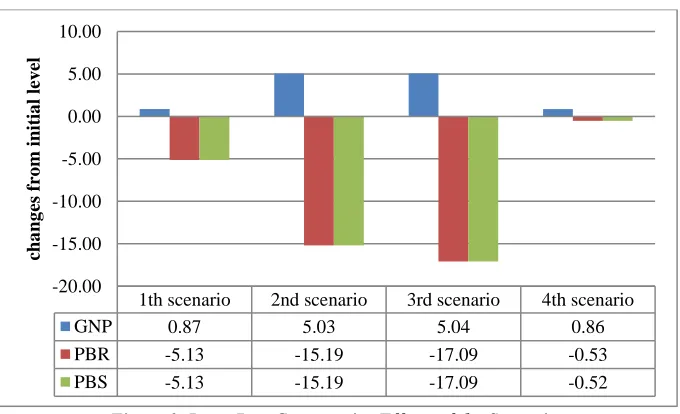
In the light of the information present in Figure 3, long-run changes of GNP due to Iran's considerable unemployment rate of production factors (which decline crowding out effects into other sectors), reveals decreasing signs of DD phenomenon. The results showed that the third scenario, compared with the second scenario with a 5.023% positive effect on GNP, left more pleasant outcomes, with 5.038% potential growth in GNP compared with its initial level. Comparing outputs across the sectors, it became clear that the greatest stimulating impact with over 11% and 9% increase compared with their initial levels could happen in the third and fourth sectors, respectively. That said the output of the oil and gas sector as a driving sector, which stimulate other sectors via forward and backward linkages, rose just around 4% by itself. Therefore, the direct impact of the first sector, together with the stimulating (indirect) effects of this sector through the other sectors, brought about a remarkable final improvement in GNP. In contrast, the first and fourth scenarios, with 0.872% and 0.859% potential upward changes in GNP, respectively, showed weaker changes in GNP. The relevant opposed restrictions of these scenarios and the commitment of keeping the initial level of obligations, especially the transfer payment and cash subsidies, resulted in a negligible growth.
1th scenario 2nd scenario 3rd scenario 4th scenario
GNP -0.09 -0.09 -0.09 -0.09
PBR -0.09 -0.20 -0.32 0.01
PBS -0.08 -0.20 -0.32 0.02
-0.35 -0.30 -0.25 -0.20 -0.15 -0.10 -0.05 0.00 0.05
cha
ng
es
fro
m
initia
l
lev
Figure 3. Long-Run Comparative Effects of the Scenarios
Source: Research findings
Furthermore, comparing the long-run effects of these scenarios on the public budget resources and spending showed that the highest decline by over 17% reduction in the PBR, PBS, and the budget deficit was caused by the third scenario. Following that, the second scenario, with over a 15% reducing effect, the first scenario with over a 5% declining effects, and, lastly, the fourth scenario with less than 1% downward changes prompted the highest decline, respectively. Although, according to Table (3), a large part of the drops in resources could be compensated by over 4% rise in the HIT and nearly 9% increase in the CT, the dramatic fall in the SSOR (with over 30%) would impose around 47% cut in the TPCS on the households as well as notable cut in GSGS. Such rising pressures on the government are among other consequences, which ensue from the implementation of the second and third scenarios, and this deserves further attention and investigation.
It can be concluded that depending on the governments' attitudes, possibly decisive ones in order to gain considerable upward effects on GNP, (despite required contradictory changes in the public budget), prefer to apply the second or third scenarios. In contrast, the consequences of a fall in the TPCS (which matters for conservative governments) might reduce the tendency among the governments to choose policies that are more revolutionary. As such, the fourth scenario, due to its less detrimental effects on the PBR and PBS compared with the other scenarios, may appear to be a more interesting option for the conservative policy-makers and they may prefer to opt for such a policy and, as a result, prevent the possible public discontents caused by the second or third scenarios.
1th scenario 2nd scenario 3rd scenario 4th scenario
GNP 0.87 5.03 5.04 0.86
PBR -5.13 -15.19 -17.09 -0.53
PBS -5.13 -15.19 -17.09 -0.52
-20.00 -15.00 -10.00 -5.00 0.00 5.00 10.00
cha
n
g
es
fro
m
in
it
ia
l
lev
References
Alshehabi, O. H. (2012). Energy and labour reform: Evidence from Iran. Journal
of Policy Modeling, 34(3), 441-459.
Alshehabi, O. H. (2013). Modelling energy and labour linkages: A CGE approach
with an application to Iran. Economic Modelling, 35, 88-98.
Azadi, A. K., & Yarmohammad, M. H. (2011). Analysis of Iran's crude oil export
future capacity. Energy Policy, 39(6), 3316-3326.
Central Bank of Iran. (2017). Annual Review 2016/17. Retrieved from:
https://www.cbi.ir/simplelist/AnnualReview_en.aspx.
Corden, W. M. (1984). Booming sector and Dutch Disease economics: Survey
and consolidation. Oxford Economic Papers, 36(3), 359-380.
Dadgar, Y., Nazari, R. a., & Mehrabani, F. (2008). The impact of fiscal policy
and gas price shock on welfare and income distribution in Iran. Social
Welfare, 7(28), 129-150.
Dahmardeh, N., Shahraki, M., & Ghaderi, S. (2012). A study of the impact of
saving on macroeconomic variables in Iran (CGE Model). International
Journal of Economics and Finance, 4(2), 204.
Devarajan, S. (1988). Natural resources and taxation in computable general
equilibrium models of developing countries. Journal of Policy Modeling,
10(4), 505-528.
Doulah, A., & Shafee, M. (2016). Study of the legal regime of oil and gas transit
in energy charter treaty and law of Iran. J. Pol. & L., 9, 194.
Dowling, G. R. (2004). A commentary on hunt and arnett's paper: market segmentation strategy, competitive advantage, and public policy: Grounding
segmentation strategy in resource-advantage theory. Australasian Marketing
Journal , 12(1), 30-31.
Dudlák, T. (2018). After the sanctions: Policy challenges in transition to a new
political economy of the Iranian oil and gas sectors. Energy Policy, 121,
464-475.
Dudley, B., & Dale, S. (2017). BP Statistical Reviewof World EnergyJune 2017.
London: BP Retrieved from:
https://www.bp.com/content/dam/bp/en/corporate/pdf/energy- economics/statistical-review-2017/bp-statistical-review-of-world-energy-2017-full-report.pdf.
Farajzadeh, Z., & Bakhshoodeh, M. (2015). Economic and environmental analyses of Iranian energy subsidy reform using computable general
equilibrium model. Energy for Sustainable Development, 27, 147-154.
Farzanegan, M. R., & Markwardt, G. (2009). The effects of oil price shocks on
the Iranian economy. Energy Economics, 31(1), 134-151.
Ferguson, C. E., & Maurice, S. C. (1978). Economic Analysis: Theory and
Gylfason, T. (2006). Natural resources and economic growth: From dependence
to diversification. In Economic liberalization and integration policy (pp.
201-231): Springer.
Hafezi, R., Akhavan, A., & Pakseresht, S. (2017). Projecting plausible futures for
Iranian oil and gas industries: Analyzing of historical strategies. Journal of
Natural Gas Science and Engineering, 39, 15-27.
Hendrischke, H. (2013). The Political Economy of China's Provinces:
Competitive and Comparative Advantage: Routledge.
Holtberg, P. D., Beamon, J. A., Schaal, A. M., Ayoub, J., & Turnure, J. T. (2018).
Annual energy outlook 2018. Retrieved from:
http://www.iranwatch.org/sites/default/files/eia_report.pdf
Hosoe, N., Gasawa, K., & Hashimoto, H. (2010). Textbook of computable general
equilibrium modeling: programming and simulations: Springer.
Hunt, S. D., & Morgan, R. M. (1995). The comparative advantage theory of
competition. The Journal of Marketing, 1-15.
Maddah, M., Berijanian, M. M., & Ghazizadeh, M. S. (2018). Analysis of electricity generation’s externalities on sectorial output growth and welfare
in Iran. Iranian Journal of Economic Studies, 6(1), 109-127.
Mehrara, M. (2008). The asymmetric relationship between oil revenues and
economic activities: The case of oil-exporting countries. Energy Policy,
36(3), 1164-1168.
Mirimoghadam, M., & Ghazinoory, S. (2017). An institutional analysis of technological learning in Iran's oil and gas industry: Case study of south Pars
gas field development. Technological Forecasting and Social Change, 122,
262-274.
Moshiri, S., & Hayati, S. (2017). Natural resources, institutions quality, and
economic growth: A Cross-country analysis. Iranian Economic Review,
21(3), 661-693.
Porter, M. E. (2011). Competitive advantage of nations: creating and sustaining
superior performance (Vol. 2): Simon and Schuster.
Sadeghi, M., & Hosseini, H. M. (2006). Energy supply planning in Iran by using fuzzy linear programming approach (regarding uncertainties of investment
costs). Energy Policy, 34(9), 993-1003.
Shahnoushi, N., Danesh, S., Daneshvar, M., Moghimi, M., & Akbar, B. (2012). Welfare and environmental quality impacts of green taxes in Iran: A
computable general equilibrium model. African Journal of Business
Management, 6(9), 3539-3545.
Torvik, R. (2001). Learning by doing and the Dutch disease. European Economic
Review, 45(2), 285-306.
Wall Street Journal (2016). Cost of producing a barrel of oil and gas. Retrieved
from: http://graphics.wsj.com/oil-barrel-breakdown/
Wing, I. S. (2004). Computable general equilibrium models and their use in
economy-wide policy analysis. Technical Note, Joint Program on the
Wing, I. S. (2007). Computable general equilibrium models for the analysis of
energy and climate policies. Prepared for the International Handbook of
Energy Economics.
Wolf, C. (2009). Does ownership matter? The performance and efficiency of State
Appendix
Notations
Notation Explanation
j Sectors (representative firms)
h Primary inputs {labor, capital, mixed factor
Composite factor, produced in the first stage and used in the second stage by the j-th sector, Scaling coefficient in the composite factor production function,
The h-th factor used by the j-th firm in the first stage of the nesting structure, Share coefficient in the composite factor production function,
Price of the j-th composite factor, Price of the h-th factor,
Intermediate input of the i-th good used by the j-th sector
Input requirement coefficient of the i-th intermediate input for a unit output of the j-th good, Gross domestic output of the j-th sector,
Input requirement coefficient of the j-th composite good for a unit output of the j-th good, Price of the j-th gross domestic output,
Price of the i-th composite good.
Oil Related to OIL sector
Nonoil Related to all sectors other than OIL sector
NIOC National Iranian Oil Company which recognized as responsible of oil and gas upstream affairs
Direct taxes on firms like corporate tax,
Capital payments to NIOC (as a part of oil and gas revenues) Capital payments not to NIOC (as a part of oil and gas revenues) Corporate tax rate
Endowments of the h-th factor for the household, Production tax on the j-th good,
Production tax rate on the j-th good, Import tariff on the i-th good, Import tariff rate on the i-th good, Price of the i-th imported good, Imports of the i-th good,
Government consumption of the i-th good, Government share of primary factors income Transfer payments and cash subsidies to households Direct tax on households
Share of the i-th good in government expenditure (0≤μi≤1,∑μi =1), Price of the i-th composite good,
Government savings.
Demand for the i-th investment good,
Notation Explanation
Foreign exchange rate (domestic currency/foreign currency),
Current account deficits in foreign currency terms (or equivalently foreign savings), Sectors (firms) savings
Average propensity for savings by the household, Average propensity for savings by the government. Average propensity for savings by the firms Firms share of primary factors income Households transfer payments to firms Household income from abroad Household payments to abroad Household consumption of the i-th good,
Share parameter in the utility function (0≤αi≤1,∑αi =1). Export price in terms of domestic currency,
Export price in terms of foreign currency (exogenous), Import price in terms of domestic currency
Import price in terms of foreign currency (exogenous), Exports of the i-th good.
Labor income from abroad Capital income from abroad Labor payments to abroad Capital payments to abroad The i-th Armington composite good, The i-th domestic good,
Scaling coefficient in the Armington composite good production function,
δmi, δdi Input share coefficients in the Armington composite good production function
(0≤δmi≤1, 0≤δdi≤1, δmi+δdi=1),
Parameter defined by the elasticity of substitution, (ηi=((σi-1))⁄σi , ηi≤1), Elasticity of substitution in the Armington composite good production function, (σi=-(d(Mi⁄Di )/(Mi⁄Di ))⁄(d((pi^m)⁄(pi^d ))/((pi^m)⁄(pi^d ))) ).
Price of the i-th gross domestic output, Supply of the i-th domestic good,
Production tax on the i-th gross domestic output Scaling coefficient of the i-th transformation,
ξei , ξdi hare coefficients for the i-th good transformation, (0≤ξei≤1, 0≤ξdi≤1, ξei+ξdi=1),
Parameter defined by the elasticity of transformation, (ϕi=((ψi+1))⁄ψi , ϕi≥1),
Elasticity of transformation of the i-th good transformation, (ψi=(d(Ei⁄Di )/(Ei⁄Di ))⁄(d((pi^e)⁄(pi^d ))/((pi^e)⁄(pi^d ))) ). Output of each sector
NIOC share of OIL sector output
il and gas sector payments other than for capital