Int. J. Data Envelopment Analysis (ISSN 2345-458X) Vol.7, No.4, Year 2019 Article ID IJDEA-00422, 20 pages
Research Article
Evaluation of Strategic Performance with
Fuzzy Data Envelopment Analysis
M. Shafiee1, H. Saleh2*
(1) Industrial Management, Economic and Management Faculty, Shiraz Branch, Islamic Azad University, Shiraz, Iran
(2) Department of Mathematics, Central Tehran Branch, Islamic Azad University, Tehran, Iran
Received 12 April 2019, Accepted 24 October 2019 Abstract
This study intends to expand a set of proper performance evaluation indices which embraces strategies for sustaining top performance using SWOT analysis inside a balanced scorecard (BSC) outline for the large commercial bank branches in IRAN by operating a fuzzy Data Envelopment Analysis (FDEA). Through literature reviews and the banks’ experts and managers opinions and who have real practical experiences in the bank strategy planning, satisfactory performance evaluation indices have been selected throughout SWOT analysis. Then, utilizing the decision making trial and evaluation laboratory (DEMATEL) and analytic network process (ANP), respectively, further establishes the causality between the four BSC perspectives as well as the relative weights between evaluation indices. An empirical grading of the bank strategies is exemplified by applying fuzzy data envelopment analysis. The DEA model ranks the DMUs based on mathematical and scientific logic. Fuzzy DEA technique is utilized for ranking the branches.
Keywords: Strategic Performance, Analytic Network Process, Balanced Scorecard, DEMATEL, Fuzzy Data Envelopment Analysis.
*. Corresponding author: Email: [email protected], [email protected]
1. Introduction
In the express development of financial markets, commercial banks are facing great rivalry. Performance is no longer solely a financial issue. The traditional performance management ignores the nonfinancial factors and appears to be inadequate in understanding how to compute all-round performance to meet the banking needs of strategic development. In that instant, financial indicators can only reflect the performance of banks in the past and do not reflect the bank's outlook in service circumstances. It is usually followed by performance management, putting prominence on traditional assets, and passing over intangible assets. Banks’ fixed assets are important, but the banking sector is a knowledge intensive industry, and financial knowledge, intellectual resources and other intangible assets of banks are more imperative [1]. It is essential for the application of performance measurement that companies’ tangible and intangible targets are defined in a way that is more appropriate to the requirements and objects of these targets and that its strategy is more extensively operationalized, quantified, and linked in a mutually supplementing way [2].
As emphasized by Ghalayini and Noble [3], the literature concerning performance measurement has had two phases. In the first phase, which went on until the 1980s, the centre of attention was performance measurement based on the financial criteria supplied by the management accounting system. The second phase started in the late 1980s and is still proceeding. During this period of time much has changed within performance measurement and the interest in this field has increased tremendously. In the late 1980s, the limitations of the traditional way of measuring performance were clearly known and researchers started to talk about introducing new performance measures, such as shareholder value,
economic profit, customer satisfaction, internal operations performance, intellectual capital and intangible assets [4]. Organizations adopt strategic performance evaluation systems in their drive to evaluate and improve strategic efficiency and performance [5]. Several studies suggest the influence of strategic performance systems on company efficiency and performance [6]; [7]. The recent studies have stressed the role of motivational mechanisms in explaining the effect of strategic performance evaluation systems on managerial performance [6]; [8]; [9].
According to Luft [10], managers’ understanding of strategy and performance is based on using strategic performance systems. To have a strategic performance system, we must have several strategies. These strategies are defined based on the tangible and intangible targets of a company [2]. Today, in such a competitive environment, organizations have developed the performance evaluation system, as it is seen as being of strategic importance [2]. There are many studies about performance evaluations, some studies identified and defined both tangible and intangible targets as performance indexes [2]; [11]. These indexes were determined based on tangible and intangible targets [2]. We can say that tangible and intangible targets were reflected in strategies, and strategies were designed based on these targets. However, the number of studies about strategic performance and performance indexes based on strategies are very low. In the literature, there are few fuzzy logic methods aimed at evaluating the relative performance by multi-dimensions. So, the main purpose of this paper is to evaluate performance with the focus on strategy and strategy performance.
3
organization and are determined by strategic management. By applying strategic management; a manager can determine the strategies and how to implement them [5]. The organizations are then evaluated based on doing these strategies. We can say that the organizations that fulfill the strategies obtain a high degree of performance evaluation. So performance can be defined. Performance is doing the strategies better. The organizations performance is calculated by two concepts [5]:
- Understanding the strategies.
- Doing the strategies.
This idea is a new concept in organization performance evaluation. Most studies in efficiency and performance evaluation evaluate performance and efficiency based on historical data about the organization such as Golany and Storbeck [12], Avkiran [13], Kantor and Maital [14], Soteriou et al. [15], Cook et al. [16] and others. These studies have no strategic focus, but in this paper we focus on strategies and strategic performance. By applying this idea, we can determine and control the performance trend in the organizations. Several studies focus on evaluating performance based on Balanced Score Card (BSC) such as: Creamer [17], Kraus and Lind [18], Huang [19] and others. It must be mentioned that the BSC procedure is based on Vision and Strategies [20] and without understanding and determining the vision and strategies, organizations cannot evaluate their performances [20].
In this paper we determine the strategies of organization. To do this the strategic management procedure is used [21], while the strategies are determined by sing SWOT matrix [21]. So the strategies are designed based on vision and tangible and intangible targets. We then evaluate an organization’s performance based on doing these strategies. In the next step,
critical indices are selected for building up a performance evaluation model to suit Iranian bank branches properly and then the information is provided as a reference to increase their running effectiveness. The current article is comprised as follows, Section 2 provides a literature review, Section 3 introduces Performance evaluation framework and the proposed model in performance evaluation, Section 4 describes an empirical example for banking performance, including the hierarchical framework of BSC performance evaluation indexes and the result analyses and discussion to illustrate the proposed performance evaluation model. Section 6 is the conclusion. 2. Literature Review
There is a relatively small number of methods to make performance evaluation of units. The one chosen by management or decision makers for assessing performance depends on the status and type of the organization. However, the successful enterprises have some common features, including a specific vision, positive actions, and an effective performance evaluation.
navigate future competitive success. It includes more non-financial measures derived specifically from the organization’s strategy. BSC is one of the comprehensive and simplistic performance measurement tools that emphasizes both the aspects of the financial and non-financial, long-term and short-term strategies, and emphasizes internal and external business measures. The strongest point of BSC is its ability to illustrate the cause and effect relations between strategies and processes through four perspectives: “Financial perspective”; “Customer perspective”; “Internal business process perspective”; and “Learning and growth perspective". Based on this reasoning, to achieve its financial benefits, an organization has to take its customers’ needs and expectations into account, initially. In the most of the paper about the BSC, the relationship between these aspects are constant but Shafiee et.al. focused on this issue. The applied DEMATEL approach to solve this problem.
Decision Making Trial and Evaluation Laboratory (DEMATEL), which was developed by the Science and Human Affairs Program of the Battelle Memorial Institute of Geneva between 1972 and 1976, was utilized in the research and solving a group of complicated and intertwined problems. DEMATEL approach [22] can recognize the interactions among alternative systems and evaluation criteria, since it can calculate the impacts among criteria successfully. On the other hand, there is a potentiality by DEMATEL to separate a set of composite factors into dispatcher group and receiver group effectively, and also, conversion into an outstanding structural model. Using this method of utilization, we can easily extract the mutual relationships of interdependencies among various criteria and the strength of interdependence [23].
Although BSC is a power fill technique, it cannot specify efficient and inefficient unit. So a large number of researches have been conduct on this issue. In order to solve this issue, some researcher applied hybrid method especially, they applied DEA and BSC.
5
In the other methods, the analytic hierarchy process (AHP) and the analytic network process which possess qualitative and quantitative components (ANP), have been created by Professor Thomas Saaty [36]; [37]. The AHP offers a framework to aid managers in analyzing various factors, evaluating alternatives, as well as making final selections. As matter of fact, this approach combines complex and unstructured problem decomposition into a set of elements organized in a multilevel hierarchic form [36]. In reality, the conventional AHP, which is considered as criterion independence, is not suitable enough to analyze a multi criteria decision making problem since these criterions are not independent. Further, ANP is a generic form of AHP since it can take interdependent relationships into consideration, which results in the possibility of forming a network-like structural model, but in this research only a brief method description will be presented.
Step 1: Decision problem definition: As the first step, the problem character that will be solved should be well defined, since it will help in further levels decomposition down the structure up to the final level, as the usual scenarios or alternatives for selection.
Step 2: Super matrix formation by using criteria comparison: In order to compare the criteria in the whole system, the super matrix can be achieved via pair-wise comparisons by asking ‘‘How important is a criterion compared to another criterion with regard to our interests or preferences?’’ Conversely, the relative importance values of pair-wise comparisons can be classified from 1 (equal importance) to 9 (extreme inequality in importance) [36], [37]. Step 3: Super matrix calculation: The weighted super matrix is formed by all columns sum changes to unity exactly.
Next, via lim 𝑘→∞𝑤
𝑘, the weighted super matrix will be multiplied several times and then converge into a limiting super matrix with a constant value to obtain the global priority vectors or weights.
to its environment. SWOT analysis may be expanded by means of tools similar to those known as "portfolio management", such as the BCG matrix, to examine the validity of a strategy that has been proposed or is being applied, and to recommend changes where relevant. The classification of the different possibilities takes into account their feasibility (assets available "in house" = strengths and weaknesses), as well as their potential (attractive features in relation to the outside environment = opportunities and threats).
The implementation of a strategic approach such as SWOT analysis involves six steps:
1) "scan" of the environment of the program.
This step enables the detection of the major trends and problems likely to affect the future of the territory under consideration. Use should be made of socio-demographic, economic, political and physical indicators. Indicators of regional disparities and benchmarks are particularly useful for revealing opportunities and threats. This step should not be exhaustive as the aim is to obtain an overall picture to illustrate the key issues that the community in question will have to face.
2) The preparation of an inventory of possible actions.
The step involves the identification of possible actions, formulated in general terms, in relation to the main problems identified.
3) The external analysis of opportunities and threats.
This step consists of listing the parameters of the environment which are not under the direct control of the public authorities and which, it is assumed, will strongly influence socio-economic development. 4) Internal analysis of strengths and weaknesses.
This step involves making an inventory of the factors which are at least partly under
the control of the public authority, and which may either promote or hinder development.
5) Classification of possible actions. This step is aimed at highlighting those actions (strategic guidelines) most likely to reduce development problems by focusing on the strengths and reducing or even eliminating the weaknesses, with a view to maximizing opportunities and minimizing threats.
6) Evaluation of a strategy.
This optional step may be included if it is appropriate for judging the relevance of a strategy already being implemented or being planned. The step may be designed on the basis of a "portfolio of activities" analysis. Like a firm with its products and markets, a socio-economic program contains a set of interventions, some of which build on strengths and opportunities, while others try to compensate for weaknesses or to warn of threats. The evaluator should place interventions on a plane with two axes: (1) internal feasibility, strengths and weaknesses, and (2) external environment, opportunities and threats. The discussion of the map thus produced can be used to judge the relevance of strategy being evaluated.
3. Method
7
bank is made throughout Fuzzy DEA to grade the order among the organizations. On the other hand, based on the degree of accessing the banks’ determined strategies, its’ branches are ranked by means of fuzzy DEA. The analytical methods, DEMATEL, ANP, and fuzzy DEA employed by this research, are introduced in brief as follows.
In this proposal model, the organizations are ranked based on doing the strategies. So in the first stage, the organizations determine mission, vision and other components based on the strategic management shown in Fig1.
For determining the strategies, the organizations must determine the weaknesses, strengths (internal
environment), threats and opportunities (external environment). Then, they design the strategies with SWOT matrix. These strategies are financial and non-financial; so in this stage we combine SWOT matrix with four perspectives of BSC, the organizational performance can be evaluated with financial and non-financial indexes. Since the BSC is based on causal relationships, DEMATEL was used to determine these relationships in the next stage. These relationships organize an ANP structure. In the next stage, we used ANP to determine the strategies ranking. We rank the strategies with this ANP method.
Fig.1. Proposed performance evaluation model of EGTESADE NOVIN bank
We said that organizational performance is doing the strategies and the organizations
that fulfilled the strategies obtain high degree of performance evaluation. So we Combining SWOT matrix with four perspectives of a BSC
Determining the banks’ weaknesses, strengths, threats, opportunities and Determining SO, ST, WO and WT strategies
ANP
Analyzing relative weights of the strategies and Ranking SO, ST, WO and WT strategies
DEMATEL
Branches ranking from obtaining SO, ST, WO and WT strategies points of view
can define performance. Performance is doing the strategies better. Based on this definition, we want to rank organizational performance. Since the ANP strategies raking is obtained from the expert ideal, we use the DEA model. With the DEA model, we combine the expert ideals and mathematical logic, and avoid bias of expert ideals. So we use the ANP ranking to control weights in DEA models. Since the data about doing these strategies are qualitative, we use the fuzzy logic and design Fuzzy DEA model to rank the bank branches.
DEA Models
Let 𝑥𝑖𝑗 , 𝑖 = 1, … 𝑚 and 𝑌𝑟𝑗 𝑟 = 1, … , 𝑠 be the ith input and rth output, respectively, of the jth DMU, j = 1...n. The DEA model for measuring the relative efficiency of 𝐷𝑀𝑈𝑜 under an assumption of constant returns to scale is the CCR model [24]:
𝑀𝑎𝑥 ∑𝑠𝑟=1𝑢𝑟𝑦𝑟𝑜 S.t
∑𝑚𝑖=1𝑣𝑖𝑥𝑖𝑜= 1 (1) ∑𝑠𝑟=1𝑢𝑟𝑦𝑟𝑗− ∑𝑚𝑖=1𝑣𝑖𝑥𝑖𝑗≤ 0
𝑗 = 1, … , 𝑛
𝑢𝑟 ≥ 0 𝑟 = 1, … , 𝑘 𝑣𝑖 ≥ 0 𝑖 = 1, … , 𝑚
The following BCC input oriented value-based model, [25] can be used to assess efficiencies.
𝑀𝑎𝑥 ∑𝑠𝑟=1𝑢𝑟𝑦𝑟𝑜+ 𝑤 S.t
∑𝑚𝑖=1𝑣𝑖𝑥𝑖𝑜= 1 (2) ∑𝑠𝑟=1𝑢𝑟𝑦𝑟𝑗− ∑𝑚𝑖=1𝑣𝑖𝑥𝑖𝑗+ 𝑤 ≤ 0 𝑗 = 1, … , 𝑛
𝑢𝑟 ≥ 0 𝑟 = 1, … , 𝑘 𝑣𝑖 ≥ 0 𝑖 = 1, … , 𝑚
The standard DEA models have been formulated via the input and output data of DMUs. However, data sets are sometimes given without inputs, so the original input– output data cannot be easily recovered. Let 𝑌𝑟𝑗 𝑟 = 1, … , 𝑠 be the rth output of the jth DMU, j = 1...n. The DEA model for
measuring the relative efficiency of 𝐷𝑀𝑈𝑜 is as follows: [38], [39].
𝑀𝑖𝑛 𝑢0 𝑆. 𝑡
∑𝑆𝑟=1𝑢𝑟𝑦𝑟𝑗− 𝑢0 ≤ 0, 𝑗 = 1, … , 𝑛
∑𝑆𝑟=1𝑢𝑟𝑦𝑟0= 1 (3) 𝑢𝑟 ≥ 0, 𝑟 = 1, … , 𝑆
3.1 Fuzzy Numbers
A fuzzy set A in X is a set of ordered pairs: 𝐴 = {(𝑥 𝜇𝐴(𝑥))|𝑥 ∈ 𝑋}
𝜇𝐴(𝑥) is called the membership function of X in A. LR-fuzzy number 𝐴̃ can be described with the following membership function:
𝜇𝐴̃(𝑥) =
{
𝐿 (𝑚−𝑥𝛽 ) 𝑥 ≤ 𝑚 1 𝑚 ≤ 𝑥 ≤ 𝑚
𝑅 (𝑥−𝑚
𝛾 ) 𝑥 ≥ 𝑚
Where L,R:[0,1] ⟶ [0,1], with L(0)=R(0)=1 and L(1)=R(1)=0, are non-increasing, continuous shape functions. The LR-fuzzy number is denoted by 𝐴̃ = (𝑚, 𝑚, 𝛽, 𝛾). The α-cut set of 𝐴̃, denoted by 𝐴̃𝛼, is:
𝐴̃ = {𝑥: 𝜇𝛼 𝐴̃(𝑥) ≥∝}
And
𝑢(𝛼) = 𝑖𝑛𝑓{𝑥: 𝜇𝐴̃(𝑥) ≥∝} 𝑢(𝛼) = 𝑠𝑢𝑝{𝑥: 𝜇𝐴̃(𝑥) ≥∝}
Hence we have: 𝐴̃ = [𝑢(𝛼) 𝑢(𝛼)] 𝛼
The 𝛼-cut sets of a LR-fuzzy number can easily be computed as:
𝐴̃ = [𝑚 − 𝐿𝛼 −1(𝛼)𝛽, 𝑚 + 𝑅−1(𝛼)𝛾]; 𝛼 ∈ (0 1)
Theorem1. Let u be a fuzzy number and 𝑐(𝑢) a crisp point, then the function 𝐷(𝑢, 𝑐(𝑢)) with respect to 𝑐(𝑢) is
9
minimum value, if 𝑐(𝑢) = 𝑚(𝑢) and 𝑚(𝑢) is unique and
𝑚(𝑢) = 1/2 ∫ (𝑢(𝛼) + 𝑢(𝛼)) 𝑑𝛼01
Proof: See [40]
For arbitrary fuzzy numbers 𝑢 and 𝑣 𝑢 ≽ 𝑣 ⟺ 𝑚(𝑢) ≽ 𝑚(𝑣)
And
𝑢~𝑣 ⟺ 𝑚(𝑢) ≅ 𝑚(𝑣)
So
𝑢 ≽ 𝑣 ⟺ 𝑢 > 𝑣 𝑜𝑟 𝑢~𝑣
Theorem 2. Let 𝑢, 𝑣 be fuzzy numbers, therefore:
𝑚(𝑢 + 𝑣) = 𝑚(𝑢) + 𝑚(𝑣)
And
𝑚(𝜆𝑢) = 𝜆𝑚(𝑢).
Proof: See [40]
Proposed Fuzzy DEA Models
Consider the set of the DMUs including with fuzzy outputs. In fact, assume that we have a set of DMUs with fuzzy output vectors. So the fuzzy model with only outputs is:
𝑀𝑖𝑛 𝑢0 s.t
∑𝑆𝑟=1𝑢𝑟𝑦̃𝑟𝑗− 𝑢0≼ 0̃, 𝑗 = 1, … , 𝑛
∑𝑆𝑟=1𝑢𝑟𝑦̃𝑟0≅ 1̃ (4) 𝑢𝑟 ≥ 0, 𝑟 = 1, … , 𝑆
By using theorem 1 and theorem 2 we have:
𝑀𝑖𝑛 𝑢0 s.t
∑𝑆𝑟=1𝑢𝑟𝑚(𝑦̃𝑟𝑗) − 𝑚(𝑢0) ≼ 0̃, 𝑗 = 1, … , 𝑛
∑𝑆𝑟=1𝑢𝑟𝑚(𝑦̃𝑟0) ≅ 1̃ (5) 𝑢𝑟 ≥ 0, 𝑟 = 1, … , 𝑆
So we have: 𝑀𝑖𝑛 𝑢0
s.t
∑ 𝑢𝑟∫ (𝑦𝑟𝑗(𝛼) + 𝑦𝑟𝑗(𝛼)) 𝑑𝛼 − 1
0 𝑆
𝑟=1
𝑢0 ≤ 0, 𝑗 = 1, … , 𝑛 (6) ∑ 𝑢𝑟∫ (𝑦𝑟0(𝛼) + 𝑦𝑟0(𝛼))
1
0 𝑑𝛼 = 1
𝑆
𝑟=1
𝑢𝑟 ≥ 0, 𝑟 = 1, … , 𝑆
Consider the following changes of variable 𝑦̂𝑟𝑗= ∫ (𝑦𝑟𝑗(𝛼) + 𝑦𝑟𝑗(𝛼)) 𝑑𝛼
1
0
Therefore, we have 𝑀𝑖𝑛 𝑢0
s.t
∑𝑆𝑟=1𝑢𝑟𝑦̂𝑟𝑗− 𝑢0 ≤ 0,
𝑗 = 1, … , 𝑛 (7) ∑𝑆𝑟=1𝑢𝑟𝑦̂𝑟0= 1
𝑢𝑟 ≥ 0, 𝑟 = 1, … , 𝑆
4. Finding
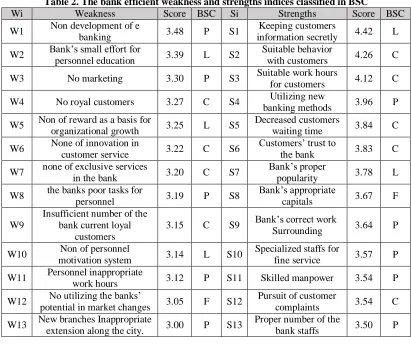
In accordance with the proposed performance evaluation model shown in Fig. 1, this study conducts an empirical analysis by taking six branches of Iranian Eghtesade Novin bank. By reviewing the related backgrounds of efficient indices on an internal and external bank’s environment, 43 and 26 efficient indices about the bank’s internal and external environment have been acquired respectively. By making further inquiries, key indices were recognized and we request from supervisors and bank staff that they determine the degrees of significance of all previously mentioned indices (5 shows high important indices and 1 means low significant indices). Then, as illustrated in Tables 2 and 3, once an index has a mean upper than 2.5 degrees of significance, it was chosen as an efficient index and all of these indices were categorized into BSC perspectives. In the following tables’ BSC column, the letters P, L, C and F are brought into play as four BSC perspectives (internal process, learning and growth, customers and
(15)
financial) respectively. The summary of calculations is as follows.
Table 2. The bank efficient weakness and strengths indices classified in BSC
Wi Weakness Score BSC Si Strengths Score BSC
W1 Non development of e
banking 3.48 P S1
Keeping customers
information secretly 4.42 L
W2 Bank’s small effort for
personnel education 3.39 L S2
Suitable behavior
with customers 4.26 C
W3 No marketing 3.30 P S3 Suitable work hours
for customers 4.12 C
W4 No royal customers 3.27 C S4 Utilizing new
banking methods 3.96 P
W5 Non of reward as a basis for
organizational growth 3.25 L S5
Decreased customers
waiting time 3.84 C
W6 None of innovation in
customer service 3.22 C S6
Customers’ trust to
the bank 3.83 C
W7 none of exclusive services
in the bank 3.20 C S7
Bank’s proper
popularity 3.78 L
W8 the banks poor tasks for
personnel 3.19 P S8
Bank’s appropriate
capitals 3.67 F
W9
Insufficient number of the bank current loyal
customers
3.15 C S9 Bank’s correct work
Surrounding 3.64 P
W10 Non of personnel
motivation system 3.14 L S10
Specialized staffs for
fine service 3.57 P
W11 Personnel inappropriate
work hours 3.12 P S11 Skilled manpower 3.54 P
W12 No utilizing the banks’
potential in market changes 3.05 F S12
Pursuit of customer
complaints 3.54 C
W13 New branches Inappropriate
extension along the city. 3.00 P S13
Proper number of the
bank staffs 3.50 P
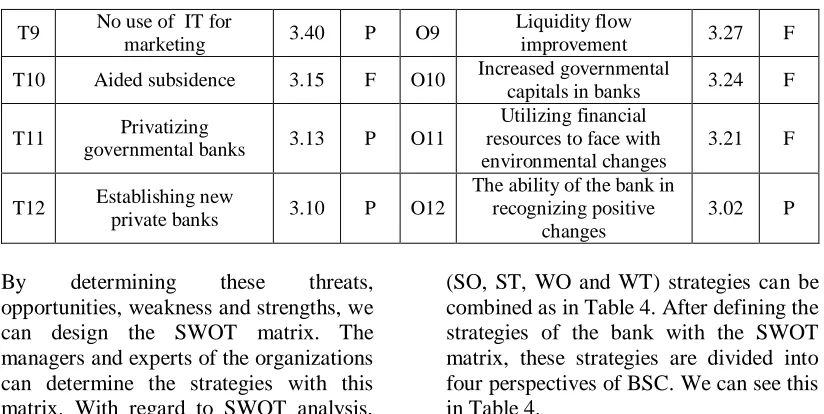
Table 3. The bank efficient threats and opportunities indices classified in BSC
Ti Threats Score BSC Oi Opportunities Score BSC
T1 Economic sanction 4.32 F O1 Highly reputed customers 4.38 C
T2 Country’s economic
condition 4.18 F O2
Increased demand deposit
profit rate 3.92 F
T3 Bank’s inactivity in
international markets 3.84 P O3
regulating bank and
economic systems 3.85 P
T4 Governmental influence
via central banks 3.84 P O4
Assigning banks monetary
resources to feasible plans 3.80 F
T5 Increased governmental
liabilities to the bank 3.83 F O5 Privatizing 3.62 P
T6 Increased inflation rate 3.56 F O6 Customer awareness of other bank’s services 3.56 C
T7 The banks’ increased
liabilities 3.56 F O7
Decreasing bank’s
liabilities to central bank 3.52 F
T8
Disappointed customers on future economic
conditions
3.42 C O8 Governmental banks
11 T9 No use of IT for
marketing 3.40 P O9
Liquidity flow
improvement 3.27 F
T10 Aided subsidence 3.15 F O10 Increased governmental
capitals in banks 3.24 F
T11 Privatizing
governmental banks 3.13 P O11
Utilizing financial resources to face with environmental changes
3.21 F
T12 Establishing new
private banks 3.10 P O12
The ability of the bank in recognizing positive
changes
3.02 P
By determining these threats, opportunities, weakness and strengths, we can design the SWOT matrix. The managers and experts of the organizations can determine the strategies with this matrix. With regard to SWOT analysis,
(SO, ST, WO and WT) strategies can be combined as in Table 4. After defining the strategies of the bank with the SWOT matrix, these strategies are divided into four perspectives of BSC. We can see this in Table 4.
Table 4. The bank strategies classified in BSC
NO SO Strategies Description BSC
Perspective
S1 S8,O4 Assigning the banks’ financial
resources to feasible economic plans. F S2 S2,S3,S4,S5,S6,S7,O1,O6 Value creating for customers C
NO ST Strategies Description BSC
Perspective
S3 S1,S2,S3,S5,S6,S7,T1,T8,T11,T12 Keeping current customers and
attempting for gaining new customers C
S4 S10,S11,S4,T9.T3 Increasing number of active personnel
in IT P
NO WO Strategies Description BSC
Perspective
S5 W11,W13,O1,O6
Decreasing the amount of branches and focus on giving services to rich
customers
C
S6 W3,W9,O1,O2,O6 Appropriate and efficient advertising P
S7 W1,W6,W7,O1.O6,O8,O12 Innovation in services and exclusive
services L
S8 O11,O12,W12,W13 Concurrent changing with capital
market changes F
S9 W2,W8.W10.O3
endeavor for personnel education and designing motivation and reward system and creating loadstone jobs
L
NO WT Strategies Description BSC
Perspective
S10 W13,W11,T1,T3,T11.T12 Expanding the number of branches
and adjusting banks’ work hours P
At continue, relationships among BSC’s perspectives are determined by employing the DEMATEL technique. After putting BSC’s perspectives across the bank, a propos 18 checklists were distributed among specialists and the bank managers, and they were requested to distinguish the effect of each of the four BSC’s perspectives to BSC’s other perspectives. For recognizing relationships among BSC’s perspectives some steps are mandatory.
Step 1: Defining elements and determining relations. Specialists and the banks managers’ ideas are gathered in this stage and proficient indices of each BSC’s perspectives are determined as illustrated in Tables 5, 6, 7 and 8. Then, DEMATEL
is used to develop a total-relation matrix of the four evaluations.
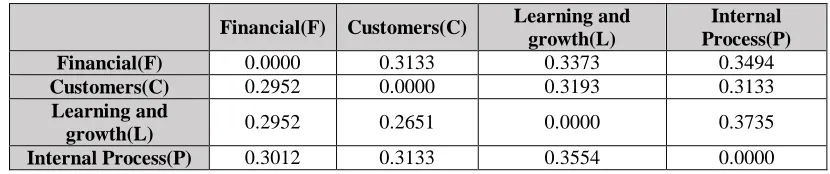
Step 2: Establishing a direct relation matrix X. Ideas gathered from step1 are abridged in a (4×4) matrix, that is to say, the Z (4×4) matrix as shown in Table 5. The numbers inside the matrix demonstrate the influential degrees between one perspective and the others. Step 3: Calculating direct normalized relation matrix. By means of equation (2) normalized direct matrix is created as in Table 6.
Step 4: Computing total-relation (direct/indirect) matrix. By introducing normalized matrix T and utilizing Eqs. (3), (4) and (5) total-relation matrix T is obtained as presented in Table 7.
Table 5. Direct relation matrix X between perspectives
Financial(F) Customers(C) Learning and growth(L)
Internal Process(P)
Financial(F) 0.0000 2.8889 3.1111 3.2222
Customers(C) 2.7222 0.0000 2.9444 2.8889
Learning and
growth(L) 2.7222 2.4444 0.0000 3.4444
Internal Process(P) 2.7778 2.8889 3.2778 0.0000
Table 6. Normalized direct relation matrix X
Financial(F) Customers(C) Learning and growth(L)
Internal Process(P)
Financial(F) 0.0000 0.3133 0.3373 0.3494
Customers(C) 0.2952 0.0000 0.3193 0.3133
Learning and
growth(L) 0.2952 0.2651 0.0000 0.3735
Internal Process(P) 0.3012 0.3133 0.3554 0.0000
Table 7. Total-relation (direct/indirect) matrix T
Financial(F) Customers(C) Learning and growth(L)
Internal Process(P)
Financial(F) 5.3570 5.5892 6.1580 6.2722
Customers(C) 5.2850 5.0510 5.8169 5.9150
Learning and
growth(L) 5.3170 5.2936 5.6109 5.9854
Internal Process(P) 5.4602 5.4606 6.0267 5.8696
13
Note: Numbers in bold are the perspectives which reach the threshold (5.6001). In order to find the influential relation between the evaluation perspectives, the median (5.6001) is put as the threshold in this research. As the value reaches or exceeds the threshold, the perspective is then considered to be more influential than the others. In this case, the value reaches or goes over the threshold in the total-relation matrix T (Table 7) is shown in bold. The construction of an ANP networked level framework is based on the total-relation matrix T. By using Eqs. (6) and (7) as shown in Table 8, the total amount of each row is presented by Di and the total amount of each column is presented by Rj. The horizontal axis (Di+Rj) presents the influential degrees of relations between elements, but vertical axis (Di-Rj) represents the influential degrees of relations between one element
and the other elements in the proposed BSC framework as illustrated in Figure 2. Concerning Table 8, it is observed that the biggest influential value (1.9572) is selected from one of the perspectives toward “Financial’’ that has the highest value of (Di-Rj).
Step 5: Drawing causal diagram. As shown in Table 8, (D + R) is X-axis and (D - R) is Y-axis. Taking Financial, Customer, Internal process and Learning and growth, the relation of these four perspectives reaches the Threshold. Drawing a causal diagram as in Fig. 3, it is clear that financial and learning (growth) perspectives are the main and trivial perspectives respectively. Based on the above cause & effect diagram, the relation among the four BSCs’ perspectives is as shown in Fig 3.
These relationships organize an ANP structure. This structure is shown in Fig 3.
Table 8. Total-relation matrix with (Di + Ri) and (Di-Ri) RANK
X-axis, 𝑫𝒊 + 𝑹𝒋
Y-axis, 𝑫𝒊 - 𝑹𝒋
RANK
Financial(F) 3
44.7956 1.9572
1
Customers(C) 4
43.4623 0.6735
2
Learning and growth(L) 2
45.8194 -1.4056
4
Internal Process(P) 1
46.8593 -1.2251
3
Fig 2. Total-relation matrix with (Di + Ri) and (Di-Ri)
P L
C F
-2 -1.5 -1 -0.5 0 0.5 1 1.5 2 2.5
43 43.5 44 44.5 45 45.5 46 46.5 47 47.5 DEMATEL
Figure 3. ANP networked evaluation structure
After applying of DEMATEL to analyze the mutual influential of BSC perspectives, we use the ANP questionnaire. In this study we use the opinions of experts. Data about expert ideals were collected and then entered into ANP software of Super Decision to obtain strategies ranking.
With regard to SWOT analysis, four (SO, ST, WO and WT) strategies can be combined as in Table 4. After defining the strategies of the bank (Table 4), the relation between elements is judged by professionals subjectively. The checklist is
based on comparing strategies from each pair of strategies and it is represented by numbers from 1 to 9 to present ‘‘equal importance’’ to ‘‘very high importance’’ Geometric mean of specialists and the bank managers’ opinions about the importance of each strategy in comparison to other strategies through pair-wise comparison is illustrated in Table 9. After normalizing the aforementioned gathered specialists and the bank managers’ opinions, we ranked the strategies based on ANP method. These strategies ranks are shown in Table 10.
S11 S10 S9 S8 S7 S6 S5 S4 S3 S2 S1 Si 0.236 7 1.292 0 0.233 0 0.231 3 0.190 5 0.643 4 1.885 2 2.827 5 0.896 0 1.433 9 1.000 0 S1 0.248 4 0.931 9 0.250 3 0.408 2 0.353 5 0.637 6 1.582 4 0.945 6 0.567 4 1.000 0 0.697 4 S2 0.270 8 1.401 6 0.277 9 0.290 5 0.257 0 0.357 7 1.597 1 0.655 5 1.000 0 1.762 5 1.116 1 S3 0.250 0 0.327 7 0.275 7 0.251 4 0.167 1 0.262 3 1.399 4 1.000 0 1.525 5 1.057 6 0.353 7 S4 0.202 1 0.788 2 0.289 4 0.292 4 0.235 4 0.289 1 1.000 0 0.714 6 0.626 1 0.632 0 0.530 4 S5 0.323 9 1.182 2 0.324 7 0.260 3 0.584 9 1.000 0 3.458 7 3.812 0 2.795 6 1.568 3 1.554 3 S6 0.414 4 1.358 0 0.405 6 0.675 7 1.000 0 1.709 6 4.248 0 5.985 8 4.052 4 2.828 7 5.250 6 S7 0.706 2 1.057 6 0.531 5 1.000 0 1.479 9 3.841 5 3.419 7 3.978 0 3.441 8 2.449 5 4.324 2 S8 1.031 3 1.465 6 1.000 0 1.881 3 2.465 3 3.079 9 3.455 9 3.626 7 3.598 9 3.995 5 4.291 1 S9 S4 S6 S10 S11 F C L P S1
S8 S7
S9
15
Table 9. Geometric mean of the bank managers’ opinions
Table10. The banks’ strategies ranking with ANP method
Rank 1 2 3 4 5 6 7 8 9 10 11
Strategies S9 S11 S8 S7 S10 S6 S3 S1 S2 S4 S5
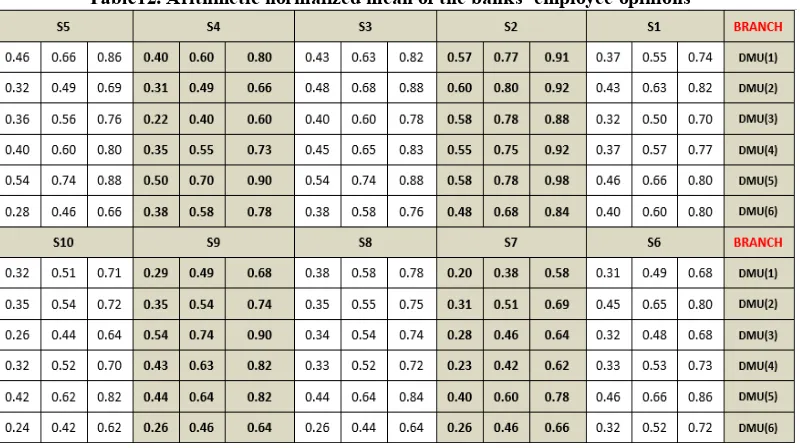
As a final point, a fuzzy questionnaire was designed. It was represented by linguistic variables to present ‘‘very bad’’ to ‘‘very good’’. To more clearly illustrate the quantity of the banks’ strategy accessibilities, it was entreated from the banks’ employees to sort the banks’ branches. Arithmetic normalized mean of the banks’ employee opinions is considered as fuzzy weights as follows:
Now, we apply proposed fuzzy DEA model for strategic efficiency of 6 branches of Iranian banks. We use the strategies rank for weight restrictions of the DEA model. Model (7) with restricted multiplier transformed to the following model:
Table11. Fuzzy Number Very Bad 0 0 2
Bad 0 2 4
Relatively Bad 2 4 6 Relatively Good 4 6 8 Good 6 8 10 Very Good 8 10 10
Table12. Arithmetic normalized mean of the banks’ employee opinions
0.427 4 1.000
0 0.682
3 0.945
6 0.736
4 0.845
9 1.268
7 3.051
4 0.713
5 1.073
1 0.774
0
S1 0
1.000 0 2.339
9 0.969
6 1.416
0 2.413
2 3.087
6 4.949
2 1.416
0 3.693
4 4.026
4 4.225
5
𝑀𝑖𝑛 𝑢0 𝑠. 𝑡
∑𝑆𝑟=1𝑢𝑟𝑦̂𝑟𝑗− 𝑢0≤ 0, 𝑗 = 1, … , 𝑛
∑𝑆𝑟=1𝑢𝑟𝑦̂𝑟0= 1 𝑢𝑟 ≥ 0, 𝑟 = 1, … , 𝑆 𝑢9≥ 𝑢11
𝑢11≥ 𝑢8 (8) 𝑢8 ≥ 𝑢7
𝑢7 ≥ 𝑢10 𝑢10≥ 𝑢6 𝑢6 ≥ 𝑢3 𝑢3 ≥ 𝑢1 𝑢1≥ 𝑢2 𝑢2 ≥ 𝑢4 𝑢4 ≥ 𝑢5
Now we apply this model for strategic performance. Note that in this case, we have no inputs and the proposed model is based on only fuzzy outputs. By applying
the model (20), we obtained the results which are shown in Table 13.
As can be seen in Table 13, the strategic performance ranking of DMUs is:
𝐷𝑀𝑈6≫ 𝐷𝑀𝑈1≫ 𝐷𝑀𝑈2≫ 𝐷𝑀𝑈4≫ 𝐷𝑀𝑈3≫ 𝐷𝑀𝑈5
A manager can understand the strategic situation with these results. Since understanding the strategies is a major step in applying them, we can say that these results are reliable. On the other hand, using the ANP method or the same subjective methods for strategic ranking is based on managers judgments. So these results may be biased, since the ranking of DMUs with DEA models is based on scientific method. We combine the ANP method with DEA model to determine the correct weights of the indexes. Hence, these results are more reliable.
Table13. Results of strategic performance
No. of DMUs Performance Evaluation Performance Ranking
𝑫𝑴𝑼𝟏 1.2162 2
𝑫𝑴𝑼𝟐 1.1107 3
𝑫𝑴𝑼𝟑 1 5
𝑫𝑴𝑼𝟒 1.0844 4
𝑫𝑴𝑼𝟓 1 6
𝑫𝑴𝑼𝟔 1.2301 1
5. Discussion and Conclusions
In this study, we proposed a framework for strategic performance evaluation. Managers can determine and control the performance trend in their organizations with this evaluation framework. There are
17
evaluation of performance. In step 1, we determined the weaknesses, strengths, threats and opportunities of organizations. We then divided these measures to four perspectives of the BSC model. It must be mentioned that, organizations must do the strategic management process to obtain their weaknesses, strengths, threats and opportunities. In the next step, the SWOT matrix is used to determine strategies of organization and then these strategies are divided into four perspectives of BSC. In the next step we use the DEMATEL technique to create the relationships among the four perspectives of BSC. We can determine an ANP structure using the DEMATEL technique. In the next step, we use ANP method to rank the strategies and, finally, based on doing these strategies, the DMUs were ranked with fuzzy DEA model. Since we have only outputs in performance evaluation, we use the DEA model with only outputs. We must say that, since the ANP method and the same subjective methods are based on managers and expert ideal; we combine the ANP method with the DEA model to obtain the correct ranking of DMUs, because the DEA model is based on mathematical logic and far from managers and experts bias.
So this framework applies to the strategic performance of 6 bank branches in Iran. The results show that the bank branches ranking is:
References
[1] Zhang Y., Li L. (2009). Study on Balanced Scorecard of Commercial Bank in Performance Management System. Proceedings of the 2009 International Symposium on Web Information Systems and Applications (WISA’09) Nanchang, P. R. China, May 22-24, 206-209.
[2] Chi Sun, C. (2010). A performance evaluation model by integrating fuzzy AHP and fuzzy TOPSIS methods. Expert Systems with Applications. 37:7745-7754. [3] Ghalayini, A.M. and Noble, J.S. (1996). The changing basis of performance measurement. International Journal of Operations & Production Management, 16(8): 63-80.
[4] Neely A., Bourne M. (2000). Why measurement initiatives fall. Measuring Business Excellence. 4(4): 3-7.
[5] Aranda C., Arellano J. (2010). Strategic performance measurement systems and managers understanding of the strategy, A field research in an financial institution. Journal of Accounting and Organizational Change. 6(3): 330-358.
[6] Webb, R. (2004), “Managers’ commitment to the goals contained in a strategic performance measurement system”, Contemporary Accounting Research, Vol. 21 No. 4, pp. 925-58. [7] Ittner, C., Larcker, D. and Randall, T. (2003b), “Performance implications of strategic performance measurement in financial services firms”, Accounting, Organizations and Society, Vol. 28 Nos 7/8, pp. 715-41.
[8] Hall, M. (2008), “The effect of comprehensive performance measurement
systems on role clarity, psychological empowerment and managerial performance”, Accounting, Organizations and Society, Vol. 33 Nos 2/3, pp. 141-63. [9] Burney, L.L., Henle, C.A. and Widener, S.K. (2009), “A path model examining the relations among strategic performance measurement system characteristics, organizational justice, and extra- and in-role performance”, Accounting, Organizations and Society, Vol. 34 Nos 3/4, pp. 305-21.
[10] Luft, J. (2004), “Discussion of managers’ commitment to the goals contained in a strategic performance measurement system”, Contemporary Accounting Research, Vol. 21 No. 4, pp. 959-64.
[11] Chin, K.-S., Pun, K.-F., Lau, C.-S., & Lau, H. (2001). Performance improvement of international roaming service. Benchmarking, 8(2), 120–131.
[12] Golany, B. and Storbeck, J.E. (1999), “A data envelopment analysis of the operational efficiency of bank branches”, Interfaces, Vol. 29 No. 3, pp. 14-26. [13] Avkiran, N.C. (1999), “The evidence on efficiency gains: the role of mergers and the benefits to the public”, Journal of Banking & Finance, Vol. 23 No. 7, pp. 991-1013.
19
[16] Cook, W.D., Hababou, M. and Tuenter, H.J. (2000), “Multicomponent efficiency measurement and shared inputs in data envelopment analysis: an application to sales and service performance in bank branches”, Journal of Productivity Analysis, Vol. 14, pp. 209-24.
[17] Creamer G., Freund Y. (2010). Learning a board Balanced Scorecard to improve corporate performance. Decision Support Systems. 49 (4): 365-385.
[18] Kraus K., Lind J. (2010). The impact of the corporate balanced scorecard on corporate control—A research note. Management Accounting Research, 21(4): 265-277.
[19] Huang H.C. (2009). Designing a knowledge-based system for strategic planning: A balanced scorecard perspective. Expert Systems with Applications. 36(1): 209-218.
[20] Kaplan, R. S., & Norton, D. (1996). Using the balanced scorecard as a strategic management system. Harvard Business Review, 74(1), 75–85.
[21] David F.R. (2008). Strategic Management: Concepts and Cases (12th Edition). Prentice Hall. ISBN-10: 0-13-601570-0
[22] Fontela E., Gabus A. (1976). Current Perceptions of the World Problematique. In: World Modelling: A Dialogue C.W. Churchman and R.O. Mason (ed.), Amsterdam, Oxford, North-Holland Publishing Company.
[23] Tamura H., Akazawa K. (2005). Stochastic DEMATEL for struc- tural modeling of a complex problematique for realizing safe, se- cure and reliable society.
J. Telecommun. Inform. Technol., no. 4, pp. 139–146, 2005.
[24] Charnes, A., Cooper, W.W and Rhodes, E., (1978). Measuring the efficiency of decision making units, European journal of operational research, Vol2, No 6, 44-429.
[25] Banker, R. and Charnes, A. and Cooper, W.W. (1984), “Some models for estimating technical and scale inefficiencies in data envelopment analysis”, European Journal of Operational Research, 9, 1078-1092. [26] Hosseinzadeh Lotfi, F., Navabakhs, M., Tehranian, A., Rostamy-Malkhalifeh. M., R Shahverdi. (2007). Ranking bank branches with interval data the application of DEA. International Mathematical Forum 2 (9), 429-440.
[27] Barzegarinegad, A., Jahanshahloo, G. R., Rostamy-Malkhalifeh, M. (2014). A full ranking for decision making units using ideal and anti-ideal points in DEA The Scientific World Journal. 1-8.
[28] Kao C., Liu S.T., (2000). Fuzzy efficiency measures in data envelopment analysis. Fuzzy Sets and Systems. 113: 427-437
Science. 212, 1-9
[32] Ghobadi, S., Jahanshahloo, G. R., Hosseinzadeh Lotfi, F. Rostamy-Malkhalifeh, M. (2014). Dynamic inverse DEA in the presence of fuzzy data. Advances in Environmental. Biology 8 (24), 139-151.
[33] Peykani, P., Mohammadi, E., Pishvaee, M.S., Rostamy-Malkhalifeh, M., Jabbarzadeh, A. (2018). A novel fuzzy data envelopment analysis based on robust possibilistic programming: possibility, necessity and credibility-based approaches, (2018), RAIRO-Operations Research, 52(4), 1445-1463.
[34] Peykani, P., Mohammadi, E., Emrouznejad, A., Pishvaee, M.S., Rostamy-Malkhalifeh, M. (2019). Fuzzy data envelopment analysis: an adjustable approach, Expert Systems with Applications, 136, 439-452.
[35] Peykani, P., Mohammadi, E., Rostamy- Malkhalifeh, M., Hosseinzadeh Lotfi, F. (2019). Fuzzy data envelopment analysis approach for ranking of stocks with an application to Tehran stock exchange, (2019), Advances in Mathematical Finance and Applications, 4(1), 31-43.
[36] Saaty, T. L. (1980). The analytic hierarchy process. New York: McGraw-Hill.
[37] Saaty, T. L. (1996). The analytic network process. New York: McGraw-Hill.
[38] Liu W.B., Zhang D.Q., Meng W., Li X.X., Xu F. (2011). A study of DEA models without explicit inputs. Omega. 39: 472-480.
[39] Liu W.B, Sharp J, Wu ZM. (2006). Preference, production and performance in data envelopment analysis. Annals of
Operations Research. 145:105–27.