Please cite this article as: O. V. Chernoyarov, L. A. Golpaiegani, A. N. Glushkov, V. P. Lintvinenko, B. V. Matveev, Digital Binary Phase-Shift Keyed Signal Detector, International Journal of Engineering (IJE), IJE TRANSACTIONS A: Basics Vol. 32, No. 04, (April 2019) 510-518
International Journal of Engineering
J o u r n a l H o m e p a g e : w w w . i j e . i rDigital Binary Phase-shift Keyed Signal Detector
O. V. Chernoyarova,b,c, L. A. Golpaiegani*c, A. N. Glushkovd, V. P. Lintvinenkoe, B. V. Matveeve
a International Laboratory of Statistics of Stochastic Processes and Quantitative Finance, National Research Tomsk State University, Tomsk,
Russia
b Department of Higher Mathematics and System Analysis, Maikop State Technological University, Maikop, Russia c Department of Electronics and Nanoelectronics, National Research University “MPEI”, Moscow, Russia
d Department of Infocommunication Systems and Technologies, Voronezh Institute of the Ministry of Internal Affairs of the Russian Federation,
Voronezh, Russia
e Department of Radio Engineering, Voronezh State Technical University, Voronezh, Russia
P A P E R I N F O
Paper history:
Received 26 September 2018
Received in revised form 17 February 2019 Accepted 07 March 2019
Keywords: Phase-shift Keying Signal Detection Fast Digital Processing Noise Interference Interference Immunity
A B S T R A C T
We have developed the effective algorithm for detecting digital binary phase-shift keyed signals. T his algorithm requires a small number of arithmetic operations over the signal period. It can be relatively easy implemented based on the modern programmable logic devices. It also provides h igh interference immunity by identifying signal presence when signal-to-noise ratio is much less that its working value in the receiving path. The introduced detector has intrinsic frequency selectivity and allows us to form the estimate of the noise level to realize the adaptive determination of decision threshold. In order to get confirmation of the detector operability and performance, we suggest the expressions for false alarm and missing probabilities. In addition, we have examine, both theoretically and experimentally, the influence of the detector parameters on its characteristics.
doi: 10.5829/ije.2019.32.04a.08
1. INTRODUCTION1
In a number of radio engineering applications, it is necessary to detect the binary phase-shift keyed (PSK) radio signals [1-6]. Analog PSK signal detectors are described in literature [7-9]. Their disadvantages are complexity of implementation of analog frequency multipliers and high-stable narrow-band frequency filters. Digital signal proces sing increases opportunities for designing both the effective signal detection algorithms and the corresponding electronics. However, applying the common approaches for digital detection involves a large number of arithmetic operations to deal with each of the received signal samples that implies the use of expensive high-speed hardware.
On the basis of the fast digital algorithm for coherent processing of narrow-band signals [10, 11], we now introduce the simple digital PSK signal detector that
*Corresponding Author’s Email: [email protected] (L. A. Golpaiegani)
requires a small number of arithmetic operations over the signal period and can be efficiently implemented by means of modern programmable logic devices [12, 13].
2. PHASE-SHIFT KEYED SIGNALS
In digital communication systems, the binary PSK and differential PSK signals are widely applied [5, 6]. The ideal binary PSK signal takes the form of following expersion:
t Scos
2f0t
t 0
s (1)
where the signal parameters are: S is the amplitude,
0 0 1T
f is the carrier frequency, T0 is the period,
t a
tand N0 is the number of carrier periods over the information symbol.
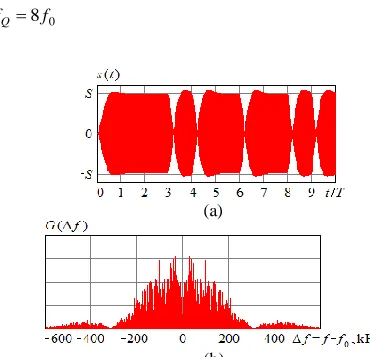
At the output of the narrowband transmission path, the signal remains the PSK one, however the change of its amplitude appears at the boundaries of the information packages. This effect is shown in Figure 1a under f0 10 MHz, N0 32, while the signal spectrum has the form presented in Figure 1b,
0 0 f f
f
, its bandwidth is equal to 625 kHz and the path pass band fs at the level of 3 dB is the same.
3. SIGNAL PROCESSING
What is peculiar about the binary PSK signal is that we have elimination of phase modulation while frequency is doubled. This phenomenon, with the subsequent frequency division, is applied in phase lockers implemented according to Pistolkors’ circuit [14].
To detect the PSK signal, it is necessary to arrange the frequency multiplication only, with the subsequent narrow-band filtration and estimation of the signal level at the frequency 2f0. Thus, the useful component is extracted and the estimate of the interference level is made by rejector filtration, which leads to the decision formed concerning either presence or absence of the input PSK signal. Such processing procedure is used in analog PSK signal detectors [7-9].
4. DIGITAL PSK SIGNAL DETECTOR
The block diagram of the fast digital binary PSK signal detector is presented in Figure 2. The input PSK signal is passed to the analog-to-digital converter (ADC). The ADC sampling rate fQ is determined by clock generator
(CG) and is equal to:
0
8f
fQ (2)
(a)
(b)
Figure 1. PSK signal and its spectrum
Figure 2. Digital PSK signal detector
The samples si are fed from the ADC output to the frequency multiplier (FM) at the times ti, where i is the number of the sample. The digital multiplier (DM) presented in Figure 3a can be used as FM, and then the DM output sample xi is equal to the square of the input sample. For ideal PSK signal (1), we get
0 0
22
0 0
2 2 2
2 4 cos 5 . 0 5 . 0
2 cos
i i i
i
t f S S
t t f S
s x
(3)
Thus, the high-frequency response of the multiplier is the harmonic oscillation with the frequency 2f0 which does not depend on the modulating signal. For actual PSK signals, the FM response will be much more narrow-band than the input signal.
In order to double the frequency (to form the second harmonic of the input signal), we can use simpler, but less effective input sample module operation (Figure 3b):
2 0 0
cos
s S ft t
xi i i (4)
However, in this case, other unwanted high-frequency harmonics happen to be present in the spectrum of the FM response. Therefore, further, we are to use the quadratic transformation (3) for doubling the signal frequency.
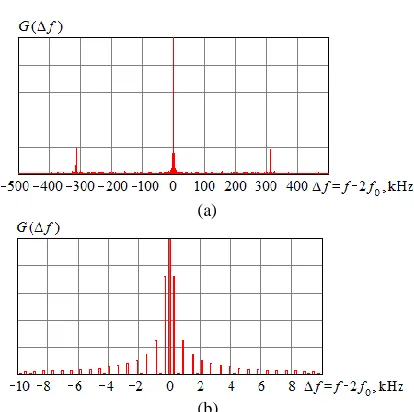
In Figure 4a, we can see the signal spectrum at the FM output in the neighborhood of the double frequency
0
2f , while the interferences are absent and the input signal takes the form presented in Figure 1. In Figure 4b, the segment of this spectrum is selected close to the point 2f0. Here
0
2f f f
(5)
is the frequency detuning. As it follows from Figure 4, the FM output signal is a very narrow-band one.
a) b)
(a)
(b)
Figure 4. The signal spectrum at the output of the frequency multiplier
In SUM01 that is a summator of QPC0 unit, the
difference
x0x2
is added to the very same difference but calculated at the previous period of the second harmonic and thus saved earlier into the multibit one cell shifter MR01. Further, in SUM02, the obtainedsum of the adjacent differences
x0x2
is added to the value from the multibit three cell shifter MR02calculated earlier for the previous pair of periods. As a result, at the output of the SUM0n summator, we get
1 0 2 0 0 N k k i k i i x xy (6)
Here nlog2N, N is the number of the second harmonic periods through which the averaging of the even samples differences is carried out and i is the number of the current period of the PSK signal second harmonic.
The QPC1 unit operates likewise and at the output of the SUM1n summator we obtain the accumulated sum
1 0 3 1 1 N k k i k i i x xy (7)
The samples differences in the quadrature channels are time shifted by the quarter-period of the s econd harmonic (equivalent to the phase shift by 900). Then, it is easy to show that for the ideal PSK signal the value
2 1 2
0i i
i y y
z (8)
at the output of the quadratic block QT1 is constant and equal to
2
2NS
zi (9)
Here S2 is the amplitude of the input signal second
harmonic which is equal to 0.5S2 while applying the quadratic transformation (3).
In order to estimate the interference level at the reception path, it is necessary to suppress the signal central frequency at the FM output (Figure 3b) and to extract the remaining frequency components. For this purpose, by means of the SUB01 and SUB11
substractors, the values
1 2 2 0 1 2 0 2 0 0 N N k k i k i N k k i k ii x x x x
y
1 2 3 1 1 2 0 3 1 1 N N k k i k i N k k i k ii x x x x
y
(10)
are formed and on that basis the response at the output of the quadratic block QT2
2 1 2
0i i
i y y
z (11)
is generated. With the help of Equation (11), the threshold z0 is calculated by averaging the responses of
the interference estimate channel over M0 2m
samples with the weighting coefficient α:
1 0 0 0 M k k i i z z (12)The adjacent samples zi are strongly correlated. Therefore, it is practical to carry out their averaging in the following way, for example:
1 0 0 0 M k Nk i i z z (13)This would require applying significantly lower values of M0 and m. The block diagram of the threshold former TF is shown in Figure 5.
The value z0i of threshold incomes into the resolver RS and if
i i z
z 0 (14)
then the decision R is made that the binary PSK signal is present, otherwise – that it is absent.
The transformations (7) and (11) conform with the classical non-coherent signal processing procedure [5, 6]. In the practical implementation of the detector, we can omit the square-rooting operation and use the decision statistics of the form of zi y02iy12i,
2 1 2 0i i
i y y
z .
5. THE FREQUENCY CHARACTERISTICS OF THE SIGNAL AND NOISE PROCESSING CHANNELS
In terms of z-transform [15], the detector transfer function for the signal extraction channel (by the response z) can be presented as follows:
N
N
z z z
z z z H
2 8
4 2
1 1 1
1 1
(15)
and for the interference estimate channel (by the response z) – as follows:
N
N
z z z
z z z H
2 8
4 2
1 1 1
1 1
(16)
By substituting
0 4
exp
2 0
4 0
exp j fT j f f f
z (17)
into Equations (15), (16), where j 1 and f is the signal frequency at the FM output. W e obtain the dependences of the frequency characteristics o f the signal extraction and the interference estimate channel on the f detuning (5), that are H
f H
z and
f H
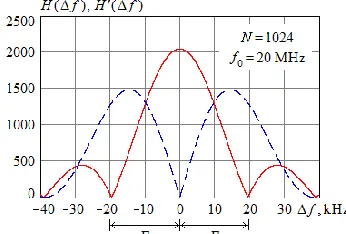
zH , respectively. These characteristics are in fact the ratios of the output response to the input signal amplitude at the frequency f. The graphs of the frequency characteristics H
f and H
f are shown in Figure 6 by solid and dashed lines, correspondingly. We can see that there are provided both the extraction of the signal component and its cancellation in the interference estimate channel. As both signal processing channels are the narrow-band ones, the interference component is estimated within the signal frequency band (Figure 1b).The maximum of the frequency characteristic of the signal extraction channel is equal to 2N, while its nearest zeros hold under the detuning F2f0 N.
Figure 6. The frequency characteristics of the signal extraction channel and the interference estimate channel
The frequency characteristic of the interference estimate channel, in turn, becomes zero at the signal frequency
0
2f
f , and the cancellation is provided of the basic signal frequency components. Thus, the introduced PSK signal detector with the frequency characteristics of the form presented in Figure 6 allows extracting the useful signal as well as estimating the interference level when receiving the signal with the spectrum shown in Figure 4.
6. THE DETECTOR SIMULATION
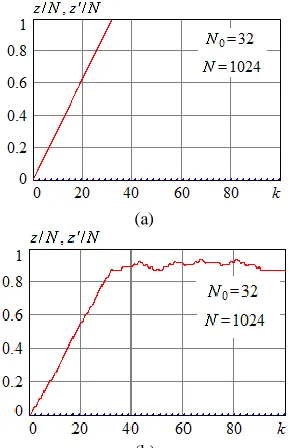
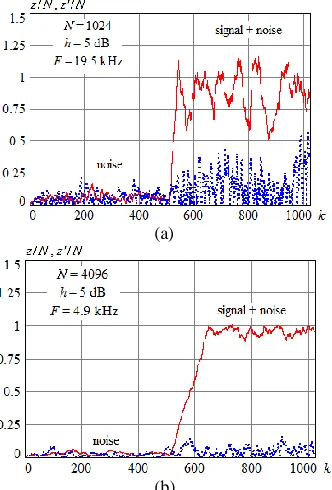
The results of simulation of the digital detector are shown in Figures 7-9. In Figure 7, the normalized responses z N (solid line) and z N (dashed line) are shown of the signal extraction channel and t he interference estimate channel depending on the number
k of the received information symbol under the unit signal amplitude S1 and in the absence of interferences. Figure 7a corresponds to the case of the ideal PSK signal (1) and Figure 7b – to the signal passing through the narrow-band reception path (Figure 1). The oscillations of the response z N seen in Figure 7b are caused by the phase-shift keying occurring in the narrow-band reception path, while the oscillations of the response z N of the interference estimate channel are practically absent. At the start of the detection, when
0 N
k , the transient process appears specified by the multibit shifters fill.
In the presence of interferences, their level can be estimated by the signal-to-noise ratio (SNR) at the output of the reception path as the ratio of the PSK signal power to the interference mean power (dispersion) 2in:
2 2 2
2 in
S
(a)
(b)
Figure 7. The normalized responses of the signal extraction channel and the interference estimate channel in the absence of interferences
In Figure 8, there are present the simulated results of the normalized responses z N (solid line) and z N (dashed line) for a varied number of the averaging periods N of the input signal second harmonic and for different values of SNRs h at the output of the reception path. It is presupposed that f0 10 MHz, N0 32 and the PSK signal is distorted by Gaussian white noise passed through the narrow-band reception path with the bandwidth 625 kHz.
As it follows from Figure 8, under N2101024
(i.e., when applying n10 stages of the samples accumulation in Figure 2), the consistent signal detection is provided under h11 dB (Figure 8a), while the interference immunity is greatly reduced under h5 dB.
In this case, in order to decrease the error probability, the number of the averaging periods N
should be increased. Thus, when h5 dB, the interference immunity becomes high under
4096 212
N or n12 (Figure 8c). Under
8192 213
N (n13), the detector is operable even under h3 dB (Figure 8d).
In Figure 9, there are drawn the dependences of the normalized detector response time in signal absence (“noise”) and in signal presence (“signal+noise”) under
5
h dB and various N. Here solid line corresponds to the signal channel, while dashed line – to the noise channel.
(a)
(b)
(c)
(d)
Figure 8. The normalized responses of the signal extraction channel and the interference estimate channel in the presence of the noise
(a)
(b)
Figure 9. The normalized responses of the signal extraction channel and the interference estimate channel in the presence and in the absence of the signal
It should be noted that if non-Gaussian noise is present at the detector input, then at the outputs of the quadrature processing channels the values of the sums (6), (7) and (10) will obey Gaussian probability distribution under N1, according to the central limit theorem.
7. THE DETECTOR INTERFERENCE IMMUNITY
Now we will carry out a rough estimate of the interference immunity of the binary PSK signal detector. Let the band Gaussian noise with zero mean value and dispersion 2in is present at the output of the narrow-band reception path with pass band fs equal to
the input PSK signal (1) spectrum width, while SNR h2 is determined by Equation (18).
In the signal absence, after passing the quadratic block, the noise has the mean value 2in and dispersion
4
2in [16]. In the signal presence, considering the frequency range in the neighborhood of the frequency
0
2f , at the output of the quadratic block, the mix of the harmonic wave with the amplitude S2 2 and the
correlated noise process with the mean value in2 and
the dispersion 24in occurs.
In the quadrature processing channels, the summation or subtraction is implemented of N
differences (6), (7) or (10) of the input samples with subsequent transformations (8) and (11) by the quadratic blocks QT1 and QT2. As a result, according to literature [16], the response z of the signal extraction channel is described by Rice distribution with the probability density of the form
2 0 2
2 2
2 I
2
exp z a az
z z
ws (19)
where a a12a22 , a1, a2 are the mean values and
2
are the dispersions of the responses of the quadrature processing channels, I0
x is the zero-order modified Bessel function.In the interference estimate channel, due to the subtractions in SUB0 and SUB1, we get a0 and, as
it follows from Equation (19), the response z is described by Rayleigh probability density
2 2
2 2 exp
z z
z
wn (20)
The dispersions of the responses z and z are the same and they are equal to
N
i N
k ik
in R
1 1 4 2
4 (21)
where Rik R
ik
is the correlation coefficientbetween i-th and k-th samples, R
is the normalized correlation function of the input noise, T2 4,2
0 2 T
T are the second harmonic sampling interval
and period. We designate
N
i N
k ik R
1 1
and rewrite
Equation (21) as follows:
2 4
4 in (22)
If the samples can be considered as uncorrelated, i.e.
, , 0
, , 1
k i
k i
Rik then the formula (22) takes the form of
4 2
4Nin
(23)
For the narrow-band Gaussian noise at the detector input resulting from, for example, the impact of Gaussian white noise on the high-Q oscillation circuit with the pass band fC, we get [16]
exp
fC 2
R (24)
Assuming that in Equation (24) T0 8, for the
16
exp f T0i k
Rik C (25)
The product
0
T fC
(26)
characterizes the measure of input signal bandlimitedness. Taking into account the designation (26), we rewrite Equation (25) as follows
16
exp i k
Rik (27)
In Figure 10a, by dashed line the dependence Rn (27) of the correlation coefficient is plotted as the function of the samples bias n ik under
0625 . 0
; while by solid line the corresponding dependence is drawn obtained by the statistical simulation for N1024 and when processing the signal presented in Figure 1a. As we can see here, the considered theoretical and experimental models have agreed with each other s atisfactorily. In Figure 10b, there is shown the dependence
N obtained under1024
N . When η (26) is decreasing, the dispersions of the responses of the quadrature channels increase significantly. Thus, if 0.0625 and N1024, then
we get N3.95105N2.
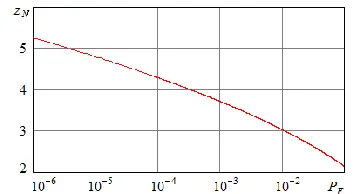
By applying Equation (20), we can write down the expression for the false alarm probability:
2 2 0 2 exp
0
z dz
z w P
z n
F (28)
Here z0 is the threshold with which the decision statistics (8) is compared. Specifying the false alarm probability (when the Neumann-Pirson criterion is used, for example), from Equation (28), makes it possible for us to calculate the values of the normalized threshold
z0
zN in the following way:
F
N P
z 2ln (29)
The dependence (29) is illustrated in Figure 11.
If the PSK signal is present at the detector input, then the decision statistics is described by Rice
distribution (19) with the deviation parameter aNS2 and the dispersion (23). Then, for the missing probability, we get:
0
0
0
2 0 4 2 2
0
I 2 exp
z
z
s M
dx x h N h
N x x
dz z w P
(30)
(a)
(b)
Figure 10. The correlation coefficient of the narrow-band Gaussian noise at the detector input and the normalized values of the parameter μ
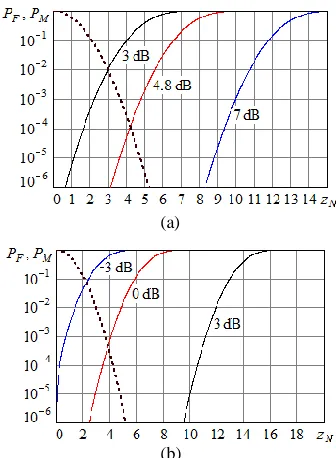
In Figure 12, the dependences are shown of the false alarm (dashed line) and the missing (solid lines) probabilities on the normalized threshold zN (29). It is assumed that N1024 (Figure 12a) or N8192
(Figure 12b) and SNR h (18) may vary: its values are 3, 4.8, 7 dB (Figure 12a), or –3, 0, 3 dB (Figure 12b).
It should be noted that the obtained approximate estimates of the error probabilities (28) and (30) do not account for increasing response of the interference estimate channel while the PSK signal occurs. This effect is caused by the imperfect signal cancellation that we can see in Figure 9.
Besides, while obtaining the formulas (28), (30), the correlation properties of the input signal are approximately taken into account. However, as it is demonstrated during the statistical simulation, in this case too the expressions (28), (30) for the error probabilities coincide satisfactorily with the corresponding experimental data.
(a)
(b)
Figure 12. The false alarm and the missing probabilities under N1024 and N8192
Thus, the introduced algorithm for detecting the binary PSK signals provides high interference immunity.
8. THRESHOLDING FOR SIGNAL DETECTION
As it is well known, when applying the Neumann -Pirson criterion, the threshold level zNP is determined by the false alarm probability through the formula (29) only. The value of the real threshold z0 is equal to
zNP
z0 .
If the random variable obeys the Raileigh distribution (20), then its mean value zmean is written
as [16] zmean 2. Then, for decision thresholding,
we get
mean
0 2z z
z NP (31)
where the value of zmean is measured by the threshold former at the SUMm output (Figure 5), while the coefficient α (12) is equal to
2zNP (32)
For example, under the false alarm probability 3
10
F
P , we obtain zNP3.72 from Equation (29),
and 2.37 from Equation (32). Taking into account the increase of the interference level at the moment when signal appears, the value of α should be increased by 1.5-2 times.
9. HARDWARE IMPLEMENTATION OPTIONS
In order to implement the proposed algorithm for detecting the PSK signal, the FPGAs, in particular, the ones of the Spartan-6 family (for example, XC6SL25) developed by Xilinx can be efficiently used [12, 13]. Simulation in the ISE WebPACK environment demonstrates that the FPGA hardware resources are sufficient for implementing the detector presented in Figure 2 under the value of N lying within the range betwenn 16 to 2048 (in case when the value of n, the signal accumulation steps, is up to 11). The operating frequencies are determined by both the acceptable clock frequency of the ADC and the operating speed of the FPGA. In the considered example, the signal is processed at the frequencies up to 20-40 MHz and under the power consumption not exceeding 100 mW.
10. CONCLUSION
The introduced digital algorithm for detecting the binary phase-shift keyed signal provides its detection with high interference immunity while the signal-to-noise ratio may be considerable lower than the working value in the information receiver path. This algorithm requires a small number of arithmetic operations to be fulfilled, and it can be relatively simply implemented on the basis of the modern programmable logic devices. The detection efficiency increases with the number of the periods for averaging; but, however, in this case, the detector lag also rises. Estimating the interference level at the output of the reception path allows a relatively inexpensive implementation of the adaptive choice of the threshold for the decision concerning the presence or the absence of the signal.
11. ACKNOWLEDGEMENT
This research was financially supported by the Russian Foundation for Basic Research (research project no. 16-01-00121) and the Ministry of Education and Science of the Russian Federation (research project no. 2.3208.2017/4.6).
12. REFERENCES
1. Gholami, M., and Ardeshir, G., “Dual phase detector based on delay locked loop for high speed applications”, International Journal of Engineering, Transactions A: Basics, Vol. 27, No. 4, (2014), 517-522.
3. Jiang, L., Yan, S., Wu, Y., and Ma, X., “ Sonar Detection Performance with LFM-BPSK Combined Waveforms”, OCEANS 2016 – Shanghai, Shanghai, China, (2016). 4. Chesi, G., Olivares, S., Paris, M.G.A., “ Squeezing-enhanced
phase-shift-keyed binary communication in noisy channels”, Physical Review A, Vol. 97, No. 3, (2018), 032315. 5. Sklar, B., “Digital Communications: Fundamentals and
Applications”, New Jersey, Prentice Hall, (2001).
6. Proakis, J., and Salehi, M., “Digital Communications”, New York, McGraw-Hill, (2007).
7. Hill, D. A., and Bodie, J. B., “Experimental carrier detection of BPSK and QPSK direct sequence spread spectrum signals”, 1995 Military Communications Conference (MILCOM), San Diego, CA, USA, (1995).
8. Hill, D. A., and Bodie, J. B., “Carrier detection of PSK signals”, IEEE Transactions on Communications, Vol. 49, No. 3, (2001), 487-496.
9. Litvinenko, V. P., Litvinenko, Yu. V., Matveev, B. V., Chernoyarov, O. V., and Makarov, A. A., “The New Detection T echnique of Phase-Shift Keyed Signals”, 2016 International Conference on Applied Mathematics, Simulation and Modelling (AMSM2016), Beijing, China, (2016).
10. Glushkov, A.N., Litvinenko, V. P., Litvinenko, Yu. V., Matveev, B. V., Chernoyarov, O. V., and Salnikova, A.V., “Basic
Algorithm for the Coherent Digital Processing of the Radio Signals“, 2015 International Conference on Space Science and Communication (IconSpace), Langkawi, Malaysia, (2015). 11. Chernoyarov, O.V., Glushkov, A.N., Litvinenko, V.P.,
Livinenko, Yu.V., and Matveev, B.V., “Fast Digital Algorithms for the Coherent Demodulation of the Phase-Shift Keyed Signals”, 2017 IEEE Dynamics of Systems, Mechanisms and Maсhines (Dynamics), Omsk, Russia, (2017).
12. Maxfield, C., “ The Design Warrior's Guide to FPGAs: Devices, T ools and Flows”, New Jersey, Newnes, (2004).
13. Zivarian, H., Soleimani, M., and Doost Mohammadi, M.H., “Field programmable gate array–based implementation of an improved algorithm for objects distance measurement”, International Journal of Engineering, Transactions A: Basics, Vol. 30, No. 1, (2017), 57-65.
14. Wesołowski, K, “Introduction to Digital Communication Systems”, Delhi, Wiley, (2009).
15. Rabiner, L. R., and Gold, B., “T heory and Application of Digital Signal Processing”, New Jersey, Prentice Hall, (1975). 16. Levin, B. R., “T heoretical Principles of Radioengineering
Statistics”, Virginia, Defense T echnical Information Center, (1968).
Digital Binary Phase-shift Keyed Signal Detector
O. V. Chernoyarova,b,c, L. A. Golpaieganic, A. N. Glushkovd, V. P. Lintvinenkoe, B. V. Matveeve
a International Laboratory of Statistics of Stochastic Processes and Quantitative Finance, National Research Tomsk State University, Tomsk,
Russia
b Department of Higher Mathematics and System Analysis, Maikop State Technological University, Maikop, Russia c Department of Electronics and Nanoelectronics, National Research University “MPEI”, Moscow, Russia
d Department of Infocommunication Systems and Technologies, Voronezh Institute of the Ministry of Internal Affairs of the Russian Federation,
Voronezh, Russia
e Department of Radio Engineering, Voronezh State Technical University, Voronezh, Russia
P A P E R I N F O
Paper history:
Received 26 September 2018
Received in revised form 17 February 2019 Accepted 07 March 2019
Keywords: Phase-shift Keying Signal Detection Fast Digital Processing Noise Interference Interference Immunity
هديكچ
متیروگلا راک نیا رد رثؤم
ی یارب یزاسراکشآ لانگیس
یاه لاتیجید یرنیاب هدرشف هدش هعسوت هداد تسا هدش
.
نیا
متیروگلا زاین هب دادعت یمک زا تایلمع یتابساحم رد لوط هرود لانگیس و دراد یم دناوت اتبسن ناسآ رب ساسا هاگتسد یاه
یقطنم لباق همانرب یزیر .دوش یزاس هدایپ نینچمه
اب صیخشت دوجو ،لانگیس یتقو هک تبسن لانگیس هب زیون رایسب رتمک
زا رادقم یراک نآ رد ریسم تفایرد ،تسا تینوصم لخادت لااب ار مهارف یم .دنک زاسراکشآ یفرعم هدش یاراد سناکرف
یباختنا یتاذ تسا
یریگ میمصت هناتسآ راگزاس فیرعت هب ندیسر یارب ار زیون حطس نیمخت ات دهدیم ناکما ام هب و
.میزاسب هب روظنم دییأت ییاراک و درکلمع ،زاسراکشآ هدش داهنشیپ هتفر تسد زا تلاامتحا و هابتشا مرلاآ یارب یتارابع
و تسا زا ظاحل یرظن و ،یبرجت ریثأت یاهرتماراپ زاسراکشآ رب یگژیو یاه نآ تسا هتفرگ رارق یسررب دروم
.