Vol. 1, No. 1, pp. 27-40, June (2018)
Simultaneous Optimal Placement and Sizing of Distributed Generation
Resources and Shunt Capacitors in Radial Distribution Systems using Crow
Search Algorithm
Hassan Baratia)andMohsen Shahsavarib)
The application of distributed generation resources and capacitor banks is increasing due to the distribution networks extension and also power demand growth. Determining the installation location and the capacity are two important and effective factors on the network power loss and the network performance improvement. If connected in the right place to the power network, distributed generation power plants and the capacitors have different effects such as loss reduction, voltage profile improvement, and network reliability augmentation. In this paper, in order to reduce the distribution system loss, simultaneous optimal placement of the distributed generation resources and capacitors in radial distribution systems is studied. Crow search algorithm is applied for this purpose. This algorithm works on this idea that the crows chase each other in order to find other crows’ food hiding place. The simulation is done on IEEE-33 & IEEE-69 buses network in MATLAB software. The simulation results demonstrate the efficiency of crow search algorithm, comparing to other applied optimization algorithms, in the problem of simultaneous optimal placement of the distributed generation resources and capacitors in radial distribution systems to reduce loss and enhance voltage profile.
A B S T R A C T
ARTICLE INFO
Keywords:
Crow Search Algorithm (CSA) Placement and size
Capacitor
Distributed Generation (DG) Radial distribution systems Power loss, Voltage profile
Article history:
Received March. 16, 2018 Accepted May. 1, 2018
I. INTRODUCTION
Nowadays voltage drop, high loss, and the voltage pro-file impropriety are among distribution networks prob-lems. The topic of electric energy quality or power qual-ity is one of the topics that are in the center of the opera-tors’ and the consumers’ attention in recent years. Volt-age drop is considered as the most important aspect of power quality; therefore, in recent years it has been tried to decrease it in electric networks.
In order to reduce the voltage drop and also to de-crease the loss in the network, shunt capacitors could be used. On the other hand, installing capacitors in dis-tribution network has caused reduction of the reactive
a)Corresponding Author: [email protected], Tel:+98-61-42422090,
Fax:+98-61-42422090, Department of Electrical Engineering, Dez-ful Branch, Islamic Azad University, DezDez-ful, Iran
b)Department of Electrical Engineering, Dezful Branch, Islamic
Azad University, Dezful, Iran
http://dx.doi.org/10.22111/ieco.2018.24426.1028
power component and with the decrease of the reactive current component, the current amplitude is declined and this causes loss reduction in the network and capacity re-lease in the system. To employ shunt capacitors in the network so that they represent the best performance in decreasing the voltage drop, optimization algorithms are needed to determine their optimum location and size.
The increase of the consumers’ number and how to supply the loads are considered among the most signifi-cant challenges of the power system. Since the expense of the construction or updating the transmission lines and the distribution networks are extremely high; moreover, among the different segments of the power systems the largest amount of loss is dedicated to the distribution network, due to the voltage low level and the current high level, one of the economical and affordable meth-ods to solve this issue is to use distributed generation (DG) resources. Given this case, the distribution net-work optimal utilization and planning, considering the power system uncertainty, is of importance. In addition to economic concerns, power quality, reliability, energy saving, and also sustainability are improved to a signif-icant extent1; therefore, determining the capacity and the location of the DGs are substantial topics that vari-ous optimization methods, such as genetic algorithm, ant colony, particle swarm optimization algorithm, and con-tinuous power flow are applied1–5. In reference6 an
ana-lytical method and in references7–10 numerical methods are used to find the optimal location and size of different DGs. Furthermore, to improve the voltage profile and also to reduce the loss in power lines exploiting reactive power resources, such as shunt capacitors, is common. References11–14 have resolved the shunt capacitors
the size of the DGs and the capacitors and suggested var-ious methods to enhance voltage stability, release system capacity, minimize energy losses, and increase system re-liability. Reference15 has employed PSO algorithm to
find the optimal location and size of the shunt capacitor and DG in IEEE standard networks with the goal of loss reduction. The 33-bus IEEE network in reference16, is used as a case study system to demonstrate the benefits of applying the improved genetic algorithm for finding the DG and capacitor installation place. In reference17,
the same goal is pursued using the BFOA algorithm and the results are compared for three different cases which are: applying only one DG or applying a DG and a ca-pacitor, and the third case, applying none of them. In reference18, the problem of locating DG and capacitor is
solved using the BPSO algorithm wherein the purpose is considered loss reduction, voltage improvement, and network reliability. In reference19, bee colony algorithm
and artificial immune system are combined together in order to optimally locate and determine the size of the capacitors and the DGs with the purpose of loss reduction and voltage profile improvement in distribution networks in which it is tested on 33-bus IEEE system for several cases. In reference20, using DPSO algorithm, the
capac-itors and the DGs are located and their sizes are deter-mined. Rreference21, employed TLBO method to
maxi-mize the profit to cost ratio when capacitor and DG are used simultaneously. In rreference22, IMDE algorithm is exploited to resolve simultaneously the placement and size of DGs and shunt capacitors in radial distribution networks. Although a significant number of different al-gorithms are presented and used to determine simultane-ously the location and the size of DGs and shunt capaci-tors, according to No Free Lunch (NFL) theory based on that the success of an algorithm in solving a specific col-lection of optimization problems does not guarantee to solve other optimization problems with a different type and nature. In other words, all optimization techniques work in an equal way on average to solve all the optimiza-tion problems, although they perform better in solving some of the optimization problems; therefore, the NFL theory gives the researchers the opportunity to offer new optimization algorithms, or improve or change the cur-rent algorithms for solving subsets of problems in various areas23.
In this paper, in order to locate and benefit simulta-neously from capacitors and DGs in radial distribution networks a meta-heuristic optimization method based on the intelligent behavior of crows, called the crow search algorithm (CSA) is employed. CSA is a population-based method working on the idea that a crow keeps his excess food in secret places and retrieves it whenever the food is needed. From the optimization point of view, crows are the explorers, the environment is the search space, each position at the environment corresponds a possible solution, the quality of the food resource is the objec-tive function and the best food resource of the environ-ment is the global solution of the problem. According
FIG. 1. The single-line diagram of the main feeder.
to these similarities, the CSA algorithm tries to simu-late the crows’ intelligent behavior to find the solution of the optimization problems. To implement the CSA algorithm, MATLAB software is used on 33 and 69-bus IEEE systems.
Organization of the rest of the paper is: formulating the optimization problem, crow search algorithm, imple-menting CSA to locate and determine the size of the ca-pacitor and DG, computer simulation results, analyzing them and conclusion.
II. FORMULATING THE OPTIMIZATION PROBLEM
Determining the location and the size of DGs and capacitors is a complex discrete optimization problem which is in need of an effective method. In this paper, the crow search algorithm is used to solve this problem.
A. Formulating the Power Flow
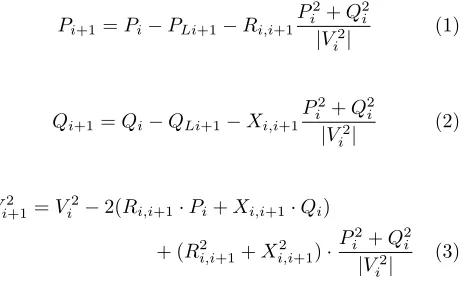
Some efficient methods to find a solution for the power flow problem in radial distribution networks is avail-able in the references. These methods are divided into two general groups: the total power method, known as “Forward- Backward Sweep”, and methods based on “Implicit Nodal Impedance”. In this study, the power flow problem is solved with the total power method based on Forward-Backward Sweep algorithm by using the fol-lowing recursive equations which are obtained from the single-phase diagram demonstrated in Fig. 122.
Pi+1=Pi−PLi+1−Ri,i+1
Pi2+Q2i |V2
i |
(1)
Qi+1=Qi−QLi+1−Xi,i+1
P2
i +Q2i |V2
i |
(2)
Vi2+1=Vi2−2(Ri,i+1·Pi+Xi,i+1·Qi)
+ (R2i,i+1+Xi,i2+1)·P
2
i +Q2i |V2
i |
(3)
In which Pi andQi are the active and reactive power
of the ith bus, respectively. Also, PLi and QLi are the
The power loss in this line can be calculated adopting the following equations:
PL=Ri,i+1·
P2
i +Q2i |V2
i |
(4)
QL=Xi,i+1·
P2
i +Q2i |V2
i |
(5)
The total power lossPT Lin the feeder can be achieved
by adding the power loss in the lines. As shown in the following formula:
T Ploss=
n−1
X
i=0
PL(i, i+ 1) (6)
T Qloss=
n−1
X
i=0
QL(i, i+ 1) (7)
in which,T PlossandT Qlossare the active and reactive
losses in the system, respectively. The recursive equation given in equations (1) and (2) should be modified as fol-lows:
Pi+1=Pi−PLi+1−Ri,i+1
Pi2+Q2i |V2
i |
+µP ·APi+1 (8)
Qi+1=Qi−QLi+1−Xi,i+1
P2
i +Q2i |V2
i |
+µq·RPi+1 (9)
In Eq. (8), µp is the active power factor. When an
active power source existsµp equals to one, otherwise it is zero. Similarly, in Eq. (9), µq is the reactive power factor. When a reactive power source existsµpequals to one, otherwise it is zero. Also,APi+1is the amplitude of the active power injected in busi+ 1 andRPi+1 is the amplitude of the reactive power injected in bus i+1.
B. Objective Function
The objective function is the total active power loss in the system22:
min·F =PLoss (10)
1. The Problem Constraints
The constraints that are considered in this optimiza-tion problem are the bus voltage limits, the lines load flow, and the minimum and the maximum of the avail-able capacity for installing the capacitor banks and DGs. These constraints are demonstrated below:
Vimin≤Vi≤Vimax (11)
Iij ≤Iijmax (12)
PDGmin≤PDG≤PDGmax (13)
Qminc ≤Qc≤Qmaxc (14)
in whichIij is the current passing from busito busj,
PDG and QC are the active and reactive power of each DGand capacitor that are between their maximum and minimum amount.
III. CROW SEARCH ALGORITHM
Crows are considered intelligent birds. They have the largest brain relative to their body size. According to their brain to body ratio, their brain is only a little smaller than a human brain. There is a lot of evidence for crows’ cleverness. Crows can remember their faces and warn each other when an unfamiliar one approaches. Be-sides, they can use tools, communicate in complex ways, and recall their secret food places up to several months later24.
It has turned out that crows watch other birds, ob-serve the places that other birds hide their food, and steel it once the bird leaves. If a crow committed theft, it takes extra precautions such as moving the hiding place in order to prevent being the next victim. In fact, they use their own personal experience as a thief to predict a thief’s behavior and they can perform the safest methods to protect their savings from being stolen.
The principals of crow search algorithm (CSA) are as follows:
1. Crows live in flock form.
2. Crows remember their hidden places positions.
3. Crows follow each other to steal.
4. Crows protect their stocked stores from thievery by a probability.
It is assumed that there is a d-dimension environment including a number of crows. The number of the crows (the size of the flock) isN and the position of crow iat the time (iteration)iterin the search space is determined by a vectorxianditermaxis the maximum number of it-erations. Each crow has a memory that the position of its hiding place is memorized. In iterationiter, the position of the hiding place of crow i is shown bymi,iter. This is
the best position that crow i has achieved so far. In fact, in each crow’s memory, the position of its best experience is memorized. The crows move in the environment and seek the best food sources (hiding places).
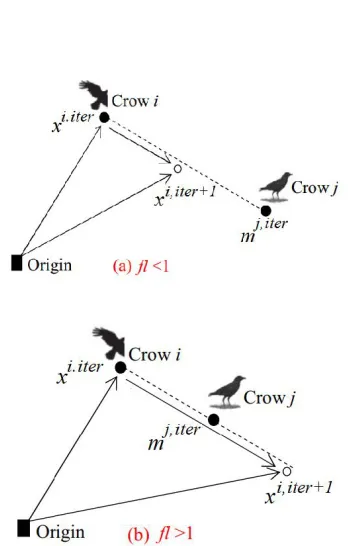
Assume that in iterationiter, the crowjwants to visit its hiding place, mi,iter. In this iteration, the crow i
1. The first state Crowj does not know that crow i
is following him. As a result, crowi will approach the hiding place of crow j. In this state the new position of crow iis obtained as follows:
xi,iter+1=xi,iter+ri×f li,iter×(mj,iter−Xi,iter) (15)
In whichriis a random number with uniform distri-bution between zero and one andf li,iterillustrates
the flight length of crowi in iteration iter. Fig. 2
indicates the general scheme of this state and its ef-fect on search functionality. Small values off llead to local search (in the vicinity of xi,iter) and large
values lead to global search (far away fromxi,iter).
2. The second state: The crow j knows that crow i
follows him; therefore, in order to protect his cache, crowjdeceives crowiby going to another position in the search space.
Generally, states one and two can be expressed as follows:
Xi,iter+1=
Xi,iter+ri×f li,iter×(mj,iter−Xj,iter), rj≥APi,iter
a random position, otherwise
(16)
in which APj,iter denotes the probability of the crow j awareness in the iterationiter.
Meta-heuristic algorithms should build a good balance between diversification and intensification. In CSA, in-tensification and diversification are mainly controlled by awareness probability (AP) parameter. By reducing the awareness probability value, CSA tends to do the search in a local area in which a proper solution has been found. As a result, by using the small values of AP, intensifica-tion increases. On the other hand, by awareness prob-ability value increase, the search probprob-ability in the cur-rent proper solutions region decreases and CSA tends to check the search space on a global scale (random). Hence, employing large values of AP causes an increase in the diversification.
A. Implementing CSA for Optimization Problems
The step-by-step approach to CSA implementation is24:
Step 1: Initializing the problem and the adjustable parameters.
The optimization problem, decision variables, and the constraints are defined. Then the adjustable parameters of CSA (flock size (N), the maximum number of iter-ations (itermax), flight length (f l), and the awareness probability (AP)) are set.
Step 2: Initializing position and the crows’ mem-ory
N crows are positioned randomly in a d-dimensional search space as flock members. Each crow is a feasible solution to the problem andd is the number of decision
FIG. 2. The general scheme of search capability of crowi (crowican go to all places on the dashed line).
variables.
Crows =
x1
1 · · · x1d
..
. . .. ...
xN1 · · · xNd
(17)
that they have hidden their food at their initial positions.
Step 3: Objective Function Assessment
For each crow, by putting the decision variables value in the objective function the quality of its position is calculated.
Memory =
m1
1 · · · m1d
..
. . .. ...
mN1 · · · mNd
(18)
Step 4: generating new positions
Crows generate new positions in the search space as follows: suppose that the crowiwants to generate a new position. For this purpose, this crow randomly chooses a crow from the flock (for example crow j) and follows it to find the position of the food that is hidden by this
crow (mj). The new position of crow i is obtained by Eq. (2). This process will be repeated for all of the crows.
Step 5: Checking the feasibility of new positions The feasibility of the new position of each crow will be checked. If a crow’s new position is feasible, the crow updates its position. Otherwise, the crow stays in the current position and does not move to generate a new position.
Step 6: Evaluating the objective function of the new positions
The value of the fitness function for each crow’s new position is calculated.
Step 7: Updating the memory
The crows update their memory as follows:
mi,iter+1=
Xi,iter+1, f(Xi,iter+1) is better than f(Xi,iter)
mi,iter, otherwise
(19)
It is seen that if the new position objective function value is better than the memorized position objective function value, the crow updates its memory by the new position.
Step 8: Checking the termination condition
The steps 4−7 are repeated untilitermaxis obtained. When the termination condition is met, the best memory position from the fitness function value point of view is reported as the optimization problem solution.
B. Implementing CSA to determine the location and size of the capacitor and DG
The implementation steps are:
1. Reading the total information of the network in-cluding the number of buses, feeders, etc.
2. Setting the adjustable parameters of CSA including the flight length f l and the awareness probability AP and the maximum iteration number.
3. Generating the initial population and initializing the crows’ positions in the search space: the deci-sion variables of the problem such as the candida buss for installing each DG and capacitor and the active power corresponding to each DG and the re-active power corresponding to each capacitor.
4. Initializing the memory of each crow.
5. Evaluating the objective function corresponding with the position and the memory of each crow by
running the forward-backward sweep load flow pro-gram.
6. Randomly generating the candidate crows for the chase.
7. Updating the position of each crow based on Eq. (14).
8. Checking the feasibility of the updated position of every crow and not violating the searching space
9. Evaluating the objective function corresponding to the new position of each crow by executing the forward-backward sweep load flow.
10. Updating the memory of each crow based on Eq. (17).
11. Repeating the steps 7 to 10 until reaching the ter-mination criteria (maximum number of iteration).
12. Reporting the best value of the memory.
13. The end.
IV. SIMULATION RESULTS AND DISCUSSION
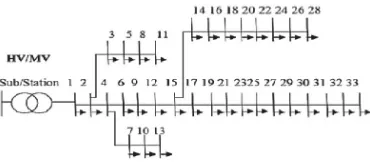
FIG. 3. IEEE 33-bus standard distribution system22.
FIG. 4. IEEE 69-bus standard distribution system22.
loss and with considering the mentioned constraints, the simulation is conducted on the IEEE 33 & 69-Bus sys-tems (figures 3-4) in MATLAB software. In implement-ing the crow search algorithm the followimplement-ing parameters are considered: the flight length 2, the awareness fac-tor (awareness probability) 0.1, the initial population 50, and the number of iteration 100.
In this study, several scenarios are considered. Tables
I,II, demonstrates the conducted scenarios and their ab-breviation signs on the 33 & 69 networks, respectively.
In this paper, computer simulations on placement problem are done with constant load (peak load) for im-plementation of CSA algorithm and validation and com-parison of results with other algorithms and references such as22,25–29. Simulation results with variable load and
for a period of the network operation can be considered as the next step in research work.
A. The IEEE 33-Bus System CSA for Optimization Problems
The data of the IEEE 33-bus system is taken from reference22. The system load value is 3.7 M W and
2.3M V ar. The results of simulating this system for the first scenario is conducted when there exist no capaci-tors and no DGs and the voltage of the weakest bus is 0.904pu and it is on bus No. 18. Total loss of the base system is 211kW.
TableIIIillustrates the results of the computer simula-tion of implementing CSA for different scenarios on IEEE 33-bus network. In TableIII, for each scenario, the net-work active power loss (kW), the decrease percent of the loss comparing to the base state, voltage (pu), and the location of the weakest bus, the size (M V ar) and loca-tion of the capacitors and also the size and localoca-tion of the DGs are shown. In all of the scenarios the active power loss is decreased compared to the base case and in cases (3 DG-PQ) and (3 Cap., 3 DG-PQ) the largest loss reduction is shown which are respectively 94.43% and 94.67%. Besides, the weakest bus voltage amplitude has improved in all the scenarios compared to the base case and the largest improvement is for cases (3 DG-PQ) and (3 Cap., 3 DG-PQ) which are 0.9922 and 0.9961pu, respectively.
Figures5and6, demonstrates the voltage profile com-parison, the active power loss comcom-parison, and the weak-est bus voltage of the IEEE 33-bus network comparison in different scenarios.
Fig. 7, illustrates the convergence curve of the imple-menting CSA on IEEE 33-bus network for some of the scenarios and it shows a very good convergence and op-timizing for the use of crow search algorithm.
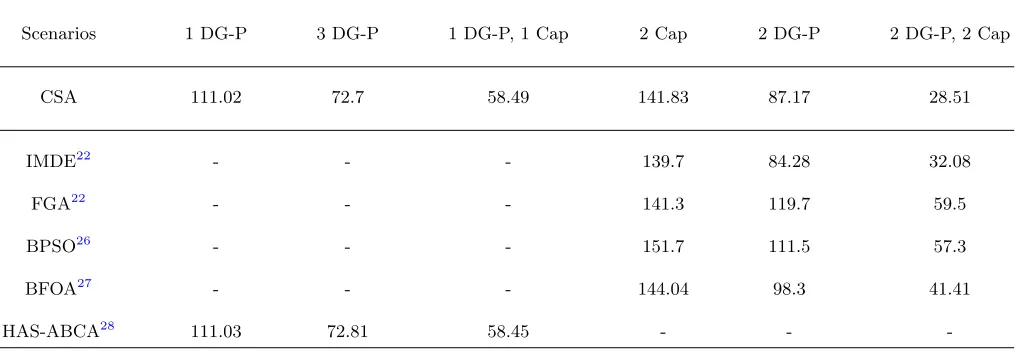
In order to validate and assess the performance of CSA deployment, the results obtained from it regarding the locating, and solo and concurrent size determination of the shunt capacitors and the DGs from the viewpoint of active power loss value and voltage and the weakest bus position are compared to the three existing scenarios in other references including IMDE22, FGA25, BPSO26, and
BFOA27 algorithms and are shown in TablesIVand V,
so that in locating and simultaneous size determination of the capacitors and DGs, CSA has presented better results comparing to other algorithms.
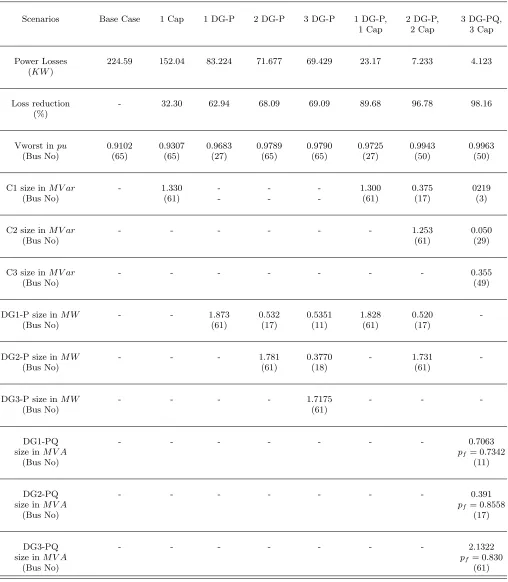
B. The IEEE 69-Bus System CSA for Optimization Problems
The data of the IEEE 69-bus system is taken from reference22. The system load value is 3.8 M W and 2.69 M V ar. The results of simulating this system for the first scenario is conducted when there exist no ca-pacitors and no DGs and the voltage of the weakest bus is 0.9102 and it is on bus No. 65. Total loss of the base system is 224.59kW.
TABLE I. The simulated CASES on 33-BUS network
Scenarios
Without Cap & Without DG Base Case
One Capacitor 1 Cap
Two Capacitors 2 Cap
One DG withpf = 1 1 DG-P
Two DGs withpf = 1 2 DG-P
Three DGs withpf = 1 3 DG-P
Three DGs withpf <13 DG-PQ
One Capacitor & One DG withpf = 1 1 DG-P, 1 Cap
Two Capacitors & Two DGs withpf = 1 2 DG-P, 2 Cap
Three Capacitors & Three DGs withpf <1 3 DG-PQ, 3 Cap
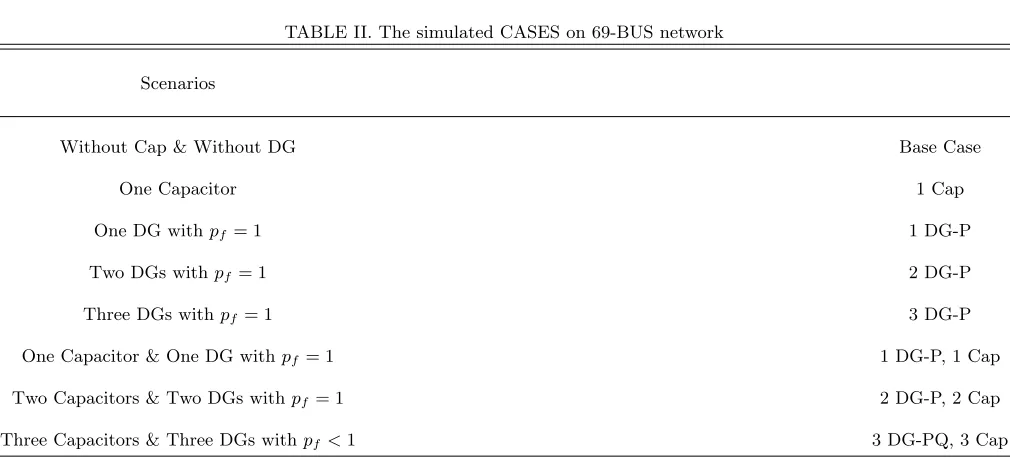
TABLE II. The simulated CASES on 69-BUS network
Scenarios
Without Cap & Without DG Base Case
One Capacitor 1 Cap
One DG withpf = 1 1 DG-P
Two DGs withpf = 1 2 DG-P
Three DGs withpf = 1 3 DG-P
One Capacitor & One DG withpf = 1 1 DG-P, 1 Cap
Two Capacitors & Two DGs withpf = 1 2 DG-P, 2 Cap
Three Capacitors & Three DGs withpf <1 3 DG-PQ, 3 Cap
has improved in all the scenarios compared to the base case and the largest improvement is for cases (2 DG-P, 2 Cap.) and (3 DG-PQ, 3 Cap.) which are 0.9943 and 0.9963pu, respectively.
Fig. 9, illustrates the convergence curve of the imple-menting CSA on IEEE 69-bus network for some of the scenarios and it shows a very good convergence and op-timizing for the use of crow search algorithm. Figures
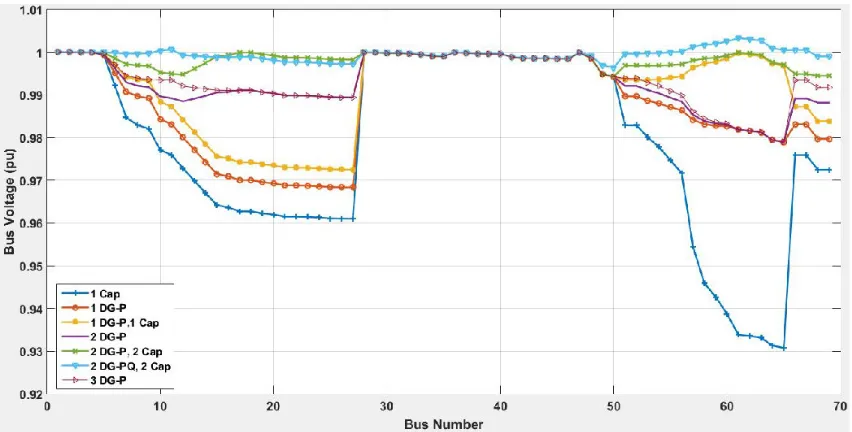
10-12, demonstrates the voltage profile comparison, the active power loss comparison, and the weakest bus volt-age of the IEEE 69-bus network comparison in different scenarios.
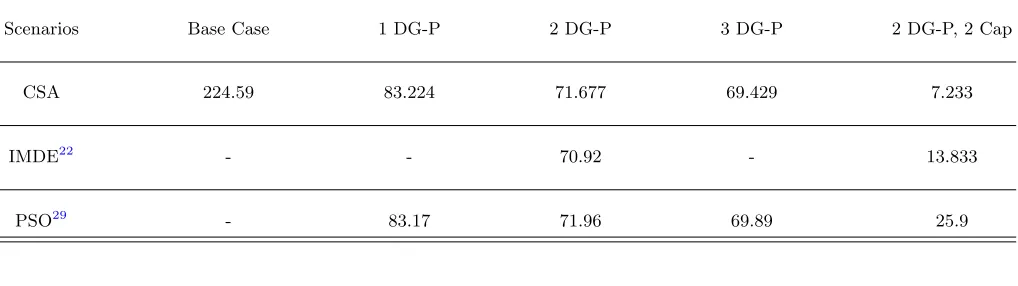
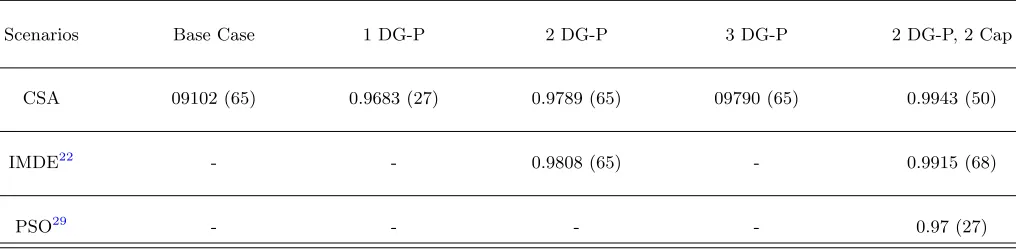
In order to validate and assess the performance of CSA deployment, the results obtained from it regarding the lo-cating, and solo and concurrent size determination of the shunt capacitors and the DGs from the viewpoint of ac-tive power loss value and voltage and the weakest bus position are compared to the three existing scenarios in other references including IMDE22and PSO29algorithms
TABLE III. The simulation results of the IEEE 33-BUS network for different scenarios
Scenarios Base Case 1 Cap 2 Cap 1 DG-P 2 DG-P 3 DG-P 3 DG-PQ 1 DG-P, 2 DG-P, 3 DG-PQ, 1 Cap 2 Cap 3 Cap
Power Losses 211 151.36 141.83 111.02 87.17 72.7 11.76 58.49 28.51 11.25 (Kw)
Loss - 28.27 32.78 47.38 58.67 65.50 94.43 72.28 86.49 94.67
reduction (%)
Vworst inpu 0.904 0.9165 0.9304 0.9424 0.9686 0.9687 0.9922 0.9534 0.9804 0.9961
(Bus No) (18) (18) (17) (18) (18) (18) (8) (18) (25) (22)
C1 size in - 1.285 0.4652 - - - - 1.2175 0.4488 0.4233
M var(Bus No) (30) (12) (30) (12) (8)
C2 size in - - 1.063 - - - 1.0468 0.1610
M var(Bus No) (30) (30) (21)
C3 size in - - - 0.1500
M var(Bus No) (32)
DG1-P size in - - - 2.59 0.852 0.8018 - 2.5363 0.8656
-M W (Bus No) (6) (13) (13) (6) (13)
DG2-P size in - - - - 1.158 1.0913 - - 1.1253
-M W (Bus No) (30) (24) (30)
DG3-P size in - - - 1.0536 - - -
-M W (Bus No) (30)
DG1-PQ size 0.8832 - - 0.8364
inM V A - - - pf = 0.9049 pf = 0.9544
(Bus No) (13) (14)
DG2-PQ size 1.2151 - - 1.1633
inM V A - - - pf = 0.8928 pf = 0.8810
(Bus No) (24) (24)
DG3-PQ size 1.4313 - - 1.3209
inM V A - - - pf = 0.7144 pf = 0.8382
(Bus No) (30) (30)
V. CONCLUSIONS
Because of distribution networks expansion and also the increase of power demand, utilizing the distributed generation resources and capacitor banks are increasing
TABLE IV. Comparing the voltage (pu) and the place of the weakest bus in IEEE 33-BUS network with different algorithms
Scenarios 1 DG-P 3 DG-P 1 DG-P, 1 Cap 2 Cap 2 DG-P 2 DG-P, 2 Cap
CSA 0.9424 (18) 0.9687 (18) 0.9534 (18) 0.9304 (17) 0.9686 (18) 0.9804 (25)
IMDE22 - - - 0.942 (18) 0.971 (33) 0.979 (25)
FGA22 - - - 0.929 (18) 0.935 (18) 0.96 (18)
BPSO26 - - - 0.935 (18) 0.919 (18) 0.969 (18)
BFOA27 - - - 0.9361 0.9645 0.9783
TABLE V. Comparing the active power loss (KW) in IEEE 33-BUS network with different algorithms
Scenarios 1 DG-P 3 DG-P 1 DG-P, 1 Cap 2 Cap 2 DG-P 2 DG-P, 2 Cap
CSA 111.02 72.7 58.49 141.83 87.17 28.51
IMDE22 - - - 139.7 84.28 32.08
FGA22 - - - 141.3 119.7 59.5
BPSO26 - - - 151.7 111.5 57.3
BFOA27 - - - 144.04 98.3 41.41
HAS-ABCA28 111.03 72.81 58.45 - -
-power plants and the capacitors will have various effects including loss reduction, voltage profile improvement, and network reliability increase. In this paper, in order to determine, solo and concurrent, the optimal location and size of the distributed generation resources and shunt capacitors in radial distribution systems the crow search algorithm, which is based on simulating the intelligent behavior of the crows in search of food, is used. To check the efficiency of the applied method, the simulation was conducted on case study networks for different scenarios and with proper convergence and speed, desirable results were gained, and comparing the results to other algorithms expresses the good performance of CSA in optimization problems.
REFERENCES
1P. S. Georgilakis and N. D. Hatziargyriou, “Optimal distributed
generation placement in power distributed networks: models, methods and future research,”IEEE Transactions on Power Sys-tems, Vol. 28, No. 3, pp. 3420-3428, 2013.
2S. Kansal, V. Kumar and B. Tyagi, “Optimal placement of
dif-ferent type of DG sources in distribution networks,”International
Journal of Electrical Power &Energy Systems, Vol. 53, pp. 752-60, 2013.
3S. K. Injeti and N. P. Kumar, “A novel approach to identify
opti-mal access point and capacity of multiple DGs in a sopti-mall, medium and large scale radial distribution systems,”International Jour-nal of Electrical Power &Energy Systems, Vol. 45, No. 1, pp. 142-151, 2013.
4R. S. Rao, K. Ravindra, K. Satish and S. V. L. Narasimham,
“Power loss minimization in distribution system using network reconfiguration in the presence of distributed generation,”IEEE Transactions on Power Systems, Vol. 28, No. 1, pp. 317-325, 2013.
5K. D. Mistry and R. Roy, “Enhancement of loading
ca-pacity of distribution system through distributed genera-tor placement considering techno-economic benefits with load growth,”International Journal of Electrical Power & Energy Systems, Vol. 54, pp. 505-515, 2013.
6D. Q. Hung and N. Mithulananthan, “Multiple distributed
gen-erators placement in primary distribution networks for loss re-duction,”IEEE Transactions on Industrial Electronics, Vol. 60, No. 4, pp. 1700-1708, 2013.
7S. Porkar, P. Poure, A. Abbaspour-Tehrani-fard and S.
TABLE VI. The simulation results of the IEEE 69-BUS network for different scenarios
Scenarios Base Case 1 Cap 1 DG-P 2 DG-P 3 DG-P 1 DG-P, 2 DG-P, 3 DG-PQ,
1 Cap 2 Cap 3 Cap
Power Losses 224.59 152.04 83.224 71.677 69.429 23.17 7.233 4.123 (KW)
Loss reduction - 32.30 62.94 68.09 69.09 89.68 96.78 98.16
(%)
Vworst inpu 0.9102 0.9307 0.9683 0.9789 0.9790 0.9725 0.9943 0.9963
(Bus No) (65) (65) (27) (65) (65) (27) (50) (50)
C1 size inM V ar - 1.330 - - - 1.300 0.375 0219
(Bus No) (61) - - - (61) (17) (3)
C2 size inM V ar - - - 1.253 0.050
(Bus No) (61) (29)
C3 size inM V ar - - - 0.355
(Bus No) (49)
DG1-P size inM W - - 1.873 0.532 0.5351 1.828 0.520
-(Bus No) (61) (17) (11) (61) (17)
DG2-P size inM W - - - 1.781 0.3770 - 1.731
-(Bus No) (61) (18) (61)
DG3-P size inM W - - - - 1.7175 - -
-(Bus No) (61)
DG1-PQ - - - 0.7063
size inM V A pf = 0.7342
(Bus No) (11)
DG2-PQ - - - 0.391
size inM V A pf = 0.8558
(Bus No) (17)
DG3-PQ - - - 2.1322
size inM V A pf = 0.830
(Bus No) (61)
8L. F. Ochoa and G. P. Harrison, “Minimizing energy losses:
optimal accommodation and smart operation of renewable dis-tributed generation,”IEEE Transactions on Power Systems, Vol. 26, No. 1, pp. 198-205, 2011.
9N. Khalesi, N. Rezaei and M. R. Haghifam, “DG allocation with
ap-plication of dynamic programming for loss reduction and reli-ability improvement,”International Journal of Electrical Power
&Energy Systems, Vol. 33, No. 2, pp. 288-295, 2011.
10S. Kotamarty, S. Khushalani and N. Schulz, “Impact of
analy-FIG. 5. Voltage profile of the IEEE 33-bus network in different scenarios.
TABLE VII. Comparing the active power loss (KW) in IEEE 69-BUS network with different algorithms
Scenarios Base Case 1 DG-P 2 DG-P 3 DG-P 2 DG-P, 2 Cap
CSA 224.59 83.224 71.677 69.429 7.233
IMDE22 - - 70.92 - 13.833
PSO29 - 83.17 71.96 69.89 25.9
FIG. 6. Comparing the active power loss of the IEEE 33-bus network in different scenarios.
sis,”Electric Power Systems Research, Vol. 78, No. 9, pp. 1537-1545, 2008.
11M. A. Masoum, M. Ladjevardi, A. Jafarian and E. F. Fuchs,
FIG. 7. Comparing the weakest bus voltage of the IEEE 33-bus network in different scenarios.
FIG. 8. Convergence curve of implementing CSA to the IEEE 33-bus network: (a) case 1 Cap(b)case 1 DG-P(c) case 2 DG-P, 2 Cap(d)3 DG-P.
TABLE VIII. Comparing the voltage (pu) and the place of the weakest bus in IEEE 69-BUS network with different algorithms
Scenarios Base Case 1 DG-P 2 DG-P 3 DG-P 2 DG-P, 2 Cap
CSA 09102 (65) 0.9683 (27) 0.9789 (65) 09790 (65) 0.9943 (50)
IMDE22 - - 0.9808 (65) - 0.9915 (68)
PSO29 - - - - 0.97 (27)
2004.
12S. Sultana and P. K. Roy, “Optimal capacitor placement in
ra-dial distribution systems using teaching learning based optimiza-tion,”International Journal of Electrical Power &Energy Sys-tems, Vol. 54, pp. 387-398, 2014.
13C. S. Lee, H. V. H. Ayala and L. D. S. Coelho, “Capacitor
place-ment of distribution systems using particle swarm optimization approaches,”International Journal of Electrical Power&Energy Systems, Vol. 64, pp. 839-851, 2015.
14J. Vuletic and M. Todorovski, “Optimal capacitor placement
in radial distribution systems using clustering based optimiza-tion,”International Journal of Electrical Power &Energy Sys-tems, Vol. 62, pp. 229-236, 2014.
15M. M. Aman, G. B. Jasmon, K. H. Solangi, A. H. A. Bakar and
H. Mokhlis, “Optimum simultaneous DG and capacitor place-ment on the basis of minimization of power losses,”International Journal of Computer and Electrical Engineering, Vol. 5, No. 5, 2013.
16H. R. Esmaeilian, O. Darijany and M. Mohammadian,
“Opti-mal placement and sizing of DG units and capacitors simultane-ously in radial distribution networks based on the voltage stabil-ity securstabil-ity margin,”Turkish Journal of Electrical Engineering&
Computer Science, pp. 1-14, 2014.
17M. Kowsalya, “Optimal distributed generation and capacitor
FIG. 9. Convergence curve of implementing CSA to the IEEE 69-bus network: (a) case 1 Cap(b)case 1 DG-P(c) case 2 DG-P, 2 Cap(d)3 DG-P.
FIG. 11. Comparing the active power loss of the IEEE 69-bus network in different scenarios.
FIG. 12. Comparing the weakest bus voltage of the IEEE 69-bus network in different scenarios.
Engineering (ICAEE)-IEEE, pp. 1-6, 2014.
18R. Baghipour and S. M. Hosseini, “Placement of DG and
ca-pacitor for loss reduction, reliability and voltage improvement in distribution networks using BPSO,”International Journal of Intelligent Systems and Applications, Vol. 4, No. 12, 2012.
19M. N. B. Muhtazaruddin, D. T. Nguyen, F. Goro and J. B. J.
Jas-rul, “Optimal distributed generation and capacitor coordination for power loss minimization,”In T&D Conference and Exposi-tion, IEEE PES, pp. 1-5, 2014.
20M. Heydari, S. M. Hosseini and S. A.Gholamian, “Optimal
place-ment and sizing of capacitor and distributed generation with har-monic and resonance considerations using discrete particle swarm optimization,”International Journal of Intelligent Systems and Applications, Vol. 5, No. 7, 2013.
21A. Rahiminejad, A. Aranizadeh and B. Vahidi,
“Simultane-ous distributed generation and capacitor placement and sizing in radial distribution system considering reactive power mar-ket,”Journal of Renewable and Sustainable Energy, Vol. 6, No. 4, 2014.
22A. Khodabakhshian and M. H. Andishgar, “Simultaneous
place-ment and sizing of DGs and shunt capacitors in distribution sys-tems by using IMDE algorithm,”Electrical Power and Energy Systems, Vol. 82, pp. 599-607, 2016.
23D. H. Wolpert and W. G. Macready, “No free lunch theorems
for optimization,”IEEE Transactions on Evolutionary Compu-tation, Vol. 1, pp. 67-82, 1997.
24A. Askarzadeh, “A novel metaheuristic method for solving
con-strained engineering optimization problems: Crow search algo-rithm,”Computers and Structures, Vol. 169, pp. 1-12, 2016.
25R. S. Chandrashekhar, P. V. N. Prasad and A. J. Laxmi,
“Place-ment of distributed generator, capacitor and DG and capacitor in distribution system for loss reduction and reliability improve-ment,”Available at: www.jee.ro
26R. Baghipour and S. M. Hosseini, “Placement of DG and
ca-pacitor for loss reduction, reliability and voltage improvement in distribution networks using BPSO,”International Journal of Intelligent Systems and Applications, Vol. 4, No. 12, pp. 57-64, 2012.
27M. Kowsalya, “Optimal distributed generation and capacitor
placement in power distribution networks for power loss mini-mization,”In:International Conference on Advances in Electrical Engineering (ICAEE)-IEEE, pp. 1-6, 2014.
28K. Muthukumar and S. Jayalalitha, “Optimal placement and
siz-ing of distributed generators and shunt capacitors for power loss minimization in radial distribution networks using hybrid heuris-tic search optimization technique,”International Journal of Elec-trical Power &Energy Systems, Vol. 78, pp. 299-319, 2016.
29M. M. Aman, G. B. Jasmon, K. H. Solangi, A. H. A. Bakar and
H. Mokhlis, “Optimum simultaneous DG and capacitor place-ment on the basis of minimization of power losses”International Journal of Computer and Electrical Engineering, Vol. 5, No. 5, pp. 516-522, 2013.
Hassan Barati was born in Dezful, Iran, in 1969. He received the B.Sc. de-gree in electronic engineer-ing from the Isfahan Uni-versity of Technology, Isfa-han, Iran, in 1993, the M.Sc. degree in electrical engineer-ing from the Tabriz Univer-sity, Tabriz, Iran, in 1996 and the Ph.D. degree in Electri-cal Engineering from Science and Research Branch, Islamic Azad University, Tehran, Iran, in 2007. Currently, he is an Assistant Professor in the Electrical Engineering Department, Dezful Branch, Islamic Azad University, Dezful, Iran. His research inter-ests are power systems operation & Reliability, restruc-tured power systems, Micro-grids, Smart Grids, FACTS devices.