Design of Pollution Control System Using
LabVIEW
G.Kanmani
1, S.Reshma
2, H.Swathi
3, R.RajPrabhu
4U.G Student, Dept. of Electronics & Instrumentation Engineering, Kamaraj College of Engineering & Technology,
Virudhunagar, Tamil Nadu, India. 1, 2 & 3
Assistant professor, Dept. of Electronics and Instrumentation Engineering, Kamaraj College of Engineering and
Technology, Virudhunagar, Tamil Nadu, India. 4
ABSTRACT: Pollution is one of the major social causes in current scenario. It develops some serious disorders and
problems for all the living being in the earth. It is the main responsibility of all the industry to control the pollution. One of such industry where the pollution must be controlled and to be monitored is Thermal power plant. The type of pollution caused by Thermal power plant is Air Pollution. The exhaust gas coming out of the chimney has four major components. They are NOx, SOx, CO, O2. The proportion of NOx, O2 components must be maintain to ensure a pollution free environment. So, we are going to use NOx gas sensor to indicate the amount of the NOx present in the exhaust gas and also use PID controller to control the amount of NOx present in the exhaust gas.
KEYWORDS: Exhaust gas, PID controller, LabVIEW.
I. INTRODUCTION
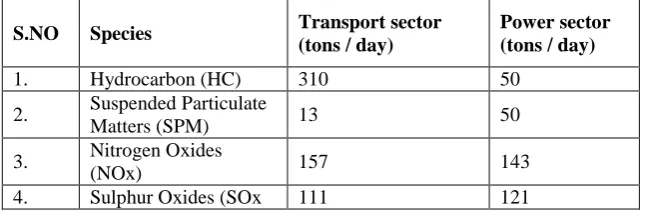
Acidification of global and aquatic eco-systems due to atmospheric deposition has been the focal point of research in environmental science and policy in the last three decades. The main emissions gases are carbon monoxide (CO), nitrogen oxides (NOx), Sulphur oxides (SO2), chlorofluorocarbons (CFC), and air-borne inorganic particles such as fly ash, soot, and other trace gas species. These emissions are responsible for heating up the atmosphere, producing a harmful global environment. SO2 and NOx are at the core of the most serious air pollution problems in Asia. The worldwide production of Sulphur dioxide (SO2) and NOx by human activities is estimated to be 1.4 million tons per year. Air pollutants are potentially emitted from coal-fired power stations. In India, SO2 and NOx emissions due to consumption of coal have been calculated for the various years in different sectors, including the projections for the future (Mitra& Sharma 2002) as shown in Table 1.1. The main emissions from coal combustion at thermal power plants are carbon monoxide (CO), Nitrogen oxide (NOX), Sulphur oxide (SOX), chlorofluorocarbons (CFC) and Suspended Particulate Matters (SPM) such as fly ash, soot, and other trace gas species. Research is highly essential on population exposure to these polluting gases and these emissions are considered to be responsible for heating up the atmosphere and producing harmful global environment.
Table 1.1 Pollutants emitted (tons/day) from different sectors in India
S.NO Species Transport sector
(tons / day)
Power sector (tons / day)
1. Hydrocarbon (HC) 310 50
2. Suspended Particulate
Matters (SPM) 13 50
3. Nitrogen Oxides
(NOx) 157 143
The Pollution Control Board (PCB) in India combined with the Ministry of Environment and Forest (MOEF) fixes the standard norms at different rates based on the emission produced by the industry. But it is much difficult to achieve the limit set by MOEF. The reason behind the SO2 and NOx emission is more in India due to the property of Indian coal, while burning it produces harmful SO2 and NOx emission into the atmosphere.
SO2 is a colorless gas with a sharp odor produced from the burning of coal. High concentrations of SO2 can have serious effects on health, but more important today is its role as a precursor to the formation of particulates, a ubiquitous threat to public health and the environment. Long-range transport of sulfuric compounds also leads to the deposition of sulfur in soils and waterways in regions distant from the source of emissions. Sulfur deposition, more commonly known as acid rain, contributes to acidification of forests and lakes. NO2also contributes to fine particulates and acidification, NO2contributes to ground-level ozone, which is formed by the atmospheric mixing of NO2and volatile organic compounds (VOCs) and facilitated by warm temperatures and sunlight( Beirle et al 2012). Particulates
of matter contribute to smog, haze, and respiratory illnesses and lung disease.
II. CONTROLLER BLOCK DIAGRAM
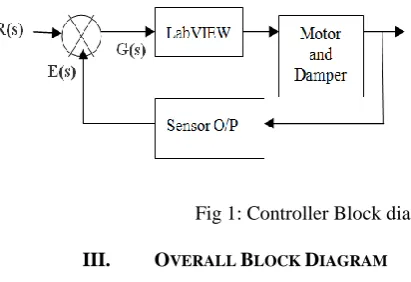
The Block diagram given below represents the control action performed by the controller. This Block diagram helps us to derive the transfer function of the system. The LabVIEW mentioned in the block diagram plays the controller part.
Fig 1: Controller Block diagram
III. OVERALL BLOCK DIAGRAM
This shows the overall block diagram. The sensor supplies the input to the PC where we have the labVIEW software which helps in the control action. The controller output is given to DAQ card which is then connected with the motor. The motor helps to control the movement of the damper. The DAQ card is used for hardware and software interface.
lower than the current standards, yet undoubtedly achievable (Srivastava, Miller et al. 2004). It is given by the following details
Particulates (PM10) 0.006 lb/mmBtu
NO2 0.016 lb/mmBtu (or up to 99.5% reduction)
SO2 0.040 lb/mmBtu (or up to 99% reduction)
V. LABVIEW
Laboratory Virtual Instrument Engineering Workbench (LabVIEW) is a system-design platform and development environment for a visual programming language from Instruments. The graphical language is named "G"; not to be confused with G-code. Originally released for the Apple Macintosh in 1986, LabVIEW is commonly used for data acquisition, instrument control, and industrial automation on a variety of operating systems (OSs), including Microsoft Windows, various versions of Unix, Linux, and MacOS. The latest version of LabVIEW is 2016, released in August 2016.
VI. GAS SENSOR
The gas sensor used in this project is MQ – 2 sensors. Structure and configuration of MQ-2 gas sensor is composed by micro AL2O3 ceramic tube, Tin Dioxide (SnO2) sensitive layer, measuring electrode and heater are fixed into a Parts Materials 1 Gas sensing layer SnO2 2 Electrode Au 3 Electrode line Pt 4 Heater coil Ni-Cr alloy 5 Tubular ceramic Al2O3 6 Anti-explosion network Stainless steel gauze (SUS316 100-mesh) 7 Clamp ring Copper plating Ni 8 Resin base Bakelite 9 Tube Pin Copper plating Ni crust made by plastic and stainless steel net. The heater provides necessary work conditions for work of sensitive components. The enveloped MQ-2 has 6 pin, 4 of them are used to fetch signals, and other 2 are used for providing heating current.
VII. DATA ACQUISITION CARD (DAQ)
Data acquisition involves gathering signals from measurement sources and digitizing the signals for storage, analysis, and presentation on a PC. Data acquisition systems come in many different PC technology forms to offer flexibility when choosing your system. You can choose from PCI, PXI, PCI Express, PXI Express, PCMCIA, USB, wireless, and Ethernet data acquisition for test, measurement, and automation applications. Consider the following five components when building a basic data acquisition system.
Transducers and sensors
Signals
Signal Conditioning
DAQ hardware
Driver and application software
VIII. MOTOR
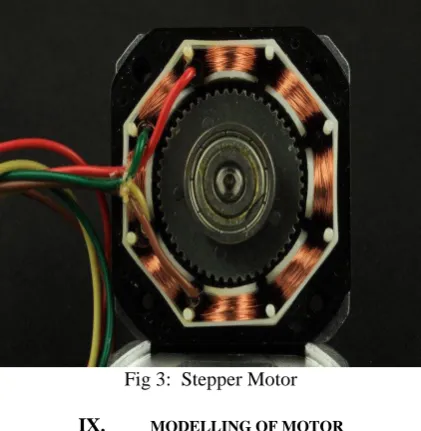
Fig 3: Stepper Motor
IX. MODELLING OF MOTOR
The response to a single-step position increment of Figure 16 allows the identification of a transfer function for this case. The average self-inductance and stator-circuit resistance of each phase are respectively L = 6.4 mH and r = 8ohm, therefore, the time constant of the motor, defined as L/r, is 0.8 ms. However, the transfer function of a stepper motor with a single-phase drive does not include this factor, and for a single-step increment it is expressed as a second order function.
G(s) = wn2 _________________.e-Ts s2 + 2ξwns + wn
2
The constant T is of 2 ms. Measuring the relative overshoot and the 5% settling time, the damping ratio and the natural frequency wn. and wn have the form of:
ξ= D/2Jwn wnp=√2p2ФMnIo/J
being: D ˆ viscous damping coefficient which accounts for the presence of air and friction, and for the second order electromagnetic effects arising from hysteresis and eddy currents; J = inertia of the rotor; p = number of poles; ФMn = peak flux linkage produced by the permanent magnet; and Io= initial.
X. PID CONTROLLER
A proportional–integral–derivative controller (PID controller) is a control loop feedback
Fig 4. PID controller diagram.
XI. POWER SUPPLY CIRCUIT
The power supply system is mainly designed for providing supply voltage for the sensor. The circuit voltage for MQ-2 sensor is 5V. The power supply circuit is so designed to produce 5V supply. This supply is given to the Vcc of the sensor.
Fig 5. Power Supply circuit.
XII. CONCLUSION
In this project we have used a most powerful Simulator/software named, LabVIEW. Though this is costly, it gives more accuracy. As pollution has become a major cause nowadays, reducing the level of emission of gases in many industries are important. We have shown a more optimal way to solve the problem.
REFERENCES
[1] A stepper motor-driven semi-active variable damper ± Part 1: stepper motor positioning control and performance by X. Carrera Akutain* and J.M. Carballo TECNUN (University of Navarra), J. Savall and J. VinÄolas (University of Navarra).
[2] , “Technology 1993. Industrial electronics,” IEEE Spectr., vol. 30, pp. 58–60, Jan. 1993.