Selvam College of Technology, Namakkal, Tamilnadu, India
Design & Fabrication of Measuring Fixture
for Plotting FLD using ERICHSEN cup and
USB Microscope
M.Prasath1, M.Anbalagan3, P.Sakthivel2
PG Scholar, Department of Mechanical Engineering, Selvam College of Technology, Namakkal, Tamilnadu, India1,2
Associative Professor, Department of Mechanical Engineering, Selvam College of Technology, Namakkal,
Tamilnadu, India3
ABSTRACT: Forming limit diagram to solve sheet metal problem using microscope in practical sheet metal of zinc of different size which are subjected to form cup by means of Erichsen cup apparatus. After forming cup, by means of USB Optical Microscope the image of crack, neck and normal surface of sheet metal are taken and compare the grid by means of two different cases, pieces of different dimensions and angle. For testing the sheet metal in angle a set up were the microscope can be easily mounded was designed. The grid is compared and the forming limit diagram of the sheet metal is drawn in these two cases. Forming limit diagram is an effective tool to evaluate the formability of sheet metal in various strain condition. And the formability property of sheet metal is analysed and fracture analysis was done. The main design of this project is fixture for fixing microscope which can be focus in different angle.
I. INTRODUCTION
The formability and fracture analysis are the two important scientific analysis of any metal sheet subjected to form into different shape of end components. More number of complicated shapes in sheet metal manufacturing and rapid production techniques evolution in the modern world urges us to use the forming techniques. The practical problems faced by the design and production team are how to select a material with desired property, based on the material properties under forming and fracture. In the past decade many researchers have evolved the experimental data’s [1-4] through different investigations in different sheet materials. Zinc alloys play an important role in determining the modern design of Engineering Materials, because of their unique desirable properties like corrosion resistance, availability and wide application. It is the task of researchers to predict and formulate the properties of these alloys with various composition, size and working condition and model it for the future reference.
For the testing of sheet metal we need a suitable testing apparatus so we use Erichsen cup apparatus for cupping the sheet metal. The Erichsen cup apparatus can be used in any metal dimension even for nano type metal, by introducing a new method with the microscopic image taken in different angles and measuring the grid diameter.
1.1 Erichsen cupping test
The Erichsen cupping test is used to assess the stretch formability of sheets. This test can be classified as a stretch forming test which simulates plane stress biaxial tensile deformation. For the Erichsen test a sheet specimen blank is clamped firmly between blank a holder which prevents the in-flow (feeding) of sheet volume from under the blank holder into the deformation zone during the test.
1.1.1 Method of cupping
Selvam College of Technology, Namakkal, Tamilnadu, India
1.1.2 Other experimental methods
Other experimental methods that are mostly used are as follows:
Hydraulic Bulge Test
Swift Cupping
Stamp hydro forming machine.
Mechanical press
1.1.3 Use of cupping
The Erichsen cupping test is a ductility test, which is employed to evaluate the ability of metallic sheets and strips to undergo plastic deformation in stretch forming. The test consists of forming an indentation by pressing a punch with a spherical end against a test piece clamped between a blank holder and a die, until a through crack appears. The depth of the cup is measured. By using the cupping the photo taken using microscope is checked and the formability property is measured.
1.2 USB Microscope
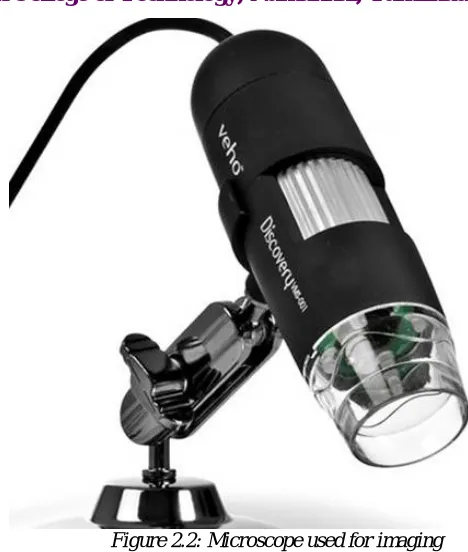
With magnification up to 200x and USB 2 adaptability and a resolution of 2 Mega Pixel these microscopes are very good for taking photographs of very small objects, its very much useful for online inspection of tiny specimens. The image can directly be viewed on computer, and with measuring software one can even measure the dimensions of the specimen. Applications are varied in Schools, colleges, industries, Electronic Inspection, Documentation and many.
Here by using a set up the imaging is performed and the pictures are taken and by using a standard measurement the enlarge image grid dimensions are measured.
1.3 Measuring Fixture For Microscope
A machine set up is designed for taking the images obtained by the cupping in the sheet metal. In this set up we can take images of the fracture, neck and safe zone , and also we can take images in different angle and thus by analysing the grid of sheet metal we can easily plot the forming limit diagram.
1.4 Standard Dimension
By means of measuring the microscopic image obtained from microscope using computer by fixing a ohp sheet in front of the desktop and the standard measuring scale is plotted , then we can easily measure the grid dimension of microscopic image of cupped specimen.
1.5 Formability
Formability is the ability of a given metal work piece to undergo plastic deformation without being damaged. The plastic deformation capacity of metallic materials, however, is limited to a certain extent. Processes affected by the formability of a material include: rolling, extrusion, forging, roll forming, stamping, and hydro forming
1.5.1 Fracture Strain
A general parameter that indicates the formability and ductility of a material is the fracture strain which is determined by a uniaxial tensile test (see also fracture toughness). The strain identified by this test is defined by elongation with respect to a reference length (e. g. 80 mm for the standardized uniaxial test of flat specimens pursuant to EN 10002). It is important to note that deformation is homogeneous up to uniform elongation. Strain subsequently localizes until fracture occurs. Fracture strain is not an engineering strain since distribution of the deformation is inhomogeneous within the reference length. Fracture strain is nevertheless a rough indicator of the formability of a material. Typical values of the fracture strain are 7% for ultra-high-strength material and well over 50% for mild-strength steel.
1.5.2 Forming Limits For Sheet Forming
Selvam College of Technology, Namakkal, Tamilnadu, India
less homogeneous deformation takes place in and around the subsequent neck location in the early stable deformation stage, almost all deformation is concentrated in the neck zone during the quasistable and instable deformation phase. This leads to material failure manifested by tearing. Forming limit curves depict the extreme but still possible deformation a sheet material may undergo during any stage of the stamping process. These limits depend on the deformation mode and the ratio of the surface strains. The major surface strain has a minimum value when plane strain deformation occurs, which means that the corresponding minor surface strain is zero. Forming limits are a specific material property. Typical plane strain values range from 10% for high-strength grades and 50% and above for mild-strength materials and those with very good formability.
1.5.3 Ductility
Another failure mode that may occur without any tearing is ductile fracture after plastic deformation (ductility). This may occur as a result of bending or shear deformation (in plane or through the thickness). The failure mechanism may be due to void nucleation and expansion on a microscopic level. Micro cracks and subsequent macro cracks may appear when deformation of the material between the voids has exceeded the limit. Extensive research has focused in recent years on understanding and modelling ductile fracture. The approach has been to identify ductile forming limits using various small-scale tests that show different strain ratios or stress tri axial ties. An effective measure of this type of forming limit is the minimum radius in roll-forming applications (half the sheet thickness for materials with good and three times the sheet thickness for materials with low formability).
1.5.4 Strength
Strength is the property that enables a metal to resist deformation under load. The ultimate strength is the maximum strain a material can withstand. Tensile strength is a measurement of the resistance to being pulled apart when placed in a tension load. Fatigue strength is the ability of material to resist various kinds of rapidly changing stresses and is expressed by the magnitude of alternating stress for a specified number of cycles. Impact strength is the ability of a metal to resist suddenly applied loads and is measured in foot-pounds of force.
1.5.5 Hardness
Hardness is the property of a material to resist permanent indentation. Because there are several methods of measuring hardness, the hardness of a material is always specified in terms of the particular test that was used to measure this property. Rockwell, Vickers, or Brinell are some of the methods of testing. Of these tests, Rockwell is the one most frequently used. The basic principle used in the Rockwell testis that a hard material can penetrate a softer one. We then measure the amount of penetration and compare it to a scale. For ferrous metals, which are usually harder than nonferrous metals, a diamond tip is used and the hardness is indicated by a Rockwell "C" number. On nonferrous metals, that are softer, a metal ball is used and the hardness is indicated by a Rockwell "B" number. To get an idea of the property of hardness, compare lead and steel. Lead can be scratched with a pointed wooden stick but steel cannot because it is harder than lead.
1.5.6 Toughness
Toughness is the property that enables a material to withstand shock and to be deformed without rupturing. Toughness may be considered as a combination of strength and plasticity. Table 1-2 shows the order of some of the more common materials for toughness as well as other properties.
1.5.7 Elasticity
When a material has a load applied to it, the load causes the material to deform. Elasticity is the ability of a material to return to its original shape after the load is removed. Theoretically, the elastic limit of a material is the limit to which a material can be loaded and still recover its original shape after the load is removed.
1.5.8 Plasticity
Selvam College of Technology, Namakkal, Tamilnadu, India
1.5.9 Brittleness
Brittleness is the opposite of the property of plasticity. A brittle metal is one that breaks or shatters before it deforms. White cast iron and glass are good examples of brittle material. Generally, brittle metals are high in compressive strength but low in tensile strength. As an example, you would not choose cast iron for fabricating support beams in a bridge.
1.5.10 Malleability
Ductility is the property that enables a material to stretch, bend, or twist without cracking or breaking. This property makes it possible for a material to be drawn out into a thin wire. In comparison, malleability is the property that enables a material to deform by compressive forces without developing defects. A malleable material is one that can be stamped, hammered, forged, pressed, or rolled into thin sheets
1.6 Forming Limit Diagram
A forming limit diagram, also known as a forming limit curve, is used in sheet metal forming for predicting forming behaviour of sheet metal. The diagram attempts to provide a graphical description of material failure tests, such as a punched dome test. In order to determine whether a given region has failed, a mechanical test is performed. The mechanical test is performed by placing a circular mark on the work piece prior to deformation, and then measuring the post-deformation ellipse that is generated from the action on this circle. By repeating the mechanical test to generate a range of stress states, the formability limit diagram can be generated as a line at which failure is onset. Mostly the forming limit diagram is used to determine the formability and the material property
This work is based on tensile properties and formability of zinc/Aluminium sheets in relation to the strain rate effect. The uniform elongation and the strain hardening coefficient decrease gradually when the strain rate increases. In addition, an erichsen cup apparatus is used for forming to check the fracture, neck and safe. By using digital microscope the fracture, neck and safe region where analyse using grid deformation in the metal specimen. An FLD is drawn by using the experiment by performing cupping with different dimension. A conventional FLD represents the locus of the necked or fractured position of sheet metals in the space of in-plane principal strains, ε1 −ε2, where ε1 is the major strain and ε2 is the minor strain. The locus of the forming limit is called the forming limit curve (FLC), and the FLC is affected by many factors, such as the forming speed, the lubrication condition, the thickness of sheets, the strain hardening, and the anisotropy of the sheet metals.
1.7 Sheet Metals
Sheet metal is simply metal formed into thin and flat pieces. It is one of the fundamental forms used in metalworking, and can be cut and bent into a variety of different shapes. Countless everyday objects are constructed of the material. Thicknesses can vary significantly, although extremely thin thicknesses are considered foil or leaf, and pieces thicker than 6 mm (0.25 in) are considered plate.Sheet metal is available in flat pieces or as a coiled strip. The coils are formed by running a continuous sheet of metal through a roll slitter.
1.7.1 Type Of Metal
Commonly used steel sheet metal ranges from 30 gauge to about 8 gauge. The larger the gauge number, the thinner the metal. Gauge is measured in ferrous (iron based) metals while nonferrous metals such as aluminium or copper are designated differently;
There are many other metals are also using each metal have there own property but to make known we need to perform forming process and some other testing process under different condition.
1.7.2 Metal Forming
Many researchers are introducing many methods to determine the formability property of sheet metal erichsen cup is one of the forming method, in these method the metal are subjec5ted to fracture by penetrating a ball on to it.
1.7.3 Zinc
Selvam College of Technology, Namakkal, Tamilnadu, India
for the future reference. The material Zinc alloy of grade 2, which is obtained in cold rolled condition, is used in the project.
II. FABRICATION METHODOLOGY
2.1 Description Of Equipment
2.1.1 Erichsen Cup
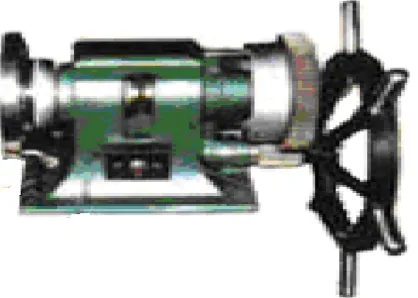
An Erichsen universal cupping test machine, model 142/20 of the Erichsen company. Rectangular sheet specimens are cut out and clamped without any lubrication between two ring dies. A ball punch (diameter = 20 mm) is forced into the sheet until fracture occurs. The distance the punch moves before cracks begin to appear (height of dome) is measured. Erichsen testing machine is designed to carry out the test for knowing plasticity of metals. This machine measures the erichsen's number of sheet metal to assess its suitability for press work or toughness. Quick clamping and manual operation facilitates faster and trouble free working of the machine. The machine has a standard ball which is made to penetrate through a clamped sample sheet up to 2mm thickness.
Standards: IS10175 (part 1) & ISO 8490
An erichsen cup apparatus consist of a hand wheel using gears the hand wheel is connected to a ball type punch of diameter 2mm and there is a space for fixing the sheet metal and after fixing by rotating the hand wheel the ball penetrate through the metal. And the model is in figure 2.1.
Figure 2.1: Erichsen cup apparatus
2.1.2 USB Microscope
Selvam College of Technology, Namakkal, Tamilnadu, India
Figure 2.2: Microscope used for imaging
A digital microscope is a variation of a traditional optical microscope that uses optics and a charge-coupled device (CCD) camera to output a digital image to a monitor, sometimes by means of software running on a computer. A digital microscope differs from an stereo microscope in that there is no provision to observe the sample directly through an eyepiece. Since the optical image is projected directly on the CCD camera, the entire system is designed for the monitor image. The optics for the human eye is omitted.
Digital microscope is the term commonly used for low price commercial microscopes designed for use with a computer. A primary difference between a stereo microscope and a digital microscope is the magnification. With a stereo microscope the magnification is found by multiplying the lens magnification by the eyepiece magnification. Since the digital microscope does not have an eyepiece, the magnification cannot be found using this method. Instead the magnification for a digital microscope is found by how many times larger the sample is reproduced on the monitor. Therefore the magnification will depend on the size of the monitor. The average digital microscope system has a 15" monitor, would result in an average difference in magnification between an optical microscope and a digital microscope of about 60%. Thus the magnification number of a stereo microscope is usually 60% larger than the magnification number of a digital microscope.
Most microscope users understand how magnification is optically defined and how it applies when comparing various instruments. Higher magnifications permit seeing smaller specimens and usually the higher the better is the mantra among microscope users.
If you study the optics of microscopes you will soon discover that one of the most important optical “numbers” is the numerical aperture, NA, of the system. The higher the NA value (unit less) the better. If the NA value is not specified you are probably not looking at a high quality instrument. You will also discover that the upper NA limit for “normal” high grade microscopes approaches 0.95 (perhaps as exceptionally high as 1.30) for its NA value.
Selvam College of Technology, Namakkal, Tamilnadu, India
1000x you will need to use oil immersion techniques in order to get the resolution you need to actually see the detail at 1000x.
2.1.3 Fixture For Microscope
Figure 2.3: Fixture for microscope
A machine set up is designed for taking the images obtained by the cupping in the sheet metal. In this set up we can take images of the fracture, neck and safe zone , and also we can take images in different angle and thus by analysing the grid of sheet metal we can easily plot the forming limit diagram. a microscope setup is used of testing the sheet metal is designed which are of made to take the magnified image of metal formed region in different angle with specific focal length. Here in the set up we can easily fit the microscope on the setup, and there is a table by which we can place the test specimen and imaging can be easily performed by the setup. The set up is made of metals and are of specific angular dimensions, which are specially designed for imaging the neck and crack in different angle. Figure 2.3 shows the fixture.
2.1.4 Test Specimen
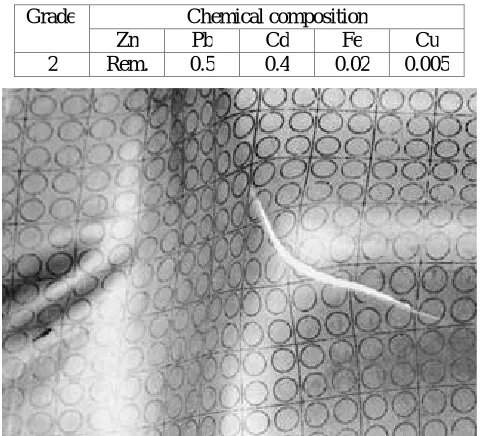
The material Zinc alloy of grade 2, which is obtained in cold rolled condition, The chemical composition and microstructure of Al 5086 alloy considered for the study were observed as per the standard procedure followed for Erichsen cupping test and specimen shown in the Fig.2.4 respectively. The chemical combination of zinc is lead 0.5%, cadmium 0.4%, iron 0.02%, copper 0.005% and remaining zinc.
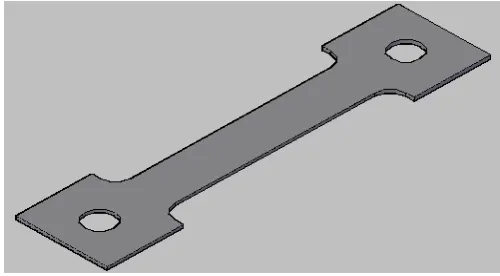
For this project the specimen are cutted into different dimension as 70x20x1, 70x40x1, 70x60x1 and 70x70x1. in a particular pattern as in the figure for getting different grid formation for plotting forming limit diagram.
Selvam College of Technology, Namakkal, Tamilnadu, India
2.2 Design And Drawing
2.2.1 Microscope Fixture
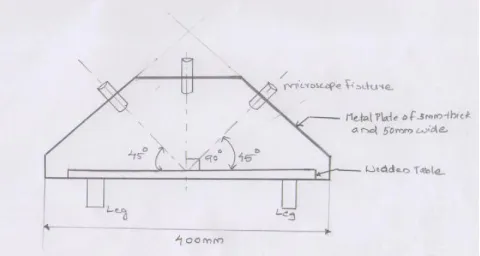
Figure 2.5: Fixture for angular positional measurement
A micro scope set up is designed in such a way that the imaging can be performed by fixing the digital microscope on the specific region.
The designing of setup required 3mm thick metal plate of width 50mm is cutted and shaped according to angle and dimension and the hollow cylinder is welded according to dimension and angle and also a stand is fixed by means of metal plate as shown in figure 2.5
Figure 2.6: Fixture design 2D drawing
Here in this design the wooden plate of 400mm is taken as the base and a wooden plate is placed over it as a table. And the plate are cutted and bended to form the shape as in figure and 3 hollow cylindrical metal piece is fixed in surface of plate are in 450 of angle and the plate is fixed such that each cylinder occupy 450 of angle the design of the microscope fixture in 3D is as in figure 2.6
2.3 Working Procedure
2.3.1 Specimen Preparation
Selvam College of Technology, Namakkal, Tamilnadu, India
2.3.2 Cupping Using Erichsen Cup Apparatus
After the preparation of sheet metal the metals are subjected to cupping, cupping is performed by fixing the sheet metal in between the space and tightly fix the specimen. Then by rotating the wheel the ball inside the apparatus of 2mm diameter will penitrate through the metal specimen from the opposite side we can view the cupping when a fracture form stop the penitrating. Ang take the specimen out.
2.3.3 Imaging Using Microscope And Its Fixture
After cupping process the cupped specimen is placed in the base of the test setup, where in the test setup the microscope can be fixed and imaging can be performed in angles 450 and 900 and the imaging is performed. And image of neck is taken by using USB microscope is saved on computer.
2.3.4 Measuring Major And Minor Diameter By Scale
After performing cupping and imaging by microscope the image is saved in computer then the image is measured by means of a scale which is standardized and the scale by fixing on desktop screen the grid dimension is measured.
2.3.5 Calculating Major And Minor Strain
After performing measurement of grid formation in cupped specimen calculate the major and minor strain by means of following equation:
Major strain = [( major diameter - standard diameter) / standard diameter] x 100% Minor strain = [( minor diameter – standard diameter) / standard diameter] x 100% Thus the major strain and minor strain are calculated in the cupped metal.
2.3.6 Plotting Forming Limit Diagram
By using the major strain and minor strain the forming limit diagram is plotted as in the graph as in x- axis the minor strain and y- axis the major strain. Thus the forming limit diagram is drawn and the formability property and fracture analysis can be performed
2.4 Experimental Analysis
Table 2.1: Chemical composition of Zinc grade 2
Figure 2.7: zinc metal specimen with deformed grid coating
Grade Chemical composition
Zn Pb Cd Fe Cu
Selvam College of Technology, Namakkal, Tamilnadu, India
In this project the metal specimen used for forming is of zonc metal and the metal is subjected to cupped by means of erichsen cup, there are many properties of sheetmetal need to be discovered can by identified by this method so we need to identify the chemical combination of zinc. Here table 2.1 shows the chemical combination of zinc metal used. And the specimen diagram is in figure 2.7.
s.no Length of specimen Breadth of specimen
1 70mm 20mm
2 70mm 40mm
3 70mm 60mm
4 70mm 70mm
Table 2.2: Dimensions of metals of 0.9mm thickness.
For testing the metal the grid Formed metals are cut into different dimensions which are suitable for obtaining formability property in table 2.2 we can see the different dimension of the preparation of sheet metal and figure 2.8 shows the model of specimen and also the standard grid of the metal specimen before cupping taken in microscope is as shown in figure 2.9.
Figure 2.8: Model specimen of metal by ASTM M8
Figure 2.9: standard dimension of grid taken in microscope
Selvam College of Technology, Namakkal, Tamilnadu, India
Sno Specimen no. Major diameter
Minor diameter
1 Standard 2.5 2.5
2 S1 3.6 2.2
3 S2 3.3 2.65
4 S3 3.5 2.85
5 S4 3.2 3.1
Table 2.3: Measures of major and minor diameter
Figure 2.10: Grid formation after cupping taken using microscope
Sno Specimen no. Major strain Minor strain
1 S1 44 -12
2 S2 32 -2
3 S3 40 14
4 S4 28 24
Table 2.4: calculated major strain and minor strain
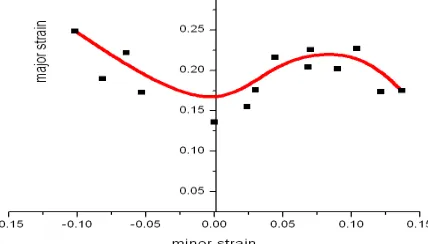
After the calculation of major and minor strain the forming limit diagram is drawn and the figure 2.11 shows FLD of zinc and table 2.4 shows the major and minor diameter of cupped zinc.
Selvam College of Technology, Namakkal, Tamilnadu, India
S no Specimen no. Major strain Minor strain
1 S1 -0.16 0.44
2 S2 -0.04 0.22
3 S3 0.04 0.28
4 S4 0.16 0.2
Table 2.5: major and minor strain of aluminium specimen
And also the metal specimen of aluminium also tested for the comparison of change and the tested aluminium the major strain and minor strain of the aluminium is as shown in figure 2.12 and the strain is in table 2.5.
FLD for Aluminium
0 0.05 0.1 0.15 0.2 0.25 0.3 0.35 0.4 0.45 0.5
-0.2 -0.15 -0.1 -0.05 0 0.05 0.1 0.15 0.2
Minor strain
M
a
jo
r
s
tr
a
in
Figure 2.12 : FLD for aluminium
Also the thickness distribution of zinc along the rolling direction also performed and plotted as in figure 2.13 and thickness along fractured sample also analyzed as in 2.14
Figure 2.13: Thickness distribution along RD
Since, the microstructure of the sheet annealed at all temperatures shows a refined and re crystallized grains show better formability in all temperature of annealing. Therefore, the same sheet exhibits higher formability than the aluminum sheets annealed at other different temperatures.
Selvam College of Technology, Namakkal, Tamilnadu, India
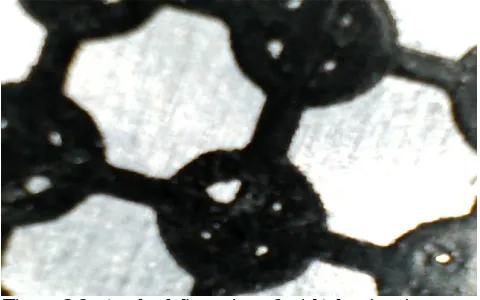
The fracto grapy details are provided in Figs. The shape of the voids is categorized as spherical, prolate, and oblate voids. In the initial stage of research on voids, they are assumed spherical (Tvergaard and V. 1981). Later, it is found that the shape of the voids is taking different shapes depending on the state of stress/strain conditions. The prolate and oblate voids are elliptical in shape. The prolate voids are elongated more in the thickness direction than in the plane of the sheet and the oblate voids are elongated more in the direction of plane of the sheet. Not only the type of voids is affected by the forming conditions but also the number of voids is affected by stress conditions. Among various annealing temperatures taken for the study, we found that there is no much variation recorded, because the zinc re crystallized at low temperature even at atmospheric temperature. This large number of voids is because of the accommodation of high plastic strain by the presence of fully or partially re crystallized grains in the annealed microstructure of Zinc alloy. Microscopic image of fractured surface With 200x and 500x is as in figure 2.15.
Figure 2.15: Microscopic image of fractured surface With 200x and 500x
Figure 2.16: Perpendicular View Of Fractured Zone
Selvam College of Technology, Namakkal, Tamilnadu, India
second phase particles and therefore they are in spherical shape. The perpendicular view of fractured zone is in figure 2.16
2.5 MERITS
Any kind of metal can be tested for formability
Forming limit diagram of sheet metal can be easily plotted
Accurate measurement of grid can be obtained by the use of microscope
Angular view of the setup provide the right image with right focal length
Nano type sheet metal can also be measured
Even costly metal like gold, platinum, silver etc can be tested by using this apparatus
fracture analysis can be determined very easily
this method is simple and easy to perform
overall cost of the material is less
easy of transparency considering other method
small metal piece is necessary for conducting experiment
symmetrical and equal biaxial stretching is possible
2.6 APPLICATION
can be used for testing the sheet metal in automobile manufacturing
can be used in body building for analysing the properties of metal
Aircraft designing
Strength analysis on body of new vehicles
Research & Development
Ship designing
Material designing
Fracture analysis of metal
Determining the formability property
2.7 OBJECTIVE
The focus of this research is to assess the characteristic and formability of sheet metal due to elasticity and plasticity and also performing the simulation of Olsen-Erichsen Test. this study will estimate the ductility of the sheet metal.
2.8 PROJECT SCOPES
This research is focus on the effect of deformation displacement for different material after given modal prescribed displacement. The scopes of this project are:
To test the nano type metal.
To get good dimensional accuracy.
To obtain correct forming limit diagram.
III CONCLUSION
The project carried out by us will provide useful results for the industries and R & D cells and it made an impressing task in the field of small scale industries and automobile maintenance industries. It is very useful for the workers to carry out a number of forming operations on sheet metals. And by using this method forming limit diagram can be easily plotted.
Selvam College of Technology, Namakkal, Tamilnadu, India
By using this method even nano metal can also be formed and we get high of accuracy of measurement. And many reserchers are searching for these kind of mini type testing procedure
REFERENCES
1. Ala hijazi, nikhil yardi and vis madhavan, “determination of forming limit curves using 3d Digital image correlation and in-situ Observation”, proceedings of sampe 2004 - long beach, ca may 16 - 20, 2004
2. A. Barata da rocha, f. Barlat and j. M. Jalinier, “Prediction of the Forming Limit Diagrams of Anisotropic Sheets in Linear and Non-linear Loading”, Materials Science and Engineering, 68 (1984-1985) 151-164
3. H. Danesh, Manesh and A. Karimi Taheri, “Bond strength and formability of an aluminum-clad steel sheet”, Journal of Alloys and Compounds 361 (2003) 138–143
4. Islahuddin Idha Nawawi, “Finite Element Modelling Of Erichsen Olsen Sheet Metal Formability Test” University Malaysia Pahang November 2009
5. M. Jie, C.H.Cheng, L.C.Chan, C.L.Chow, “Forming limit diagrams of strain-rate-dependent sheet metals”, International Journal of Mechanical Sciences 51 (2009) 269–275
6. S.B. Kim, H. Huh, H.H. Bok and M.B. Moon, “Forming limit diagram of auto-body steel sheets for high-speed sheet metal forming”, Journal of Materials Processing Technology 211 (2011) 851–862
7. Ola Kristensson, “Numerically produced forming limit diagrams for metal sheets with voids considering micromechanical effects”, European Journal of Mechanics A/Solids 25 (2006) 13–23