ABSTRACT
VOGEL, NANCY AMANDA. Functional Nanofibers and Colloidal Gels: Key Elements to Enhance Functionality. (Under the direction of Dr. Saad A. Khan).
Nanomaterials bridge the gap between bulk materials and molecular structures and are
known for their unique material properties and highly functional nature which make them
attractive for a variety of potential applications, from energy storage and pollution sensors to
agricultural and biomedical products. These potential applications, coupled with advances in
nanotechnology, have generated considerable interest in nanostructure research. The work
presented in this dissertation focuses on two such nanostructures, electrospun nanofibers and
nanodiamond particles, with an overarching goal of tailoring the material behavior for a
desired outcome.
Our first research theme focuses on realizing the full potential of chitosan
electrospinning by understanding the mechanism that enables fiber formation through
cyclodextrin complexation as a function of solution properties, solvent types, and
cyclodextrin content. We demonstrate that cyclodextrin addition not only enables chitosan
fiber formation, but also extends the composition and solvent window for nanofiber synthesis
while introducing a variety of mat topologies, including three-dimensional, self-supporting
mats. These fiber formation improvements cannot be fully explained by conventional
electrospinning parameters, but instead seem to be related to the molecular interactions
between chitosan and cyclodextrin.
Our second research theme entails the modification of highly water soluble,
aluminum oxide nano-coatings can improve the stability of PVA nanofibers in high humidity
conditions and significantly decrease the solubility of electrospun PVA mats in water, from
seconds to multiple weeks. Controlling mat dissolution allows for the unique opportunity to
modulate small molecule, such as drug, release from nanofibers without altering the core
material so that prolonged release can be readily achieved from highly water soluble
nanofibers.
The final research theme focuses on gaining a fundamental understanding of a new
class of materials, nanodiamond, so that a desired microstructure can be achieved via
functionalization or manipulating processing parameters. In particular, we utilize both steady
and dynamic rheology techniques to systematically investigate systems of nanodiamonds
dispersed in model nonpolar (mineral oil) and polar (glycerol) media. In both cases,
self-supporting colloidal gels form at relatively low nanodiamond content; however, the gel
behavior is highly dependent on the type of media used. Nanodiamonds dispersed in mineral
oil exhibit characteristic colloidal gel behavior, with a rheological response that is
independent of both frequency and time. However, nanodiamonds dispersed in glycerol
exhibit a time dependent response, with the strength of the colloidal gels increasing several
orders of magnitude. We attribute these rheological differences to changes in solvent
complexity, where new particle-solvent and particle-particle interactions have the potential to
delay optimal gel formation. In addition to colloidal gel formation, we use large oscillatory
strains to probe the effect of processing parameters on microstructure disruption and
recovery. The results indicate that the formation and rearrangement of the nanodiamond
is incomplete, with the strength of the recovered gel being significantly reduced. In contrast,
the original strength of the nanodiamond/glycerol gels is recoverable as the system
restructures with time. The practical implications of these results are significant as it suggest
© Copyright 2015 Nancy Amanda Vogel
Functional Nanofibers and Colloidal Gels: Key Elements to Enhance Functionality
by
Nancy Amanda Vogel
A dissertation submitted to the Graduate Faculty of North Carolina State University
in partial fulfillment of the requirements for the degree of
Doctor of Philoophy
Chemical and Biomolecular Engineering
Raleigh, North Carolina
2015
APPROVED BY:
_______________________________ ______________________________
Dr. Saad A. Khan Dr. Orlin Velev
BIOGRAPHY
Nancy Amanda Vogel was raised in Quilcene, Washington by Cheryl and Bob Burns. After
high school, she moved to Tennessee to be close to her grandparents and to attend Tennessee
Technical University (Cookeville, TN). During her undergraduate career she performed
research under Dr. Holly Stretz and Dr. Pedro Arce modifying polyacrylamide gels for
electrophoresis applications. Additionally, she participated in a NSF Undergraduate
Research Experience program under the supervision of Dr. Venkat Subramanian modeling
lithium ion batteries using Bayesian and Jacobian parameter estimations and as a process
engineer in a year-long CO-OP at Georgia Gulf Chemical Company. Nancy graduated in the
spring of 2010 with a Bachelor’s of Science in Chemical Engineering. The following fall she
entered the Ph.D. program in the Department of Chemical and Biomolecular Engineering at
TABLE OF CONTENTS
LIST OF TABLES ... vi
LIST OF FIGURES ... vii
Chapter 1 Background and Organization ... 1
1.1 Introduction ... 2
1.2 Background ... 2
1.2.1Nanofibers ... 2
1.2.2Chitosan ... 5
1.2.3Cyclodextrin (CD) ... 7
1.2.4Atomic Layer Deposition (ALD) ... 9
1.2.5 Nanodiamonds ... 10
1.2.6Rheological Measurements of Colloidal Systems ... 12
1.3 Organization of Dissertation ... 16
Chapter 2 Cyclodextrin facilitated electrospun chitosan nanofibers ... 18
2.1 Abstract ... 19
2.2 Introduction ... 19
2.3 Materials and Methods ... 22
2.3.1 Materials ... 22
2.3.2 Solution Characterization ... 22
2.3.3 Electrospinning ... 23
2.3.4 Fiber characterization ... 24
2.4 Results and Discussion ... 24
2.4.1Chitosan/Cyclodextrin Electrospinning ... 24
2.4.2Chitosan/Cyclodextrin Interactions ... 28
2.5 Conclusions ... 36
Chapter 3 Delayed Dissolution and Small Molecule Release from Atomic Layer Deposition Coated Electrospun Nanofibers ... 37
3.1 Abstract ... 38
3.2 Introduction ... 38
3.3 Materials and Methods ... 42
3.3.1 Materials ... 42
3.3.2 Electrospinning ... 42
3.3.3 Atomic layer deposition ... 43
3.3.4 Fiber Morphology ... 43
3.3.5 Spectroscopy ... 43
3.3.6 Differential scanning calorimetry ... 44
3.3.8 Mat Dissolution ... 44
3.4 Results and Discussion ... 45
3.5 Conclusions ... 57
Chapter 4 Nanodiamond Gels in Nonpolar Media: Colloidal and Rheological Properties ... 58
4.1 Abstract ... 59
4.2 Introduction ... 60
4.3 Materials and Methods ... 62
4.3.1 Materials ... 62
4.3.4 Dynamic Light Scattering (DLS) ... 64
4.3.5 Nanodiamond Functionalization ... 64
4.4 Results and Discussion ... 65
4.4.1 Nanodiamond Gel Rheology ... 65
4.4.2 Microstructure Rearrangement ... 70
4.4.3 Nanodiamond Interactions ... 75
4.5 Conclusions ... 80
Chapter 5 Nanodiamond Gels in Polar Media: Colloidal and Rheological Properties ... 82
5.1 Abstract ... 83
5.2 Introduction ... 83
5.3 Materials and Methods ... 86
5.3.1 Materials ... 86
5.3.2 Solution Preparation ... 86
4.3.3 Rheology ... 86
5.4 Results and Discussion ... 87
5.4.1 Nanodiamond Gel Rheology ... 87
5.4.2 Gel Breakdown and Recovery... 96
5.5 Conclusions ... 105
Chapter 6 Conclusions and Future Recommendations ... 106
6.1 Conclusions ... 107
6.1.1 Chitosan Nanofibers via Cyclodextrin Addition ... 107
6.1.2 Nanofibers with Modified Dissolution and Small Molecule Release ... 108
6.1.3 Nanodiamond Colloidal Gels ... 109
6.2 Future Recommendations ... 110
6.2.1 Cyclodextrin Addition in Nanofibers ... 111
6.2.2 Nanofibers Coatings ... 112
6.2.3 Nanodiamonds ... 113
REFERENCES ... 115
APPENDICES ... 125
Appendix A Supplementary Information for Chapter 2 ... 126
A.1 Mechanical Testing ... 127
A.2 Mat Dissolution ... 127
A.3 Mat Porosity ... 128
A.4 Solution Conductivity ... 129
A.5 Solution Surface Tension ... 130
A.6 Urea Addition ... 131
A.7 Appendix A References ... 132
Appendix B Supplementary Information for Chapter 3 ... 133
B.1 Prolonged Drug Release Profiles ... 134
B.2 Drug Release Profiles in Different Buffers ... 134
Appendix C Supplementary Information for Chapter 4 ... 136
C.1 Nanodiamond Images via Confocal Microscopy ... 137
C.2 Functionalized Nanodiamond in Glycerol... 138
D.1 Time Dependent Behavior of Nanodiamond/Glycerol Gels ... 140
D.2 Nanodiamonds Gels: Mineral Oil Versus Glycerol ... 140
D.3 Dilute Nanodiamonds Dispersions ... 142
D.4 Material Properties ... 143
D.5 Appendix D References ... 143
Appendix E Improved cell infiltration of highly porous 3D nanofibrous scaffolds formed by combined fiber-fiber charge repulsions and ultra-sonication ... 144
E.1 Abstract ... 145
E.2 Introduction ... 145
E.3 Materials and Methods ... 148
E.3.1 Materials ... 148
E.3.2 Electrospinning ... 148
E.3.3 Post Processing ... 149
E.3.4 In vitro cell cultures ... 150
E.3.5 Statistics ... 151
E.4 Results and Discussion ... 151
E.5 Conclusions ... 159
LIST OF TABLES
APPENDIX A
Table A.1 Mat dissolution times of 2 wt. % chitosan/TFA mats with increasing HPCD content. ...128
Table A.2 Solution surface tension of 1 vol. % acetic acid solutions with increasing chitosan (LCS) and HPCD contents. ...131
APPENDIX D
LIST OF FIGURES
CHAPTER 1
Figure 1.1 The basic electrospinning schematic consisting of a high-voltage supply, a solution filled syringe, and a grounded collector plate. A Taylor cone forms once the supplied electrical force overcomes the surface tension of the solution. The solution then jets from the syringe tip to the collector, forming a nonwoven fiber mat. ... 3
Figure 1.2 (a) Chemical structure of chitosan has both deacetylation groups (n) and acetyl groups (m) which vary depending on the samples degree of deacetylation (a). Chitosan protonates at low pH, becoming cationic in nature (b).18 ... 5
Figure 1.3 (a) The chemical structure and a schematic of hydroxylpropyl beta-cyclodextrin’s truncated cyclic shape. (b) a schematic of a guest molecule being included or complexed within cyclodextrin’s cavity. ... 7
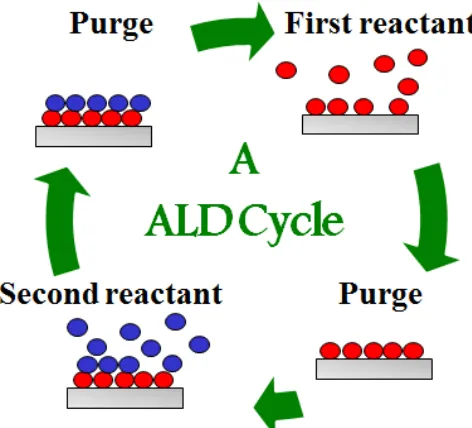
Figure 1.4 A schematic of one atomic layer deposition cycle with two reactant steps (red and blue) and two purge steps. ... 9
Figure 1.5 Nanodiamond powder, a TEM micrograph of nanodiamonds, and a schematic of a 5 nm nanodiamond, with a sp3 diamond core and a ready functional surface. [adapted from NanoBlox, DelRay Beach, FL and Mochalin, 2012] ... 10
Figure 1.6 A schematic describing an oscillatory experiment where a strain (γ, green) is
applied to a sample (red) and results in a stress response (τ, blue). Elastic modulus, viscous
modulus, time, frequency, and strain amplitude are represented by G’, G”, t, ω, and γ0, respectively. ... 12
CHAPTER 2
Figure 2.1 Fiber morphology of 2 wt.% chitosan in 90 vol.% AA (a-d) and neat TFA (e-h) electrospun mats improves with increasing HPCD content, from (a,e) 0 wt.% HPCD, (b,e) 10 wt.% HPCD, (c,g) 20 wt.% HPCD, and (d,h) 30 wt.% HPCD. ... 25
Figure 2.2 Three-dimensional (3D) electrospun mats of 4 wt.% chitosan/20 wt.% HPCD/TFA: (a) electrospinning process, (b-c) scanning electron micrographs of a mat section, and mat thickness after electrospinning for (d) 1, (e) 10, and (f) 30 minutes. ... 27
Figure 2.3 Fiber morphology of 3 wt.% chitosan electrospun mats in 1 vol.% AA improves with increasing HPCD content: (a) 0 wt.% HPCD, (b) 30 wt.% HPCD, (c) 40 wt.% HPCD, and (d) 50 wt.% HPCD. ... 27
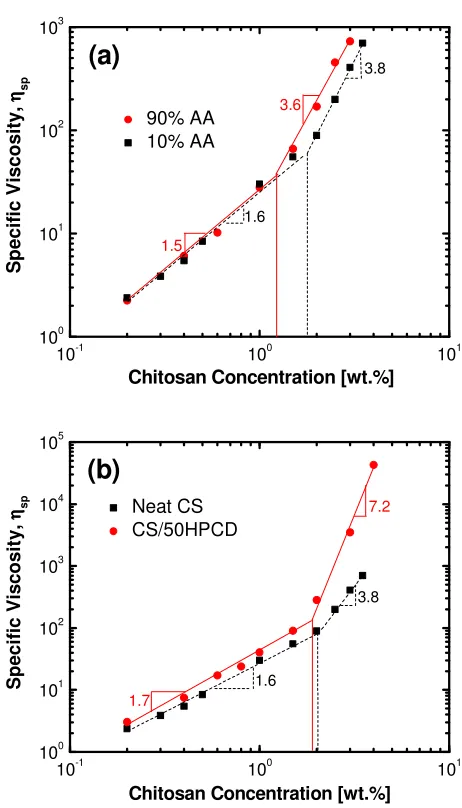
concentrations, indicated with vertical lines, are effected by solvent choice, while the slopes are increased by HPCD addition. ... 30
Figure 2.5 NMR spectra of 20 wt.% HPCD, 2 wt.% chitosan, and 2/20 wt.%
(chitosan/HPCD) blend solutions in 90 vol.% AA and 10 vol.% D20. The amine carbons and
hydrogens are indicated with an asterisk and x, respectively, and shift when blended with
HPCD. (a) 13C NMR spectra from top to bottom, HPCD, chitosan, and blend, (b) 1H NMR
spectra from top to bottom, HPCD, chitosan and blend, (c) expanded 2D HSQC (1H-13C)
NMR spectra contour plot of the blend and chitosan (top = 1H NMR of the blend, bottom =
1H NMR of chitosan,
left = 13C NMR of the blend, right = 13C NMR of chitosan.) ... 33
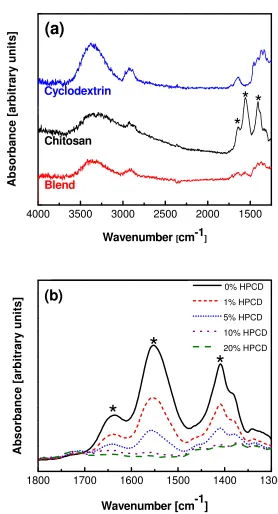
Figure 2.6 FTIR spectra in the attenuated reflectance mode of (a) 3 wt.% chitosan, 30 wt.% HPCD, and blended chitosan/HPCD (3/30 wt.%) electrospun mats and (b) films of 2 wt.% chitosan with 0, 1, 5, 10, and 20 wt.% HPCD. Significant chitosan peaks are marked with asterisks and disappear when blended with HPCD... 35
CHAPTER 3
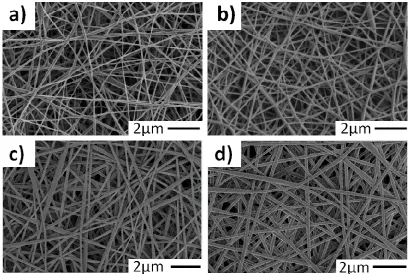
Figure 3.1. SEM micrographs of 7 wt. % PVA electrospun mats coated with (a) 0 cycles, (b) 2 cycles, (c) 20 cycles, and (d) 200 cycles of Al2O3 ALD chemistry. ... 45
Figure 3.2 The (a) carbon, (b) oxygen, and (c) aluminum XPS spectra of 7 wt. % PVA electrospun mats before and after treatment with 2, 20, or 200 ALD cycles of deposited Al2O3. ... 47
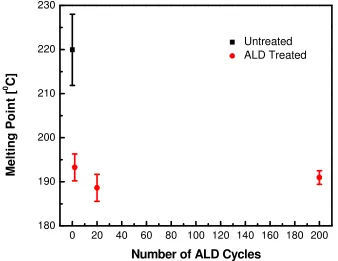
Figure 3.3 The melting points of 7 wt. % PVA electrospun mats as a function of Al2O3 ALD cycles... 48
Figure 3.4 Infrared spectrum of 7 wt. % PVA electrospun mats untreated and treated with 2, 20, or 200 cycles ALD. ... 49
Figure 3.5 Scanning electron micrographs of the PVA mat (a) without ALD treatment or high humidity exposure, and after storage in an 80 % relative humidity environment for approximatly (b) 1 week and (c) 2 weeks. Micrographs of the electrospun mats treated with (d) 2 cycles, (e) 20 cycles, and (e) 200 cycles of ALD and after storage in 80% relative humidity for 2 weeks. ... 50
Figure 3.6 Representative time lapse photos of electrospun mats that have been treated with 20 cycles ALD, followed by soaking in water for extended periods. ... 51
Figure 3. 7 Scanning electron micrographs of electrospun mats that have been treated with (a, b) 2 ALD cycles, (c, d) 20 ALD cycles, and (e, f) 200 ALD cycles and then soaked in water for extended periods. ... 52
for 1 day. ... 54
CHAPTER 4
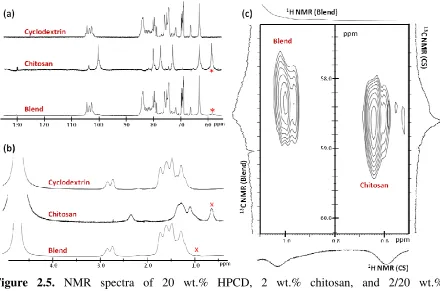
Figure 4. 1 TEM micrograph and schematic of nanodiamonds [adapted from NanoBlox, DelRay Beach, FL]. ... 61
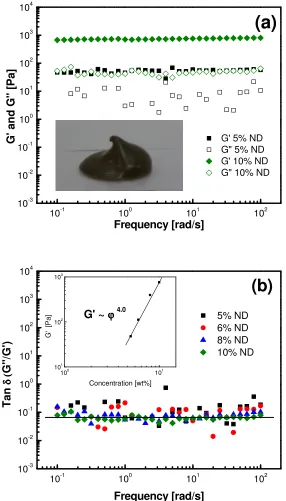
Figure 4. 2 Nanodiamonds in mineral oil. (a) Elastic (G’, solid symbols) and viscous (G”, open symbols) moduli of 5 and 10 wt. % nanodiamonds are shown as a function of frequency with an embedded image of 10 wt. % nanodiamonds supporting their own weight; and (b) tan
δ (G”/G’) as a function of frequency for multiple concentrations of nanodiamonds. The inset
shows a power-law dependence of G’ with filler volume fraction. ... 66
Figure 4. 3 Dynamic rheology data of nanodiamonds at various concentrations in mineral oil (a) with the elastic (G’, solid symbols) and viscous (G”, open symbols) plotted as a function of strain and (b) the elastic stress (G’ γ) plotted as a function of strain percent (γ%). The maxima correspond to the yield point. The yield stress (black squares) and strain (blue triangles) obtained from the maxima are shown as a function of nanodiamond concentrations as an inset. ... 68
Figure 4.4 Dynamic rheology of 8 wt. % nanodiamonds in mineral oil (G’represented via solid symbols and G” via open symbols) after exposure to different steady state strains of 500 by varying shear rate and time. Inset shows the power law dependence of the elastic moduli as a function of shear rate. ... 71
Figure 4.5 The structural break down and recovery of 10 wt. % nanodiamond in mineral oil (a) at dynamic strains from 0.5 -1000% at 1 rad/s as a function of time and (b) at different concentrations to show the power-law dependence of G’ after different strains have been applied. ... 72
Figure 4.6 Schematic representation of the floc microstructure in the nanodiamond/mineral oil system during and after oscillatory shear. The red lines in the top intermediate schematic imply a breakdown of intra-floc linkages. ... 75
Figure 4.7 Schematic representation of the nanodiamond structural changes after oxidation, reduction and 3-MPTS functionalization. ... 77
Figure 4.8 FTIR spectra of (a) nanodiamonds (solid), oxidized ND (dash), reduced ND (dot), and functionalized (dot/dash) nanodiamonds, and (b) zoomed in FTIR spectra to show C=C and carbonyl peaks. ... 78
CHAPTER 5
Figure 5.1 Dynamic rheology data of nanodiamonds dispersed in glycerol. (a) The elastic (G’, solid symbols) and viscous (G”, open symbols) moduli plotted as a function of frequency for both solution-like (4 wt. %) and gel-like (14 wt. %) dispersions. (b) The complex viscosity plotted as a function of nanodiamond content (2-14 wt. %). ... 88
Figure 5.2 Evolution of G’ (solid symbols) and G” (open symbols) as a function of time at 1 rad/s for (a) 6 and (b) 14 wt.% nanodiamonds dispersed in glycerol. Inserts show the G’ and G” as a function of frequency for both systems before and after 5 hours of growth. ... 90
Figure 5.3 (a) The normalized elastic modulus (G’/G’ ( t = 5 hrs )) and the tan δ (G”/G’) as
a function of time for various nanodiamond concentrations. (b) G’ at different times plotted as a function of nanodiamond content, where the slopes equal the scaling behavior exponent (n). ... 91
Figure 5. 4 Nanodiamonds (12 wt. %) dispersed in glycerol with (black squares) and
without (red circles) calcium chloride (0.1 wt. %) addition. The (a) elastic (G’, solid symbols) and viscous moduli (G”, open symbol), and the (b) normalized elastic moduli (G’/G’(t = 5hr)) plotted as a function of time. Insert shows the frequency response with and without calcium addition after 5 hr of growth. ... 93
Figure 5. 5 The elastic (G’, solid symbols) and viscous(G”, open symbols) moduli plotted as a function of time for 12 wt. % nanodiamonds dispersed in (a) glycerol (black squares) and 1:1 (w/w) glycerol:diglycerol (red circles), and (b) diglycerol (green diamonds). Inserts shows the tan δ (G”/G’) as a function of time . ... 95
Figure 5.6 Dynamic rheology data of nanodiamonds (8 – 14 wt. %) dispersed in glycerol (a) with the elastic (G’, solid symbols) and viscous (G”, open symbols) and (b) the elastic stress (G’ γ) plotted as a function of strain percent. ... 98
Figure 5.7 Dynamic rheology data of 12 wt. % nanodiamonds in glycerol (G’ solid symbols,
G” open symbols) exposured to repeat breakdown ( γ = 1000%) and recovery ( γ = 0.5%)
steps... 99
Figure 5.8 The recovery of 12 wt. % nanodiamonds dispersed in glycerol after breakdown (a) for 10-120 min, (b) at 1,000 – 10,000 strain %, and (c) varying shear rates. ...102
APPENDIX A
Figure A.1. Tensile stress (a) and strain (b) measurements of 2 wt.% chitosan in TFA with increasing HPCD content. ...127
Figure A.3. SEM micrographs of 2 wt. % chitosan blended with 20 wt. % HPCD in TFA with (a) 1:10 and (b) 1:100 mole ratio of chitosan to urea. Asterisks indicate data that is statistically different (p < 0.1) from all other conditions, except for other asterisks. ...129
Figure A.4. Solution conductivity of 2 wt. % chitosan solutions in 1 vol. % acetic acid with increasing HPCD content. ...130
Figure A.5. SEM micrographs of 2 wt. % chitosan in TFA with different mole ratios of chitosan to urea. Top: neat chitosan with (a) 1:10 and (b) 1:100 mole ratios. Bottom: blended with 20 wt. % HPCD with (c) 1:10 and (d) 1:100 mole ratios. ...132
APPENDIX B
Figure B.1. Release profiles of ketoprofen from untreated and ALD treated PVA nanofibers over an extended period of time...134
Figure B.2. Release of ketoprofen from untreated and ALD treated PVA nanofibers in 0.1M aqueous sodium hydroxide (pH = 13.0). ...135
APPENDIX C
Figure C.1 An confocal image of 0.01 wt. % NanoBlox nanodiamonds dispersed in mineral oil. ...137
Figure C.2 Dynamic rheology data of functionalized (red circles) and raw (black squares) NanoBlox nanodiamonds (10 wt. %) dispersed in glycerol as a function of frequency. ...138
APPENDIX D
Figure D.1 Various nanodiamond concentrations (8-14 wt. %) in glycerol with the elastic (G’, solid symbols) and viscous (G”, open symbols) moduli increasing with time. ...140
Figure D.2 The frequency response of 10 wt. % nanodiamonds dispersed in glycerol (black squares) and mineral oil (red circles). ...141
Figure D.3 TEM micrographs of dilute dispersion of nanodiamonds (0.019 wt. %) dispersed in 1:1 glycerol and DMSO (w/w). ...142
APPENDIX E
Figure E.1 Photographs and SEM photomicrographs of the top surface of electrospun (a-b) alginate/PEO/Pluronic F127 blended nanofibers, (c-d) alginate only nanofibers following PEO-Pluronic F127 extraction, and (e-f) ultra-sonicated alginate-only nanofibers fabricated at 20% and 50% humidity conditions. ...153
50% humidity conditions. ...153
Figure E.3 The average (a) mat thickness and (b) fiber diameter of alginate-PEO-Pluronic F127 blended nanofibers, alginate-only nanofibers following PEO-Pluronic F127 extraction, and ultra-sonicated alginate-only nanofibers fabricated at 20% and 50% humidity conditions. * indicates statistically different (p < 0.05) from all other conditions. ** indicates statistically different (p < 0.05) from all other conditions, except for other **. ...154
Figure E.4 SEM photomicrographs of HDF seeded (a-b) alginate-only nanofibers following PEO-Pluronic F127 extraction and (c-d) ultra-sonicated alginate-only nanofibers fabricated at 20% and 50% humidity conditions after two weeks of culture. Arrows indicate what are likely some of the cells on these materials...155
Chapter 1
___________________________________________________________________________
___________________________________________________________________________
1.1 Introduction
Nanomaterials have unique physical and chemical characteristics that are attractive for a
wide range of potential applications from energy storage and pollution sensors to agricultural
and biomedical products that can enhance cellular growth while protecting from harmful
toxins. These potential applications, coupled with advances in nanotechnology, have led to
increased interest in nanostructure research. The work presented in this dissertation focuses
on two such nanostructures, electrospun nanofibers and nanodiamonds particles, with the
overarching goal of tailoring the material behavior for a desired product. In the case of
electrospun nanofibers, this was achieved by either solution modification before fiber
formation or by post processing coating techniques. In the case of the nanodiamond
particles, a fundamental understanding of the colloidal system was explored so that a desired
microstructure can be achieved via functionalization or external stress. Further goal details
are provided in subsequent sections as they pertain to each individual chapter.
1.2 Background
This section provides the reader with a brief understanding of the key elements that are
pertinent to the dissertation chapters. However, the subsequant chapters are self-contained
and can be read independently.
1.2.1 Nanofibers
Nanofibers are a continuous nanomaterial with a fiber diameter that is significantly smaller
that a human hair, typically around 10 to 500 nm.1,2 These materials have both an especially
make them attractive for use in a wide range of applications such as tissue engineering, drug
delivery, sensing, and filtration.1–5 This interest has led to the development of multiple
nanofiber formation techniques. The method used in this work is known as electrospinning.
Figure 1.1 The basic electrospinning schematic consisting of a high-voltage supply, a solution filled syringe, and a grounded collector plate. A Taylor cone forms once the supplied electrical force overcomes the surface tension of the solution. The solution then jets from the syringe tip to the collector, forming a nonwoven fiber mat.
Electrospinning is a simple, yet a versatile method to produce nanofibers on either a
laboratory or commercial scale. In a typical laboratory electrospinning process (Figure 1.1),
a polymer filled syringe is attached to a syringe pump and a power supply. The pump
controls the flow rate of the solution through the needle tip (0.3–1 mL/hr), where an
electrical charge is applied (1-30 kV). The solution droplet deforms into a conical shape,
known as a Taylor cone, as the charges on the surface and overcome the surface tension.1,6,7
The polymer jet is then whipped into the air which reduces the jet’s diameter and assists in
solvent evaporation until it is deposits onto a grounded collector plate.
flow rate, flight distance, applied electrical field, and humidity) and intrinsic solution
properties (e.g. viscosity, conductivity, surface tension, and solvent volatility).1,6,7 For
instance, low viscosity or dilute solutions tend to electrospray (bead or droplet formation)
instead of electrospin (uniform nanofiber formation) as poor polymer entanglement leads to
jet disruption during flight. Additionally, electrospinning with a limited flight distance
results in either larger fiber diameters, flat fibers, or even a wet film if the jet stretching and
solvent evaporating is insufficient. Furthermore, since all of the electrospinning parameters
are interrelated, adjusting one might disrupt uniform nanofiber formation.8–11 For example,
increasing the flow rate on the syringe pump to increase the nanofiber yield will also increase
the electrical charge required to form a Taylor cone. Consequently, there is a limited range
of electrospinning parameters that will produce a uniform nanofiber mat and thus parameter
optimization is essential to producing a desired mat.
Some polymer systems will result in poor nanofiber quality or might not electrospin
at all. Biopolymers, such as chitosan, sodium alginate, and guar gum, are generally
problematic to electrospin; however, they are extremely attractive to biomedical and textiles
fields as they are renewable and possess a wide range of desirable properties.5,12,13
Consequentially, facilitating biopolymer nanofiber formation is the focus of Chapter 2. More
precisely, Chapter 2 explores the impact a functional small molecule has on chitosan
electrospinning.
In addition to the electrospinning operational and solution parameters, the final mat
morphology and performance can also depend on post-processing. Post-processing
include any process executed after the nanofiber is formed (e.g. chemical crosslinking,
surface functionalization, oxidation, heating, dissolving, etching, sonication, etc.).13–17
Chapter 3 examines the use of atomic layer deposition as a post-processing treatment to
modulate both mat dissolution and small molecule release.
1.2.2 Chitosan
Soluble
Insoluble
a)
b)
Figure 1.2 (a) Chemical structure of chitosan has both deacetylation groups (n) and acetyl groups (m) which vary depending on the samples degree of deacetylation (a). Chitosan
protonates at low pH, becoming cationic in nature (b).18
Chitosan is a widely available, highly versatile, non-toxic biopolymer that is derived from
chitin, a waste product found in the exoskeletons of crustaceans.18–20 Its use in multiple
industries (e.g. medicine, agriculture, food, paper industry, and cosmetics) and various
physical forms (e.g. powders, hydrogels, coatings, and nanofibers) are due to its uniquely
useful material properties.5,12,18,20–23 For example, food packaging products might use
chitosan films to fight against bacterial or fungal contaminates.21 Waste or water purification
systems can use chitosan particles to chelate metals.24 Chitosan is also well known in the
formation, regenerate connective gum tissue, and absorb through mucus membranes.25–28 It is
also known to be a hemostatic, antimicrobial, spermicidal, antitumor, and fungistatic agent. 21
The structure of this cationic polysaccharide consists of randomly distributed β
-(1-4)-linked D-glucosamine (deacetylated) and N-acetyl-D-glucosamine (acetylated) units, as seen
in Figure 1.2a.18 When the solution pH is below the pKa, the deacetylated amine groups
become protonated (Figure 1.2b). This unique cationic nature is responsible for the long list
of chitosan properties.18,19,24 The extent that chitosan is deacetylated (deacetylation degree,
DD%), and thus its cationic nature, depends strongly on the chitin source and the method of
processing.
The evident advantages to using chitosan have motivated several groups to
electrospin chitosan nanofiber systems. There are a few issues commonly encountered when
electrospinning chitosan, such as batch-to-batch variation, limited solubility in common
solvents, rigid structure due to hydrogen bonding, high crystallinity, and high viscosity at low
polymer concentrations.5,12 Due to these issues, chitosan nanofibers have only been
electrospun using corrosive solvent systems of anhydrous trifluoroacetic acid and
concentrated acetic acid.29,30 More often chitosan is blended with a carrier polymer to
promote nanofiber formation. In this regard, chitosan blended with polyethylene oxide,
polyvinyl alcohol, polyethylene terephthalate, polyethylene glycol, gelatin, or collagen has
been electrospun to obtain nanofibrous mats.5,31–34 In Chapter 2, we have taken a different
approach involving the addition of cyclodextrin, a small molecule, to chitosan solutions in
1.2.3 Cyclodextrin (CD)
a)
b)
Figure 1.3 (a) The chemical structure and a schematic of hydroxylpropyl beta-cyclodextrin’s truncated cyclic shape. (b) a schematic of a guest molecule being included or complexed within cyclodextrin’s cavity.
Cyclodextrin is typically a hollow truncated oligosaccharide, composed of a varying number
of 5 or more α-D-glucopyranoside units.35 The number of these repeat units dictates the type
of cyclodextrin (e.g. alpha, beta, and gamma for 6, 7, and 8 units, respectively), as well as the
material properties (e.g. solubility, cavity size, and crystallinity).36 The typical truncated
cone structure is due to the repeat glucopyranose unit configuration (Figure 1.3a); with the
primary hydroxyl groups situated on the smaller edge, the secondary hydroxyl groups on the
larger edge, and the remaining hydrogen atoms and the oxygen bridges lining the cavity37,38.
This configuration results in a hydrophilic exterior and an electron rich interior with
hydrophobic and Lewis base characteristics and gives cyclodextrin the ability to form
inclusion complexes with guest molecules (Figure 1.3b).36 This ability to fully or partially
academic settings for a variety of applications including to stabilize volatile or unstable
compounds, eliminate unwanted tastes and contaminates, increase separation, and aid in drug
stabilization and solubility.39–41
An advantage of using cyclodextrin over other inclusion molecules is the availability
of multiple native and modified derivatives (>1500) each with different material properties.36
This wide range of diversity allows for a unique opportunity to select an inclusion molecule
with a desired functionality. For example, modified gamma cyclodextrin is known to reverse
neuromuscular blockade through drug binding in Merck’s Sugammadex ®, alpha
cyclodextrin is marketed to bind to fat and increase weight loss, and hydroxypropyl beta
cyclodextrin is used as a deodorizer in Procter and Gamble's Febreze ® to trap organics.
Cyclodextrin’s cavity is not only ideal for hosting guests, but can also be used to
reorganize polymer structures, morphologies, and even conformations.42,43 Our goal is to use
this hosting ability of cyclodextrin to coalesce or interact with various polymer chains to
facilitate chitosan fiber formation. Incorporation of cyclodextrin into an electrospun
nanofiber mat has been achieved;44–47 however, cyclodextrin incorporation to introduce
complexation properties that aid chitosan electrospinning and its effect on fiber formation has
yet to be explored. Therefore, Chapter 2 focuses on realizing the full potential of chitosan
electrospinning by understanding the mechanism that enables fiber formation through
cyclodextrin complexation as a function of solution properties, solvent types, and
1.2.4 Atomic Layer Deposition (ALD)
Figure 1.4 A schematic of one atomic layer deposition cycle with two reactant steps (red and blue) and two purge steps.
Atomic layer deposition is a thin film deposition technique that uses vapor-phase chemistry
to modify material surfaces with precursors (typically metal oxides).48 The ALD process was
originally developed for flat panel displays, but has since become recognized as an effective
method for the surface modification of high surface area and highly porous materials due to
the diffusive, self-limiting nature of the chemistry that allows for fine (<1 nm) control of
coating thickness. Each ALD “recipe” varies based on the desired results, but is composed
of alternating binary reactions to grow new materials in a layer-by-layer manner, as seen in
Figure 1.4. The first reactant covalently binds to all sites available on the surface of the
substrate, but cannot proceed beyond monotypic coverage as the reactant cannot react with
itself. The remaining reactant is then removed from the system with a purge step, typically
spontaneously to generate a new surface that is highly reactive to the first reactant. The
second reactant is then removed with a purge step, thus completing one ALD cycle. A
typical reaction scheme features the cycled addition of an organometallic precursor such as
trimethyl aluminum and an oxidant, typically water, to grow a monolayer of aluminum oxide
(Al2O3) per reaction cycle directly onto the substrate’s surface. The diffusive nature of this
vapor phase chemistry enables uniform, conformal growth of thin films on high surface area
substrates, including electrospun nanofibers.
To date, the use of ALD on nanofibers has focused on fabrication of hollow
nano-structures, such as nanotubes, which are synthesized using polymer nanofibers as
templates.17,49–51 But ALD has also been used to alter physical properties of nanofibers
including mat strength, chemical resistance, and photocatalytic activity.14,52,53 The goal of
Chapter 3 is to exploit this knowledge and demonstrate that ALD treatment can also be
utilized to modify the dissolution properties of nanofiber mats without significantly altering
the bulk polymer chemistry and can be used to modulate small molecule release.
1.2.5 Nanodiamonds
Nanodiamonds are sp3-hybridized nanoscale, carbon-based particles that were first
synthesized in the early 1960’s by a group of Soviet scientists (Figure 1.5). Their existence
remained relatively unknown until the 1990’s, when they became public knowledge. Since
then, nanodiamond research efforts have included everything from synthesis,
functionalization, and disaggregation methods to material integration and potential
biomedical and imaging applications.54–57
Nanodiamonds are synthesized either via a shock-wave transformation of graphite or
the detonation of TNT and hexogen in a negative oxygen balance.58,59 They retain all the
desirable properties of a bulk diamond (e.g. strength, hardness, thermal conductivity,
electrical resistivity, optical transparency, biocompatibility, etc.) but are on the nanoscale.54
In addition, the particle surface is covered with multiple functional groups (e.g. carboxylic
acids, esters, ethers, lactones, etc.) that offer an unique opportunity to tailor the surface
properties without interfering with the bulk diamond properties.58 This surface functionality,
together with their nanoscale size and material properties, make them attractive for a wide
range of applications.59,60 For example, they are considered to be a non-toxic alternative to
quantum dots for use in biomedical imaging and florescence microscopy because of their
high refractive indices and multicolor centers.61 Research by Thalhammer et al. highlights
the use of nanodiamonds in regenerative medicine as they have been found to promote
neuronal growth similar to protein-coated materials.62 Nanodiamonds have also been
considered by Kotov for the transport of genetic materials across cellular membranes, such as
the blood–brain barrier, because they can be used to potentially mimic globular proteins.63 In
hardness, and wear resistance by two to four times using only a 1% loading of particles.54,59
As nanodiamonds are a relatively “new” material, there are still several areas and
questions that have yet to be addressed. For example, even though nanodiamonds have been
explored as an additive to composites and lubricants, there is little to no rheological
information available. This lack of information and their tendency to aggregate is the focus
of the work presented in Chapters 4 and 5. In these chapters we use rheology to gain a better
understanding of nanodiamond interactions and microstructure in either a polar or non-polar
model system.
1.2.6 Rheological Measurements of Colloidal Systems
Sample
Applied Strain
Measured Stress Response
Figure 1.6 A schematic describing an oscillatory experiment where a strain (γ, green) is
applied to a sample (red) and results in a stress response (τ, blue). Elastic modulus, viscous
modulus, time, frequency, and strain amplitude are represented by G’, G”, t, ω, and γ0, respectively.
Developing new materials for a desired application requires a certain understanding of their
component interactions and microstructure. Rheological techniques that study how materials
behave under external stress are often employed to gain such knowledge. For example,
return it to the original non-deformed shape once the external stress is terminated (i.e., it has
a memory). However, a purely viscous fluid (e.g. water, honey, etc.) will flow when exposed
to an external stress and remained in the new deformed shape after the stress is terminated
(i.e., it has no memory). These solid-like or viscous-like features can be examined using
oscillatory experiments which can impose a small amplitude oscillatory strain (γ, described
below), at a set frequency of oscillation (ω) and strain amplitude (γ0) as to not disrupt the
microstructure (Figure 1.6).64
The rheometer measures the resulting sinusoidal stress (τ, described below), which can be
expressed in terms of in-phase and out-of-phase components.
The elastic or storage modulus (G’) is the stress that is in-phase with the applied strain, while
the viscous or loss modulus (G”) is the stress that is out-of-phase.
Polymer solutions and colloidal dispersions, often referred to as viscoelastic
materials, exhibit both viscous and elastic behavior, and can be described using a
combination of both moduli and/or scaling relationships. For example, the ratio of viscous to
elastic moduli, known as tan delta (tan δ = G”/G’), can be used to determine a system’s gel
point and examine its gelation kinetics. Power-law relationships between the particle volume
fraction (φ) and elastic moduli (G’ ~ φn) can be used to determine if the system is composed
of aggregated particles (i.e. flocs), if they are interconnected, and how they formed (i.e.
(i.e., a flocculated network) will breakdown when exposed to stress (within or outside of
each floc) can be determined by examining the power-law nature of the yield stress as a
function of particle volume fraction.70,71 By pairing this rheological information with the
particle interactions described in colloidal science (i.e., van der Waals, hydrogen bonding,
electrostatic, etc.), we can also predict what systems will flocculate and why.72,73
The goals of Chapters 4 and 5 are to gain a fundamental understanding of how
concentrated nanodiamond colloidal gels behave in polar and non-polar media. Throughout
these chapters we will commonly employ three types of dynamic rheological experiments
and discuss possible colloidal interactions occurring within the system.
The first two experiment types are conducted using relatively low strain amplitude (γ
~0.5) as to not disrupt the system’s microstructure; this is known as working within the linear
viscoelastic regime. The first type of experiment, a frequency sweep, is conducted using a
range of frequencies (ω = 0.01 – 100 rad/s) at a set strain amplitude and can be used to
understand the state of the sample (solution or gel). The viscous moduli will dominate in a
solution (G”>G’) and be frequency dependent, but the elastic moduli will dominate in a gel
(G’>G”) and will be frequency independent. Similar moduli trends are often seen in the
second type of experiment, a time sweeps, where both frequency and strain are held constant;
however, time sweeps are used to examine how each moduli change relative to the other as a
function of time. The final type of experiment type commonly employed in Chapters 4 and 5
is a large amplitude oscillatory strain sweep. This type of experiment is conducted outside of
the linear viscoelastic regime as the goal is to examine how the microstructure behaves when
The resulting data can be used to determine the material’s yield stress, (i.e. the amount of
stress the material can with stand without deforming).
The basic colloidal interactions can be divided into two groups: attraction interactions
(e.g. van der Waals, hydrogen bonding, etc.) and repulsion interactions (e.g. electrostatic,
steric, etc.).64 The balance of these interactions is what determines the stability of a colloidal
system. Systems of suspended, discreet de-aggregated particles are referred to as stable,
whereas systems with aggregated particles are considered unstable. Unstable systems can
form a colloidal gel by a process known as flocculation, where the aggregates cluster
together into a three-dimensional network that spans the entire system. This flocculated
network is held together via physical bonds and can easily be restructured by external
stresses.
Typically, flocculation is induced by either by decreasing the repulsive forces or by
increasing the attraction interactions. In fact, the Derjaguin and Landau, Verwey and
Overbeek (DLVO) theory, relates the stability of colloidal dispersions to a linear relationship
between electrostatic and van der Waals interactions.75 The repulsive electrostatic
interactions arise due to ions or charges within a system and can be described using the
Poisson-Boltzmann equation.64 Colloidal systems typically contain ions through dissociation
of particle surface groups, the absorption of free ions or counterions, or the addition of
surfactants or polyelectrolytes. The presence of these charges can be altered several different
ways, including neutralizing surface charges via electrolyte addition and by chemically
altering the surface groups or shifting the media pH toward the zero charge point in order to
be altered by carefully selecting the media in which the particles are dispersed. This is
because the van der Waals forces between two similar spherical particles in a media without
a surface layer are given by:
where the parameters d, r, and Ap refer to the distance between particle surfaces, the particle
radius, and the particle Hamaker constant, respectively.73,75,76 The nonretarded media
Hamaker constant (Am) in a vacuum is a function of the media’s refractive index and
dielectric constant and is given by:
where the parameters k, T, h and ve refer to the Boltzmann constant, the absolute
temperature, Planck’s constant, and the main electronic absorption frequency for the
dielectric permittivity (taken to be 3x10¹⁵s-1).
Additional colloidal interactions beyond what the DLVO theory predicts and what
has been described above (e.g. hydrogen bonding, steric stabilization, depletion stabilization,
etc.) play a major role in determining the stability of a system and will be addressed as they
are relevant.
1.3 Organization of Dissertation
This dissertation is arranged to address issues in nanofibers and nanodiamonds, with
In particular, Chapter 2 focuses on realizing the full potential of chitosan electrospinning by
understanding the mechanism that enables fiber formation through cyclodextrin
complexation as a function of solution properties, solvent types, and cyclodextrin content,
and its effect on fiber morphology. Chapter 3 addresses the use of atomic layer deposition as
a post treatment for electrospun poly (vinyl alcohol) nanofibers and relates the coating
thickness to improvements in humidity stability, mat dissolution, and the ability to modulate
small molecule release. Chapter 4 examines the rheological behavior of nanodiamond
colloidal gels in a model non-polar solvent as a function of composition and surface
functionality and examines the effect of external strain on microstructure rearrangement.
Chapter 5 explores the time dependency of colloidal nanodiamond gels in a model polar
solvent and includes discussions on the colloidal interactions and the microstructural
breakdown and recovery as a function of composition and strain. Chapter 6 summarizes the
Chapter 2
___________________________________________________________________________
___________________________________________________________________________
Cyclodextrin facilitated electrospun chitosan nanofibers
1
2.1 Abstract
The use of chitosan, a cationic biodegradable polysaccharide derived from sea-shells, in
nanofibrous form offers a powerful platform to exploit its inherent benefits. However,
chitosan nanofiber formation is difficult, requiring corrosive solvents or a carrier polymer
blend to successfully electrospin. Our approach entails blending chitosan with a functional
small molecule, cyclodextrin, to facilitate nanofiber formation of chitosan in acetic acid and
trifluoroacetic acid. In this case the cyclodextrin, with its complexation properties, could
serve to improve chitosan fiber formation, thus serving as a multi-functional blend. In this
study, we examine the role of each component and the possibility of synergistic effects in
nanofiber formation. Significant improvements in chitosan fiber formation were observed in
concert with cyclodextrin at solvent concentrations not possible with just the individual
components. Multiple fiber morphologies including three-dimensional fiber mats were also
achieved. We examine the improved nanofiber formation in relation to solution viscosity,
polymer entanglement, and chitosan-cyclodextrin associations. Rheological studies provide
evidence of interactions between cyclodextrin and chitosan. NMR and FTIR studies further
validate complexation between these two components.
2.2 Introduction
The use of chitosan, a cationic biodegradable polysaccharide derived from sea-shells, in
nanofibrous form offers a powerful platform to exploit its inherent benefits.5 The structure of
chitosan, consisting of randomly distributed β-(1-4)-linked D-glucosamine (deacetylated) and
various properties.18 When the solution pH is below the pKa, the deacetylated amine groups
become protonated. This cationic nature enables chitosan to penetrate mucus layers in
biomedical applications, to act as an antimicrobial agent in food preservatives, and to trap
metals and dyes in waste water.18,19,24 These unique properties of chitosan, combined with
the high surface area and porosity of nanofibers have led to the study of several functional
systems. For example, Wang et al. fabricated formaldehyde sensors from polyethyleneimine
functionalized chitosan nanofibers.77 Alternatively, blended chitosan nanofibers have been
examined for water purification by absorbing nickel, cadmium, lead, and copper.34
While these nanofiber systems are versatile due to the presence of chitosan, they
require either a corrosive solvent or the addition of another polymer to aid in the
electrospinning process.5,12 The addition of another polymer, often called a carrier polymer,
is common in chitosan electrospinning literature because chitosan has proven extremely
challenging due to several different factors. First, chitosan does not dissolve in common
solvents and can only be dissolved at low concentrations in acidic solvents. Second, chitosan
is highly crystalline in nature with its rigid structure inhibiting chain entanglement and thus
fiber formation.12 Furthermore, when dissolved in acidic solvents, chitosan will be positively
charged due to its polyelectrolyte nature. It is believed that these repulsive charges, in
combination with the electrospinning electric field, interfere with uniform fiber formation
and instead results in the production of beads.5,12 Finally, chitosan is a batch material that is
derived from an assortment of natural materials including plant cell walls and anthropoid
exoskeletons. The combination of these materials and the different hydrolysis methods used
reproducibility of the electrospinning process. The difference in molecular weight and ratios
of deacetylated to acetylated groups, or the deacetylation degree (DD%), that exists between
different chitosan samples impacts chitosan solubility and polymer chain entanglement.18
Despite the previously stated challenges, neat chitosan nanofibers have been
successfully electrospun in aqueous acetic acid, trifluoroacetic acid (TFA), and
TFA/dichloromethane mixtures.29,30 However, blending chitosan with a carrier polymer is
the typical approach to promote nanofiber formation. And in this regard, chitosan blends
with polyethylene oxide, polyvinyl alcohol, polyethylene terephthalate, polyethylene glycol,
gelatin, or collagen have been electrospun to obtain nanofibrous mats.5,31–33 In this study, we
take a different approach and use cyclodextrin, a small molecule, to facilitate fiber formation
of chitosan.
Cyclodextrins are nontoxic, hollow, truncated oligosaccharides with hydrophilic
exteriors and hydrophobic interiors and are of interest due to their unusual hosting abilities.
Hosting, or complexation, within cyclodextrin is the non-covalent incorporation of a guest
into a protective electron rich cavity.78 Cyclodextrin’s cavity is not only ideal for hosting
guests, but can also be used to reorganize polymer structures, morphologies, and even
conformations.43 Our goal is to use this hosting ability of cyclodextrin to coalesce or interact
with various polymer chains to facilitate chitosan fiber formation. Incorporation of
cyclodextrin into an electrospun nanofiber mat has been achieved.44–47 However,
cyclodextrin incorporation to introduce complexation properties that aid chitosan
electrospinning and its effect on fiber formation has yet to be explored. Therefore, this work
mechanism that enables fiber formation through complexation as a function of solution
properties, solvent types, and cyclodextrin content, and its effect on fiber morphology.
2.3 Materials and Methods
2.3.1 Materials
Technical grade hydroxypropyl β-cyclodextrin (HPCD, 5.6 degree of substitution) was
purchased from CTD, Inc. (High Springs, FL) and used as received. Chitosan (CS, 75-85%
deacetylated), deuterated water, and trifluoroacetic acid (TFA) were purchased from Sigma
Aldrich and used as received. Glacial acetic acid (AA) and sodium chloride were purchased
from Acros and then diluted to the required volume percent with de-ionized water.
2.3.2 Solution Characterization
Solutions were prepared by adding the desired amounts (wt.%) of chitosan and HPCD to the
solvent (vol.%). Solutions were mixed overnight in a shaker bath at room temperature. To
prevent degradation, chitosan and all solutions were stored at 4°C and used within ten days
of initial preparation.
Surface tension measurements, using the Wilhelmy plate method, were done in
triplicate to ensure reproducibility. Various concentrations of chitosan and HPCD were
examined in different solvent systems to determine the effect of surface tension on fiber
formation. Conductivity was measured using a Mettler Toledo meter to determine the effect
of solution conductivity on fiber formation. Solution viscosity was measured using a TA
Instruments® AR-2000 stress controlled rheometer with a 4 cm, 2° cone and plate geometry
at low shear rates, and the solvent viscosity (ηs) were used to determine the specific viscosity.
Reproducibility of the measurements was within ±5% for three separate measurements.
Solution characteristics for the TFA solutions were not measured due to their corrosive
nature.
1H and 13C NMR spectra were recorded on 700 MHz Bruker Avance III spectrometer
operating at 30 °C and 700.17 MHz proton frequency equipped with cryoprobe and Topspin
2.1 software version (Bruker, Karlsruhe, Germany). The NMR probe was tuned to 13C
frequency, which is 176.05 MHz in the 700.17 MHz spectrometer. A capillary tube with
benzene was used as a 13C external standard (130.3 ppm). All spectra were collected with
90o1H and 13C standard pulses at a relaxation delay of 2 s and 128 scans. The NMR signal
was Fourier transformed without apodization and the phase and baseline were carefully
corrected. Assignments of 1H and 13C NMR signals to HPCD and chitosan were made using
prediction software ACD (Advance Chemistry Development, Toronto, Ontatrio, Canada) and
confirmed by 2D heteronuclear single quantum correlation (HSQC, 1H-13C) NMR
experiments.79 Samples were prepared for NMR spectroscopy by dissolving 2 or 20 wt.% of
chitosan or HPCD, respectively, in 90AA/10 D20 vol.% and transferred to a 5-mm NMR tube
for analysis. Tubes were carefully washed and dried for 24 hrs in an oven and bubbled with
nitrogen before being capped for storage.
2.3.3 Electrospinning
To electrospin, 1mL of solution was inserted into a 10 mL syringe and fit with a metal needle
(0.508 mm I.D.). The syringe was secured to a New Era precision syringe pump (model
solution had equilibrated to a flow rate of 0.3 mL/hr. The voltage was increased slowly (7-13
kV) until the drop of solution at the needle tip formed a Taylor cone and the sample
deposited onto the foil covered grounded collector plate.
2.3.4 Fiber characterization
Fiber morphology was examined via scanning electron microscopy (SEM). The samples
were coated with a thin layer of gold (approximately 10 nm) and then studied with a FEI
XL-30 SEM. Fiber diameters were determined by averaging the measurements of 100 fibers
using ImageJ software (NIH). Mat porosity was analyzed using SEM micrographs and
ImageJ binary processing. Mat porosity was determined to be the percent of void space area
to the total surface area.80 Data is expressed as mean ± standard deviation (n = 5) with the
statistical significance difference determined via one-way analysis of variance (p < 0.1).
Infrared spectra of electrospun fiber mats and films were measured with an attenuated total
reflectance Fourier transform (ATR-FTIR, Nicolet 6700) spectrophotometer equipped with a
Ge crystal and purged with dry air. Each spectrum was acquired with 256 scans with a
resolution of 4 cm-1 and a spectral range of 4000−600 cm-1.
2.4 Results and Discussion
2.4.1 Chitosan/Cyclodextrin Electrospinning
We begin by blending chitosan with HPCD to promote fiber formation.
Electrospinning improvements were observed by the formation of a well-defined Taylor
cone, the rapid appearance of fiber deposits on the collector plate, and the formation of a mat
enhancements in chitosan fiber morphology. As seen in Figure 2.1, characteristic
electrospinning morphology transitions from beads to beaded fibers and ultimately to
uniform fibers with increased HPCD content. Fiber morphology improvements are not
solely due to HPCD’s ability to electrospin, but are due to an interaction between chitosan
and HPCD. Interestingly, this interaction leads to uniform fiber formation from
off the collection plate (Figure 2.2) and are thus termed three-dimensional (3D) electrospun
mats. The mat thicknesses are time dependent, with the thickest region being the center of
the mat, causing a conical 3D mat shape to form. The resulting mats are self-supporting after
the electrical field is removed. The void space within the mat was found to increase with
chitosan content, but did not vary substantially with HPCD content (Figure S3), suggesting
that chitosan plays a role in the 3D phenomenon. Bonino et al. reported a similar finding
when electrospinning a charged biopolymer system of alginate and polyethylene oxide, and
attributed the 3D nature to a combined effect of repulsive charges in alginate and water
retention.81 Interestingly, the formation of our 3D mats seems to depend on high chitosan
content. This chitosan dependence supports the charge repulsion theory as increasing the
chitosan content increases the charge repulsion and mat porosity. It is possible that a
minimum amount of charge repulsion is required before a 3D mat architecture is achieved.
Further work is needed to fully probe the mechanism behind chitosan/cyclodextrin 3D mat
formation.
In addition to electrospinning at high chitosan concentrations, we are also able to
electrospin nanofibers from dilute aqueous acid solvents, such as 1 vol.% AA (Figure 2.3).
A neat 3 wt.% chitosan solution will not electrospin (Figure 2.3a) in dilute AA. However,
adding HPCD improves the electrospinnability and ultimately leads to nanofiber formation
(Figure 2.3d). Electrospinning in dilute acid solvents is significant because it diminishes
potential corrosive degradation of active ingredients and reduces the need for post-processing
Figure 2.2. Three-dimensional (3D) electrospun mats of 4 wt.% chitosan/20 wt.% HPCD/TFA: (a) electrospinning process, (b-c) scanning electron micrographs of a mat section, and mat thickness after electrospinning for (d) 1, (e) 10, and (f) 30 minutes.
2.4.2 Chitosan/Cyclodextrin Interactions
We examined the electrospinning solution properties to better understand why fiber
formation improves with HPCD addition. The addition of HPCD to chitosan solutions
reduced the solution conductivity with no appreciable change in surface tension (Figure S4
and Table S2). Reductions in the solution conductivity typically diminishes the ability to
electrospin; however, we observed an improvement in electrospinnability.1 We believe an
increase in solution viscosity may be compensating for the diminished conductivity effect
and investigated this further using rheology.
Solution rheology can identify the polymer entanglement concentration and predict
the concentrations required for uniform electrospun fibers.15,82 The polymer entanglement
concentration is determined by a slope transition when plotting the specific viscosity (ηsp =
(ηo-ηs)/ ηs) as a function of polymer concentration. The slopes from this plot, also known as
the scaling exponents, are typically ~ C1.5 and C3.8 for polyelectrolyte solutions.83 Shifts in
the scaling exponents can indicate changes on a molecular level, with an increase signifying
an escalation in polymer association or molecular interactions.82,84 We have used this
method to examine the impact that solvent concentrations and HPCD addition have on the
polymer entanglement concentration and interactions. The first step was to establish the
scaling exponents and polymer entanglement concentration of neat chitosan solution as a
function of solvent concentration (Figure 2.4a). The scaling exponents for neat chitosan in
concentrated and dilute AA are similar to each other and to the values reported in literature.83
This similarity suggests that AA concentration does not significantly change the molecular
concentration shifts the polymer entanglement concentration slightly, from 1.8 to 1.3 wt.%,
when AA concentration is increased from 10 to 90 vol.%. This shift indicates changes in
chitosan chain conformations, with more entanglement at higher AA concentrations.
Therefore electrospinning chitosan in concentrated AA leads to uniform nanofibers at lower
chitosan concentrations, consistent with what has been observed in the literature.29 Finally,
the impact of HPCD addition on the polymer entanglement concentration and the scaling
exponents were analyzed (Figure 2.4b). The addition of HPCD did not shift chitosan’s
entanglement concentration. However, HPCD addition did significantly increase the scaling
exponent after the polymer entanglement concentration from C3.8 to C7.2. This substantial
increase suggests that HPCD addition promotes chitosan polymer chain association. A
similar increase in scaling exponents (C4.5 to C8.0) has been seen when poly(alkyl
methacrylate) was modified with additional hydrogen bonding groups to improve
10-1 100 101 100 101 102 103 3.6 1.5 1.6
(a)
Chitosan Concentration [wt.%]
S p e c if ic V is c o s it y , ηηηηs p 90% AA 10% AA 3.8
10-1 100 101
100 101 102 103 104 105 1.6 3.8 7.2 S p e c if ic V is c o s it y , ηηηηs p Neat CS CS/50HPCD
Chitosan Concentration [wt.%]
1.7
(b)
Figure 2.4. (a) Solutions dynamics of neat chitosan solutions in 90 vol.% AA (circles) and 10 vol.% AA (squares). (b) Solution dynamics of chitosan solutions in 10 vol.% AA both neat (squares) and blended with 50 wt.% HPCD (circles). The polymer entanglement concentrations, indicated with vertical lines, are effected by solvent choice, while the slopes are increased by HPCD addition.
Improved chitosan interactions or association due to HPCD addition might be due to
solution rheology results, hydrogen bonding is not believed to play a significant role in fiber
formation. If hydrogen bonding was responsible for fiber formation then a reduction of the
polymer entanglement concentration would be evident because hydrogen bonding forms
extended networks between HPCD and a polymer, as seen in our previous work with HPCD
and a non-complexing polymer, poly(vinyl alcohol).45 However, there was no polymer
entanglement changes in the chitosan/HPCD system. In addition to solution rheology,
hydrogen bonding within a solution can be investigated by examining the effect of adding a
chaotropic agent to a solution, such as urea. If urea addition affects electrospinnability, then
it is possible to conclude that hydrogen bonding plays a significant role in fiber formation.44
However, we found that urea addition does not impact fiber formation (Figure S5), indicating
that hydrogen bonding is not the primary parameter in chitosan/HPCD electrospinning.
The presence of chitosan within HPCD solutions has been found to impede drug
complexation, suggesting that chitosan might be included within or shielding HPCD’s
cavity.85 Typical cyclodextrin-guest interactions can be confirmed by examining either the
glass transition temperature (Tg) or the crystalline nature.86 However using calorimetry and
crystallography to determine HPCD complexation of chitosan is problematic for two reasons.
First, the location of chitosan’s Tg is difficult to obtain and highly debated, with literature
suggesting that it degrades well before the Tg is reached.87,88 Second, while most
cyclodextrins are crystalline, HPCD is not. In fact, X-ray diffraction patterns of both
chitosan and HPCD have undefined, broad, diffused peaks that signify their amorphous
nature making reductions in the crystalline nature redundant.88,89 Therefore, NMR


![Figure 4. 1. TEM micrograph and schematic of nanodiamonds [adapted from NanoBlox, DelRay Beach, FL]](https://thumb-us.123doks.com/thumbv2/123dok_us/1472453.1180342/77.612.119.508.145.373/figure-micrograph-schematic-nanodiamonds-adapted-nanoblox-delray-beach.webp)