ISSN (Online) : 2319 - 8753
ISSN (Print) : 2347 - 6710
International Journal of Innovative Research in Science, Engineering and Technology
An ISO 3297: 2007 Certified Organization Volume 4, Special Issue 1, February 2015
THIRD NATIONAL CONFERENCE ON ADVANCES IN CHEMISTRY (NCAC – 2015) On 18th February 2015
Organized by
Department of Chemistry, Easwari Engineering College (SRM Group of Institutions), Chennai-600089, India.
Copyright to IJIRSET www.ijirset.com 159
Electrical Conductivity Studies on
Polyethylene Terephthalate (PET) Thin Films
R. Sivakumar
1, S. Nirmala
2Assistant Professor, Department of Physics, Easwari Engineering College, Ramapuram, Chennai, India 1,2
ABSTRACT:The present work was made to study the electrical conductivity of polyethylene terephthalate (PET) thin films. The thickness of the sample thin films of the order of 100-250 microns. The electrical conductivity values of PET thin films dependence on its physical and chemical properties. The main aim of this work is finding the Resistivity values of the PET thin films; from this we can calculate the electrical conductivity of the polymer material (inverse of Resistivity is conductivity). In this study the electrical conducting properties of polymer polyethylene terephthalate has been investigated by using a four-probe apparatus because of its importance in industrial applications. The dependence of DC (direct current) surface resistance on thickness was measured using this method. The surface resistance exhibits the size effect in accordance with the sample (PET) material. The readings are taken with different combination materials such as copper, aluminum carbon strips etc. According to this study suggests that possibility of using PET thin films in electronic components (capacitors, resistors, etc) that operate at temperature dependence applications and this classification not only for polyethylene terephthalate (PET) thin films but also for the other polymer materials
KEYWORDS: Conductivity, Resistivity, Four-probe method, PET thin films.
I. INTRODUCTION
The investigation of the electrical and dielectric properties of polyethylene terephthalate (PET) is interesting both from the fundamental and technological point of view. Several studies have been made of the electrical conductivity of insulating polymer films, [1-3] particularly of polyethylene terephthalate (PET) and polyethylene, but the mechanism of conduction is still ambiguous. Several processes are possible but cannot be distinguished because the morphology, impurity content and electrode-polymer interface of such films cannot be specified. In general, models based on thermal activation of charge carriers over potential barriers whether at trapping sites in the body of the polymer or at the metal electrode-polymer boundary are favored. For example, Amborski (1962) suggested that the current in PET at 130 0C was due to thermal activation of ions between sites separated by distances of about 69 x10-10m On the other hand, Lengyel(l966) suggested that Richardson- Schottky field-aided electron injection was responsible. Polyethylene terephthalate (PET) is often used as a dielectric in high-performance foil capacitors and as a polymer electrode. Therefore there is much interest in the electrical and dielectric properties of this material from the technological point of view. On the other hand, PET has attracted much interest for fundamental investigations by dielectric relaxation spectroscopy (DRS). In most studies this interest is based on PET being a main chain polymer having dielectrically active primary and secondary,relaxation processes and a very useful model for „low‟- crystallinity polymers [9].
II. EXPERIMENTALPART
The Electrical conductivity of polyethylene terephthalate samples were determined by using Four – probe
conducting apparatus. The methods and the material by which using this methods as follows The four-probe
unit consists of four pointed pressure contacts which are equally spaced about 1 millimeter apart and
positioned on a single straight line. The surface has a flat face but is otherwise of any shape. The
four-probe is lowered over the sample so that all the four-four-probes, which are of equal height, make contact with
the sample. A four-probe unit along with a constant current supply source voltmeter and milli Ammeter.
ISSN (Online) : 2319 - 8753
ISSN (Print) : 2347 - 6710
International Journal of Innovative Research in Science, Engineering and Technology
An ISO 3297: 2007 Certified Organization Volume 4, Special Issue 1, February 2015
THIRD NATIONAL CONFERENCE ON ADVANCES IN CHEMISTRY (NCAC – 2015) On 18th February 2015
Organized by
Department of Chemistry, Easwari Engineering College (SRM Group of Institutions), Chennai-600089, India.
Copyright to IJIRSET www.ijirset.com 160
of mica and the two are placed in the holder. The probe is lowered and it is checked that there is good contact between the point-probe and the sample. The voltage is applied to the sample through probes 1 and 4. It is adjusted to give a desired current and its value measured (Ix). The voltage across probes 2 and 3 is measured (Vx). The value of the
inter-probe spacing b is noted from the supplier‟s manual or is, otherwise, measured. Resistivity for the sample between probes 2 and 4 is obtained from Equation (6) and (7 ). The four-probe method gives an average value of the Resistivity. If specimen having irregular shape, Resistivity determination becomes difficult due to the difficulty in measurement of cross-sectional area. The four-probe method avoids the necessity of measurement of cross-sectional area and is thus suitable for arbitrarily shaped samples. It is also an accurate method for determination of ().
Figure1: Four – probe Apparatus
Calculation of Specific Resistivity ():
The Block diagram of the four probe setup as shown in the Figure1, Where b1,b2,b3, represent the four-probes. Voltage
is applied at probes 1 and 4 and the Voltage (VX) between probes 2 and 3 is measured.
Also, the current (IX) is measured. The Resistivity () is given by
R L A
(1) Where L is the Length of the specimen, A is the Area and the R is the Resistance, from the equation (1)
R L A
(2) Where is the Resistivty
RA
L
(3) From the equation (3) the Area of the specimen is the product of the Length (L) and Breath (b) and the equation (3) can be written as
Rb
(4) According to ohm‟s Law R=V / I i.e., Resistance = ( Voltage / Current ), So the equation(4) becomesVb
I
ISSN (Online) : 2319 - 8753
ISSN (Print) : 2347 - 6710
International Journal of Innovative Research in Science, Engineering and Technology
An ISO 3297: 2007 Certified Organization Volume 4, Special Issue 1, February 2015
THIRD NATIONAL CONFERENCE ON ADVANCES IN CHEMISTRY (NCAC – 2015) On 18th February 2015
Organized by
Department of Chemistry, Easwari Engineering College (SRM Group of Institutions), Chennai-600089, India.
Copyright to IJIRSET www.ijirset.com 161
0.002 0.004 0.006 0.008 0.011 0.013 0.015
Vx
(m
V)
apply the probe values in the equation (5),we get
1 3 1 2 2 3
2
1 1 1 1
x
x
V I
b b b b b b
(6)
if b1 = b2= b3 = 8mm
x 2
x
V b I
(7)
If the bottom surface is non-conducting, the factor 2b is replaced by a more complicated correction factor f. This correction factor is supplied by the manufacturer of the probe. And the list of samples used in this study as follows Copper Strip, Aluminum Strip, Carbon Strip, Carbon – Carbon Strip combination, Carbon - Polyethylene terephthalate (250 m) – Carbon, Carbon - Polyethylene terephthalate (175m) – Carbon.
III.RESULTSANDDISCUSSION
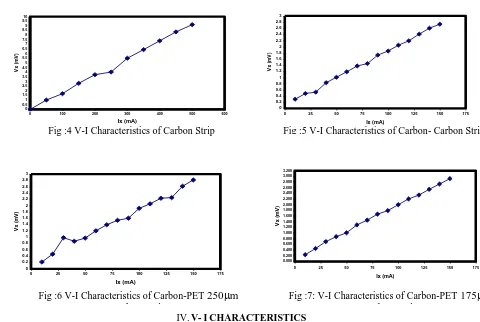
Results obtained by using Four – Probe apparatus are graphically represented in Figs 2- 7 From this we understood that voltage more are less linearly increases with applied current.[4-8] The ratio Vx / Ix shows some variation initially and
reaches constant value beyond 200mA current for copper and beyond 250 mA for Aluminum. For carbon constant value is reached beyond 250 mA. In order to keep electric field within dielectric limit, the experiments were repeated for PET samples up to 150 mA current only. So the Resistivity () value becomes stable beyond 100mA even with sample. Therefore it is understood that thin polymer films of thickness 100- 200 m can be studied by using Four- Probe method and it is possible to measure their specific resistance () using Four – Probe Apparatus.
Sample Carbon-PET(175m)-
Carbon
Carbon-PET(250m)-
Carbon
Carbon Carbon -
Carbon Aluminium Copper Resistivity ()
x10-6 m 331 311 290 280 1.30 0.45 Conductivity (G)
x 10 6 -1 m-1 0.0032114 0.0032154 0.0034448 0.0035710 0.7692100 .2060001 Table1. Calculated Values of Specific Resistance () and Conductivity (G)
From the experimental values it is observed that higher the value of the Resistivity() and the lower the value of the conductivity (G), where inverse of Resistivity is conducvity
Fig : 2 V-I Characteristics of Copper Strip
0.000 0.002 0.004 0.006 0.008 0.011 0.013 0.015
0 100 200 300 400 500 600
Ix (mA)
V
x
(m
V
)
0.000 0.002 0.004 0.006 0.008 0.011 0.013 0.015
0 100 200 300 400 500 600
Ix(mV)
V
x
(
m
V
)
ISSN (Online) : 2319 - 8753
ISSN (Print) : 2347 - 6710
International Journal of Innovative Research in Science, Engineering and Technology
An ISO 3297: 2007 Certified Organization Volume 4, Special Issue 1, February 2015
THIRD NATIONAL CONFERENCE ON ADVANCES IN CHEMISTRY (NCAC – 2015) On 18th February 2015
Organized by
Department of Chemistry, Easwari Engineering College (SRM Group of Institutions), Chennai-600089, India.
Copyright to IJIRSET www.ijirset.com 162
IV.V-ICHARACTERISTICS
Fig 2, 3, and 4 give the V- I Characteristics of copper, Aluminum and Carbon specimens. Copper specimens show linear characteristics only between 200- 400 mA . Aluminum specimen shows linear characteristic only if Ix <
200mA.[10] Carbon specimen show constant slope beyond 300mA. Fig 5 shows even after introducing thin film constant slope is reached even at 100mA. Fig 6 and 7 shows that the thin films of thickness 175 m is more linear than thick film of 250 m.
V. CONCLUSION
The results show that polymer materials behave as insulators. However they have specific Resistance and Conductivity more are less in the range of carbon samples. These results agree with the results of established research reviews. In their opinion, Conductivity of PET may be due to the presence of CH2 groups.
ACKNOWLEDGEMENT
The authors place on record their sincere thanks to the Head of the postgraduate and Research department of Physics in A.M Jain College, Meenambakkam, Ch–114, for the support of this work. We acknowledged the help rendered by Dr. R. Govindaraj, Senior Principle Scientist, CEERI, Chennai Centre, Ch-113, for providing the PET Samples used in this study. 0 0.5 1 1.5 2 2.5 3 3.5 4 4.5 5 5.5 6 6.5 7 7.5 8 8.5 9 9.5 10
0 100 200 300 400 500 600
Ix (mA) V x ( m V ) 0 0.2 0.4 0.6 0.8 1 1.2 1.4 1.6 1.8 2 2.2 2.4 2.6 2.8 3
0 25 50 75 100 125 150 175
Ix (mA) V x ( m V )
Fig :5 V-I Characteristics of Carbon- Carbon Strip Fig :4 V-I Characteristics of Carbon Strip
0 0.2 0.4 0.6 0.8 1 1.2 1.4 1.6 1.8 2 2.2 2.4 2.6 2.8 3
0 25 50 75 100 125 150 175
Ix (mA) V x (m V ) 0.000 0.200 0.400 0.600 0.800 1.000 1.200 1.400 1.600 1.800 2.000 2.200 2.400 2.600 2.800 3.000 3.200
0 25 50 75 100 125 150 175
Ix (mA) V x (m V )
Fig :6 V-I Characteristics of Carbon-PET
250
m
Carbon Strip
ISSN (Online) : 2319 - 8753
ISSN (Print) : 2347 - 6710
International Journal of Innovative Research in Science, Engineering and Technology
An ISO 3297: 2007 Certified Organization Volume 4, Special Issue 1, February 2015
THIRD NATIONAL CONFERENCE ON ADVANCES IN CHEMISTRY (NCAC – 2015) On 18th February 2015
Organized by
Department of Chemistry, Easwari Engineering College (SRM Group of Institutions), Chennai-600089, India.
Copyright to IJIRSET www.ijirset.com 163
REFERENCES
1. Boyd R H, 1985, “Relaxation processes in crystalline polymers: experimental behavior”–a review Polymer 26323–47.
2. Jan Cesnek, Jaroslav dobias, Jirina Housova and Josef Sedlacek,2003, “Properties of thin metallic films for microwave susceptors”. Czech J. Food Sci., Vol. 21 No.1, 34–40.
3. G. Yu and M. Thakur, 1994,“Electrical Conduction in a Non-Conjugated Polymer Doped with SnCl4 and SbCl5”, J. Polym.Sci., Polym. Phys. Ed., 32, p. 2099.
4. Z. Yang and H.J. Giese,1995, “Electrical Conductivity of Iodine-Doped PPV Model Compounds Blended with Polystyrene”,Synth. Meth., 47, p. 95.
5. Ebbesen TW, Lezec HJ, Hiura H, Bennett JW, Ghaemi HF , Thio T, 1996, “Electrical Conductivity of individual carbon nanotubes”.
Nature; 382(6586):54-56.
6. W T Coffey,1975, “On the analysis of electrical conduction in polyethylene terephthalate at high fields”J. Phys. D: Appl. Phys., Vol. 8, p. 186-188.
7. G.W. Wnek, J.C.W. Chein, F.E. Karaz, and C.P. Lillya, “Electrical Conducting Derivative of PPV”, Polymer, 20(1979), p. 1441.
8. E Neagu, P Pissis, L Apekis and J L Gomez Ribelles, 1997, “Dielectric relaxation spectroscopy of polyethylene terephthalate (PET) films” J. Phys. D: Appl. Phys. 30 , p. 1551–1560.
9. Asaad F. Khattab and Saddam M. Ahmad, 2009, “Studies on electrical conductivity of Polypheny- vinylene” The Arabian Journal for Sci. And Engineering, Vol 34, No.1A.