Angle Based Facial Expression Recognition
Maria Antony Kodiyan
1, Nikitha Benny
2, Oshin Maria George
3, Tojo Joseph
4, Jisa David
5Student, Dept of Electronics & Communication, Rajagiri School of Engg: & Technology, Kakkanad, India1
Student, Dept of Electronics & Communication, Rajagiri School of Engg: & Technology, Kakkanad India2
Student, Dept of Electronics & Communication, Rajagiri School of Engg: & Technology, Kakkanad , India3
Student, Dept of Electronics & Communication, Rajagiri School of Engg: & Technology, Kakkanad India4
Assistant Professor, Dept of Electronics & Communication, Rajagiri School of Engg: & Technology, Kakkanad, India5
ABSTRACT: Human communication has two main aspects; verbal (auditory) and non-verbal(visual). Facial expression, body movement and physiological reactions are the basic units of non-verbal communication. Facial expression recognition has attracted increasing attention in computer vision, pattern recognition, and human-computer interaction research communities. Expression recognition is increasingly being used in the mobile and robotics industry. This project deals in the recognition of certain facial expressions in real time which faces many obstacles starting from correctly identifying a face and keeping track of key points on the face to then mapping these points to the right expression. Through the cascaded use of feature detection techniques, adaptive histogram equalization, contour mapping, and filtering this application recognizes 8 key points on the face and compares them to a calibrated neutral face model to extract the current expression. This application can be used to indicate an emotion to those that cannot comprehend expression or to react to the detected expression by playing music based on the users current mode, detecting if the user is lying, and allowing robots to have human-like interaction with the user.
KEYWORDS: Face Detection, Facial feature extraction, Expression recognition
I. INTRODUCTION
Facial expression recognition is an area with large scope of development especially in the field of robotics, animation etc. Recognizing facial expression of the user is a key function for human-robot interaction. Angle based facial expression recognition is an approach which is used for the recognition of different human facial expressions by calculating angles between different facial features like eyes, nose, mouth etc. This project mainly deals with two facial expressions namely happy face and sad face. The project can be broadly classified into three main parts:
_ Face detection
_ Facial feature extraction _ Expression recognition
Real time facial expression recognition involves detection of a face in the current video frame, followed by the identification of key points, such as corners of the mouth, which are analyzed to best fit an emotion that is outputted by the application.
Fig.1.1 Flowchart of Angle based Facial Expression Recognition System
II. FACE DETECTION
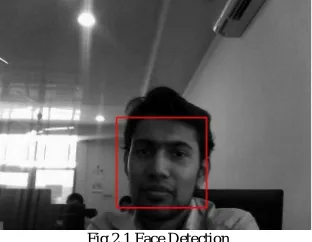
The first part of facial expression recognition system is face detection. In face detection, we want to obtain a face image accurately from acquired image frames. Viola Jones framework is used for facial detection. This framework is capable of processing images extremely rapidly and achieving high detection rates. The work is distinguished by three key contributions. The first is the introduction of a new image representation called the Integral Image which allows the features to be computed very quickly. The second is a learning algorithm which selects a small number of critical visual features from a larger set and yields extremely efficient classifiers. The third contribution is a method for combining increasingly more complex classifiers in a cascade which allows background regions of the image to be quickly discarded while spending more computation on promising object-like regions [5]. The simulated result of the detected face is as shown in Fig 2.1.
Fig.2.1 Face Detection
A. Viola Jones Framework
The three main steps of viola Jones framework are as given below:
known as computing its integral image representation. Using the integral image any rectangular sum can be computed in just four arrays.
2) Classifier Construction: Given a feature set and a training set of positive and negative images, any number of machine learning approaches could be used to learn a classification function. A set of Haar Classifiers are shown in Fig 2.2. The algorithm is designed to select the single rectangle feature which best separates the positive and negative examples. For each feature, the weak learner determines the optimal threshold classification function, such that the minimum numbers of examples are misclassified. It selects critical visual features from a larger set. These are extremely efficient classifiers [3].
Fig.2.2 Haar Classifiers
3) Cascading classifiers: This is a way of combining classifiers. Classifiers are processed after processing the classifiers coming before it. The classifier proceeds in the cascade only if it has not been discarded by the previous detector. The key insight is that smaller, and therefore more efficient, boosted classifiers can be constructed which reject many of the negative sub-windows while detecting almost all positive instances (i.e. the threshold of a boosted classifier can be adjusted so that the false negative rate is close to zero). Simpler classifiers are used to reject the majority of sub windows before more complex classifiers are called upon to achieve low false positive rates as shown in Fig. 2.3.
Fig.2.3 Cascading Process
B. Region detection
Region detection is similar to face detection. It uses the same viola jones framework as explained above. The two main regions detected here are: nose & mouth. Haar classifiers are used for detection. The detected regions are shown in Fig. 2.4, 2.5, and 2.6.
III.FACIALFEATUREEXTRACTION
After detecting the facial regions, the next step is to extract the key points. But before we proceed towards key point extraction, we go for histogram equalization. Then for feature extraction we go for two methods:
_ Contour mapping _ Corner function
A. Contour mapping
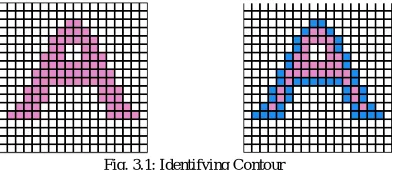
Contour tracing, also known as border following or boundary following, is a technique that is applied to digital images in order to extract their boundary. A digital image is a group of pixels on a square tessellation each having a certain value. Throughout this web site, we will be dealing with bi-level images i.e. each pixel can have one of 2 possible values namely: 1, in which case we’ll consider it a ”black” pixel and it will be part of the pattern, or 0, in which case we’ll consider it a ”white” pixel and it will be part of the background The boundary of a given pattern P, is the set of border pixels of P. Since we are using a square tessellation, there are 2 kinds of boundary (or border) pixels: 4-border pixels and 8-border pixels. A black pixel is considered a 4-border pixel if it shares an edge with at least one white pixel. On the other hand, a black pixel is considered an border pixel if it shares an edge or a vertex with at least one white pixel. (A 4-border pixel is also an 8-border pixel. An 8-8-border pixel may or may not be a 4-8-border pixel.) A point worth mentioning is that it is not enough to merely identify the boundary pixels of a pattern in order to extract its contour. What we need is an ordered sequence of the boundary pixels from which we can extract the general shape of the pattern. An example of identifying a contour is given in Fig. 3.1.
Fig. 3.1: Identifying Contour
Contour tracing is one of many pre-processing techniques performed on digital images in order to extract information about their general shape. Once the contour of a given pattern is extracted, it’s different characteristics will be examined
and can be used as features which will later on be used in pattern classification. Also tracing the contours enables easier identification of corners. Therefore, correct extraction of the contour will produce more accurate features which will increase the chances of correctly classifying a given pattern.
Feature points are extracted separately within each of the areas returned after the region detection. Steps for the searching process are described below.
1) Feature Point Detection from Eye Region: The eye region is composed of dark upper eyelid with eyelash, lower eyelid, pupil, bright sclera and the skin region that surrounds the eye etc. Inner and outer corner are determined by analyzing the shape of the upper eyelid as shown in Fig 3.2.
Fig. 3.2: Detection of feature points from the eye region. (a) Eye region (b) Contrast adjusted eye region (c) Binary version (d) Detected contour (e) Detected eye corners (f) Detected mid-points of upper and lower eyelids.
This can be done by changing the illumination of the upper eyelid in such a way that it differs significantly from its surrounding region. This was done by saturating the intensity values of all the pixels towards zero that constitutes the lower 50 percent of the image intensity cumulative distribution and forcing the rest of pixels to be saturated towards one. The adjusted image is then converted to binary. Contour that covers the largest area is then isolated. For right eye, the inner eye corner is the right most point of the contour and outer eye corner is the leftmost point of the contour. For left eye, right most point over the contour becomes the inner corner and leftmost point becomes the outer corner.
2) Feature Point Detection from Mouth Region: The simplest case of mouth feature points detection occurs when mouth is normally closed. However, complexities are added to this process when mouth is wide open or teeth are visible between upper and lower lips due to laughter or any other expression as shown in Fig. 3.5.
Fig. 3.3: Feature point detection from mouth region (a) Mouth region (b) Intensity adjustment (c) Complemented mouth region (d) Filled image (e) Binary mouth region (f) Detected mouth contour (g) Detected feature points of mouth region.
These two situations provides additional dark and bright region respectively in the mouth contour and makes the feature point detection process quite complex. To handle these problems, contrast stretching on the basis of pixels cumulative distribution is performed on the image for saturating the upper half fractions of the image pixels towards higher intensity value. As a result, lips and other darker region become darker and the skin region becomes brighter providing a clear separation boundary between the foreground and background. A flood fill operation is then performed on the complemented image to fill-up the wholes of mouth region (Fig. 3.3d). After this, the resultant image is converted to its binary version. All the contours are then identified by applying the 4-connected contour and mouth contour is isolated as the contour having the largest area (Fig. 3.3f). The right mouth corner is then identified as a point over the mouth contour having the minimum x-coordinate value and the point which has the maximum x-coordinate values is considered as the left mouth corner. Middle point (Xmid, Ymid,) of the left and right mouth corner are then calculated and upper and lower mid points of the mouth are obtained by finding the two specific points over the mouth contour which has the same x-coordinate as that of (Xmid, Ymid,) but minimum and maximum y-coordinates respectively[4].
B. Corner function
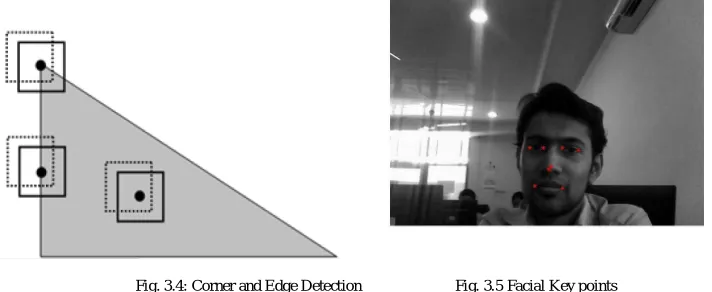
direction, but correspond to the surroundings of its neighbours in the other (perpendicular) direction. A corner pixel has surroundings different from all of its neighbours in all directions. The main aim is to find large change in intensity in both the x and y directions. The corner function identifies corners in an image as shown in Fig 3.4. Two methods are available, the Harris corner detection method (the default) and Shi and Tomasi’s minimum eigen value method. Both methods use algorithms that depend on the eigen values of the summation of the squared difference matrix (SSD). The eigen values of an SSD matrix represent the differences between the surroundings of a pixel and the surroundings of its neighbours. Consider the two eigen values:
_ Both are zero, then no corner feature _ Either one is zero, then edge feature _ Both are high values, then corner feature
The larger the difference between the surroundings of a pixel and those of its neighbours, the larger the eigen values. The larger the eigen values, the more likely that a pixel appears at a corner. Shi- tomasi method checks only for the minimum of both eigen values. If this is a large value then corner is detected. Applying the corner function to the mouth region gives the different corners points. By limiting the number of corners to 2, we get the two corners of the mouth in most test images. These are the important feature points required for expression recognition [1].
Fig. 3.4: Corner and Edge Detection Fig. 3.5 Facial Key points
After performing the facial feature extraction, we will get eight key points on the face. Two key points each for mouth and for both the eyes , one centre point of the image and one centre point of the nose as shown in Fig. 3.5.
IV.ANGLECALCULATION
The best way to calculate angle between three points is by defining vectors passing through these three points and then calculating their dot product. Dot product of two vectors is equal to the product of their magnitudes and the cosine of angle between those two vectors. Hence, we can calculate the angle using the extracted key points as shown n Fig. 4.1.
Angle between three points (P1,P2 and P3) are taken as shown below. _ P1-right corner of mouth
_ P2-centre point of nose _ P3-left corner of mouth
Fig. 4.1: Calculating Angle
V.DATABASE
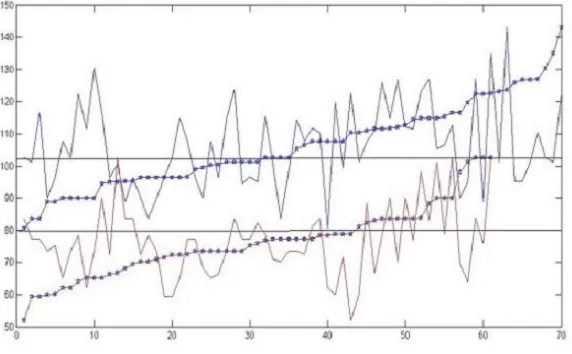
Database includes data from Yale Database and Japanese Fe- male Face Expression Database. It is categorized into two different databases for sad expression and happy expression. The angle values computed for each image is also stored separately. To estimate the angle variations, the graph shown below is plotted using the two sets of data (No: of images Vs. angle). For a particular range of angles the expressions overlap so here we use a bar graph representation to show the percentage of happiness and sadness as shown in Fig. 5.1. An additional feature to continuously train the database is implemented. Each time an expression is estimated, the user can append the current angle value to the file associated with sad/happy expressions. The push buttons on the bottom right of the GUI are for this purpose.
Fig. 5.1: Threshold Determination
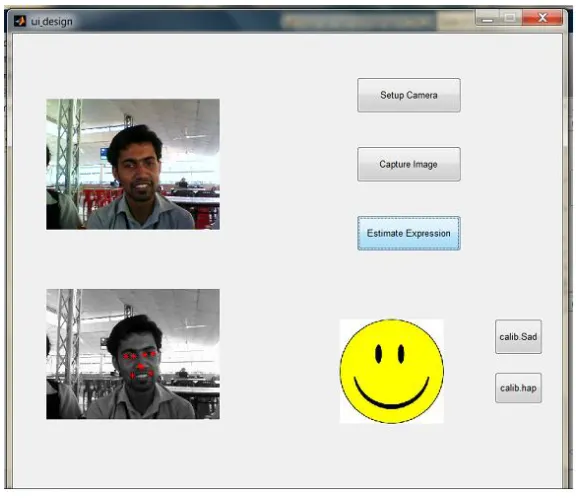
VI.GUIIMPLEMENTATION
Graphical user interface (GUI) is a type of interface that allows users to interact with electronic devices through graphical icons and visual indicators. Steps for real time facial expression recognition using GUI:
_ Step1: set up camera
_ Step2: webcam captures the image
_ Step3: algorithm detects facial key points and expression is determined using angle value _ Step4: current angle is added to the database
Fig 6.1: GUI Implemented
VII.CONCLUSION
Thus, this paper deals with capturing the real time image and extracting the key points from the face image. Based upon these key points an angle is calculated which is a critical deciding factor in facial expression recognition. To set a threshold value for the angle, a database was created with variety of frontal face images and training was performed. Here, we have detected key points of the eyes as well. These points have not been used here in this project, but they can be used for other facial expressions like surprise, anger etc
REFERENCES
[1 Justin DeVito, Amanda Meurer, and Daniel Volz,Smile Identification via Feature Recognition and Corner Detection ,December 15, 2013 [2] Eric DeFelice, Yasemin Ersoy, Kevin Zhou,Stanford University, Expression Recognition System,2012
[3] Phillip Ian Wilson, Dr. John Fernandez, Texas AM University, Facial Feature Detection Using Haar Classifiers, CCSC South Central Conference 2007
[4] Abu Sayeed Md. Sohail and Prabir Bhattacharya, Concordia University, Detection of Facial Feature Points Using Anthropometric Face Model,SITIS 2006