ISSN(Online): 2320-9801 ISSN (Print) : 2320-9798
I
nternational
J
ournal of
I
nnovative
R
esearch in
C
omputer
and
C
ommunication
E
ngineering
(An ISO 3297: 2007 Certified Organization)
Vol. 4, Issue 2, February 2016
Identification of QRS Complexes in ECG
Signal Using Hierarchical Clustering
Algorithm
Sharathchandra Chilkuri1, M. Prabhakara Reddy2, Ibrahim Patel3, Rameshwar4
B.Tech Student, Dept. of Biomedical Engineering, B.V.Raju Institute of Technology, Telangana State, India1
Professor, Dept. of Biomedical Engineering, B.V.Raju Institute of Technology, Telangana State, India2
Assoc. Professor, Dept. of E.C.E, B.V.Raju Institute of Technology, Telangana State, India3
B.Tech Student, Dept. of Biomedical Engineering, B.V.Raju Institute of Technology, Telangana State, India4
ABSTRACT: This paper implements a fast potential based Hierarchical clustering algorithm for the detection of QRS complexes in ECG signal. QRS Complex is the most striking waveform within electrocardiogram (ECG), which provide much information about the current state of the heart function. This paper proposes a novel QRS complex and non QRS Complexes detection using Hierarchical algorithm. The performance of the algorithm is validated using MIT-BIH Database. The efficiency of QRS detection is evaluated based on two parameters namely sensitivity, detection rate and specificity.
KEYWORDS:ECG, MIT-BIH database, Hierarchal algorithm, QRS detection, Butterworth;
I.
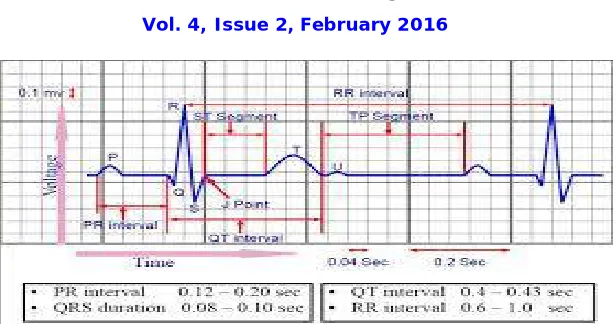
INTRODUCTIONThe Electrocardiogram signal is generated by polarization and depolarization of the heart that occurs when pumping blood throughout the human body, and it can be recorded by contacting electrodes to the skin at specific locations on the body. it provides the valuable information regarding the cardiovascular diseases. Any abnormality in rhythm can provide useful information about the type of disease. in ecg QRS complex is a dominant of electrocardiographic signal, Fig. 1. Its amplitude and time analysis, shape and appearance time of adjacent rhythms estimation can be used to diagnose a wide range of heart diseases. QRS complex is necessary for the determination of the heart rate, and as reference for beat alignment.Thus, the obvious problem is the precise definition of the occurrence time and other various parameters of QRS-complex.
Various methods for classification of arrhythmias have been developed by researchers and clustering technique is one of them. Although it is an unsupervised type of technique, it is advisable technique for analysis and interpretation of long term ECG Holter records. In this paper, Ascending Hierarichal clustering has been used for analysis. Different types of linkages have been used for analysis.
ISSN(Online): 2320-9801 ISSN (Print) : 2320-9798
I
nternational
J
ournal of
I
nnovative
R
esearch in
C
omputer
and
C
ommunication
E
ngineering
(An ISO 3297: 2007 Certified Organization)
Vol. 4, Issue 2, February 2016
Figure 1: An ECG Signal with intervals
II.PRE PROCESSING OF ECG SIGNAL
The major drawback of processing long-term Holter ECG signals is the presence of a high level of noise with multiple manifestations baseline wandering, power line interference or electro myographic activity, so an initial filtering stage needs to be performed. The efforts have been focused on filtering the baseline wandering, as this is the most relevant source affecting the reliability of the clustering algorithm because of the distortion it can cause on the QRS morphology. In this paper we are implementing the IIR Buttorworth filer along with notch filter for pre processing.
III.HIERARCHICAL ALGORITHM
In this paper, the Fast potential based Hierarchical Clustering algorithm [PHA] is implemented on ECG data set, which is an algorithm for an incremental clustering on streaming time sequence. It builds a hierarchical tree-shaped structure of clusters from the agglomerative hierarchical cluster tree, Z, as generated by the linkage function. Agglomerative in this top to bottom strategy follows. The leaves are the resulting clusters, with each leaf grouping a set of variables. The system contains an incremental distance measure and executes procedures for expansion and aggregation of the tree based structure. The system will consider the flow of continuous time series data by monitoring. Then time interval will be fixed. Within the specific time interval the data points will be partitioned into groups. In a partition the distance matrix is calculated is nothing but the between two objects. Each and every data point of the partition will be compare with the dMatrix value. If the data point is greater than the diameter value then the split process will be executing otherwise the Aggregate (Merge) process will be performed. Based on the above criteria the hierarchical tree will be growing. Here we have to observe the splitting process, because the splitting will decide the growth of clusters.
IV.IMPLEMENTATION OF HIERARCHICAL ALGORITHM
Step 1: Load the MIT-BIH ECG Database
Step 2: Applied the IIR Butterworth filter along with notch filter on ECG Database
Step 3: The absolute slope i.e. absolute value of the difference between two consecutive samples is calculated to enhance the signal in the region of QRS-complex. The absolute value of slope of the ECG signal is used as an important discriminating feature because absolute slope of the signal is much more in the QRS-region than in the rest of the region. Fig.2 shows the absolute slope of the filtered ECG signal. To enhance this absolute slope this paper uses moving average criteria. Due to this it is observed that the smoother version of QRS complex is obtained, which is shown in Fig. These absolute slope values are then normalized to reduce the burden of the classifier to form the complicated decision boundary
ISSN(Online): 2320-9801 ISSN (Print) : 2320-9798
I
nternational
J
ournal of
I
nnovative
R
esearch in
C
omputer
and
C
ommunication
E
ngineering
(An ISO 3297: 2007 Certified Organization)
Vol. 4, Issue 2, February 2016
Step 5: After finding two cluster centers using Hierarchal algorithm, the slope curve shown in Fig. 2(c) is scanned. The membership of slope, at a given sampling instant, is found. An output is 1 if a sample belongs to a QRS-cluster and output is 0 if it belongs to a non-QRS-cluster. Thus, a continuous train of 1‟s is obtained in the QRS-region and 0‟s is obtained in the non-QRS region.
0 500 1000 1500 2000 2500 3000 3500 4000
-2 0 2
raw ECG signal record 234
samples
m
V
0 500 1000 1500 2000 2500 3000 3500 4000
-1 0 1
filtered ECG signal record 234
samples
m
V
0 500 1000 1500 2000 2500 3000 3500 4000
0 0.1 0.2
slope of the ECG signal
samples
m
V
0 500 1000 1500 2000 2500 3000 3500 4000
0 1 2
DETECTION OF QRS USING PHA CLUSTERING
samples
m
V
Figure 2: An Implementation of Hierarchal Clustering (a) Raw ECG Signal, (b) Filtered ECG Signal, (c)Slope of the ECG Signal, (d)Hierarchal Clustered Signal
V.SIMULATION RESULTS
Hierarchical algorithms not only detect the QRS complexes of ECG, but also delineate them accurately detection is said to be true positive (TP) if the algorithm correctly discerns the QRS-complex and it is said to be false negative (FN) if the algorithm fails to detect the QRS complex. False positive (FP) detections are obtained if non- QRS-wave is detected as a QRS-complex. The ECG signals used for analysis and detection in this work are a part of MIT-BIH Arrhythmia Database given on the website of MIT-BIH.
The said algorithm is applied on total of 48 records from database. It is observed that, in the case of normal beats (i. e. for record number 100, 101, 102, 104, 105, 106, 107, 112, 113, 115, 117, 119, 121, 122, 123, 201, 202, 209, 212, 213, 215, 217, 219, 220, 221, 222, 223, 228, 230, 231, 232, 234) and right bundle branch block (i.e. for record numbers118,124), the results are encouraging and almost all the beats were detected successfully. Similarly, in the case of left bundle branch block also (i.e. for record numbers 111,207, 214), the total number of complexes detected are accurate and percentage range of Se and P+ is satisfactory.
As the algorithm has been implemented in MATLAB working environment, therefore the part of the whole signal of each data set has been operated. In order to evaluate the accuracy of detection of QRS complex, three essential parameters: sensitivity Se and the positive predictivity P+(detection rate), specificity are used as listed in Table 1. These parameters describe the overall performance of the detector and their values are calculated as follows Sensitivity = TP / (TP + FN)
ISSN(Online): 2320-9801 ISSN (Print) : 2320-9798
I
nternational
J
ournal of
I
nnovative
R
esearch in
C
omputer
and
C
ommunication
E
ngineering
(An ISO 3297: 2007 Certified Organization)
Vol. 4, Issue 2, February 2016
Specificity=TN / (TN+FP)
Using the above formula, Table.1 clearly shows the result as the average detection rate is 98.39% along with 100% sensitivity and specificity is obtained for all 48 MIT-BIH Records.Also the percentage of false positive detection and false negative detection for all records are very less.
S NO
RECORD NO
TOTAL BEATS
TRUE +VE
TRUE -VE
FALSE +VE
FALSE –VE
SENSITIVITY PREDICTIVITY SPECIFICITY
1 100 13 13 0 0 0 100 100% 100%
2 101 11 11 0 0 0 100 100% 100%
3 102 12 12 0 0 0 100 100% 100%
4 103 11 11 0 0 0 100 100% 100%
5 104 13 13 0 0 0 100 100% 100%
6 105 14 14 0 0 0 100 100% 100%
7 106 10 10 0 0 0 100 100% 100%
8 107 11 11 0 0 0 100 100% 100%
9 108 11 11 0 0 0 100 100% 100%
10 109 16 16 0 0 0 100 100% 100%
11 111 12 12 0 0 0 100 100% 100%
12 112 15 15 0 0 0 100 100% 100%
13 113 9 9 0 9 0 100 50% 100%
14 114 9 9 0 0 0 100 100% 100%
15 115 10 10 0 0 0 100 100% 100%
16 116 14 12 0 2 0 100 85% 100%
17 117 9 9 0 0 0 100 100% 100%
18 118 12 12 0 0 0 100 100% 100%
19 119 10 10 0 0 0 100 100% 100%
20 121 11 11 0 0 0 100 100% 100%
21 122 15 15 1 0 0 100 100% 100%
22 123 8 8 0 0 0 100 100% 100%
23 124 8 8 0 1 0 100 88% 100%
24 200 16 7 9 0 0 100 100% 100%
25 201 14 14 0 0 0 100 100% 100%
26 202 9 9 0 0 0 100 100% 100%
27 203 20 13 7 0 0 100 100% 100%
28 205 15 15 0 0 0 100 100% 100%
29 207 10 10 0 0 0 100 100% 100%
30 208 16 16 0 0 0 100 100% 100%
31 209 15 15 0 0 0 100 100% 100%
32 210 16 16 0 0 0 100 100% 100%
33 212 15 15 0 0 0 100 100% 100%
ISSN(Online): 2320-9801 ISSN (Print) : 2320-9798
I
nternational
J
ournal of
I
nnovative
R
esearch in
C
omputer
and
C
ommunication
E
ngineering
(An ISO 3297: 2007 Certified Organization)
Vol. 4, Issue 2, February 2016
Table 1:Different MIT-BIH Records Sensitivity, Predictivity, Specificity
VI.CONCLUSION AND FUTURE WORK
The simulation results showed that the proposed algorithm performs better with the ECG data. This paper represents a method implemented for the Identification of QRS complex in ECG signal using PHA Hierarchical algorithm. The method has been comprehensively tested using the MIT-BIH ECG database covering wide variety of QRS complexes. A considerable detection rate 98.39% is obtained. It is observed that the information obtained through this algorithm is very useful for ECG classification and diagnosis. It is also possible to extend this method for automatic ECG signal analysis and diagnosis
.
REFERENCES
[1] Ms.Ananya,Dr.S.L.Nalbalwar,Swarali Seth, “Detection of QRS Complexes in ECG using Kmeans Algorithm” International Journal of Engineering Research & Technology (IJERT), Vol. 3 Issue 5, May – 2014
[2] Carsten Meyer,Jose Fernadez Gavela, Matthew Harris,“Combining Algorithms in Automatic Detection of QRS Complexes in ECG Signals”, IEEE transactions on Information Technology in Medicine, Vol.10,No.3,July 2003
[3] V.Kavitha, M. Punithavalli, “Clustering Time Series Data Stream – A Literature Survey”, International Journal of Computer Science and Information Security, Vol.8, No.1, April 2010, pp289-293
[4] Engelse W. A. H. and Zeelenberg C., “A single scan algoriothm for QRS detection and feature extraction,” Computer in Cardiology, IEEE compu. Soc., pp. 37-42, 1979.
[5] Chouhan V. S. and Mehta S.S., “Detection of QRS-complexes in 12-lead ECG using adaptive quantized threshold,” International Journal of Computer Science and Network Security, vol. 8, no.1, pp. 155-163, 2008.
[6] Kohler B. U., Henning C. and Orglmeister R., “The principles of software QRS detection,” IEEE Eng. in Med. and Bio, pp. 42-47, 2002 [7] V. Kavitha, Dr. M. Punithavalli, “Improved Hierarchical Clustering Using Time Series Data”, ISSN 2250-2459, ISO 9001:2008 Certified
Journal, Volume 3, Issue 1, January 2013
[8] Pedro Pereira Rodriguess and Joao Pedro Pedroso, “Hierarchical Clustering of Time Series Data Streams” ‖ IEEE Transactions on Knowledge and Data Engineering vol.20,no.5,pp.615-627,May 2008.
[9] Bert--‐Uwe Kohler, Carsten Hennig, Reinhold Orglmeister,“The Principles Of Software QRS Detection: Reviewing And Comparing Algorithms For Detecting This Important ECG Waveform”, IEEE Engineering In Medicine And Biology, February 2002.
[10] www.physionet.org/physiobank/database/mitdb MIT Database [11] Matlab help, MATLAB MATHWORKS. http://www.mathworks.com
35 214 12 12 0 0 0 100 100% 100%
36 215 18 18 0 0 0 100 100% 100%
37 217 12 11 1 0 0 100 100% 100%
38 219 13 13 0 0 0 100 100% 100%
39 220 12 12 0 0 0 100 100% 100%
40 221 13 13 0 0 0 100 100% 100%
41 222 13 13 0 0 0 100 100% 100%
42 223 14 14 0 0 0 100 100% 100%
43 228 12 12 0 0 0 100 100% 100%
44 230 14 14 0 0 0 100 100% 100%
45 231 10 10 0 0 0 100 100% 100%
46 232 8 8 0 0 0 100 100% 100%
47 233 17 17 0 0 0 100 100% 100%
48 234 15 15 0 0 0 100 100% 100%