Indian PHWR Pre-Stressed Concrete Containment Performance
Evaluation with BARCOM and Round Robin Analysis Program
R K Singh
a, A K Ghosh, H S Kushwaha
Reactor Safety Division, Health Safety and Environment Group Bhabha Atomic Research Centre, Trombay, Mumbai 400085, INDIA
a
Corresponding Author Email: [email protected], [email protected]
Keywords: nuclear containment safety, ultimate load capacity, reinforced pre-stressed concrete structure, non-linear finite element analysis, PHWR, severe accidents
1 ABSTRACT
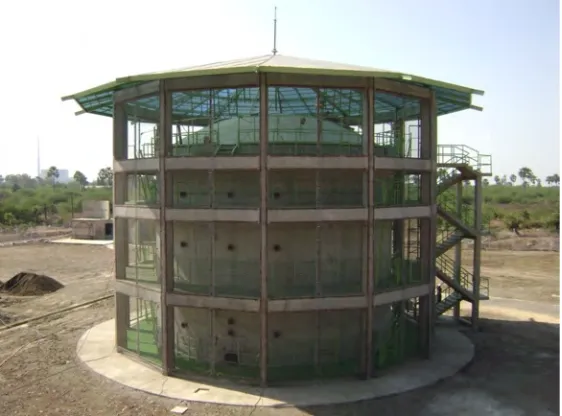
Containment safety has been an active area of research for Indian nuclear power program. BARC Containment (BARCOM) Test Model has been constructed at BARC-Tarapur Containment Test Facility to study its failure modes and establish the margin against the design pressure (Pd) for the functional and structural performance evaluation. BARCOM Test Model is a 1:4 scale representation of Tarapur station 540 MWe Pressurized Heavy Water Reactor (PHWR) pre-stressed concrete inner containment structure and is the largest containment model built in the world, which will be shortly tested up to its ultimate load capacity. An international round robin analysis program has been coordinated for the pre-test prediction and post-test analysis of BARCOM and the experimental results would be analyzed with the inelastic numerical code results obtained from around 14 registered participants. The paper describes the objectives of the experimental test program, the salient features of BARCOM Test Model and the results of the pre-test predictions submitted by various registered international round robin participants.
2 INTRODUCTION
Bhabha Atomic Research Centre (BARC), Trombay has organized an International Round Robin Analysis program to carry out the ultimate load capacity assessment of BARC Containment (BARCOM) test model (Fig. 1). The test model located in BARC facilities Tarapur; is a 1:4 scale representation of 540 MWe Pressurized Heavy Water Reactor (PHWR) pre-stressed concrete inner containment structure of Tarapur Atomic Power Station (TAPS) unit 3&4. The overall project planning and initial design for the BARCOM test model were carried out in BARC Trombay and subsequently the test model detail design and construction activities were coordinated in association with Nuclear Power Corporation of India Limited (NPCIL) in 2006-2008. More than 800 embedded sensors have been installed during the construction phases in different concrete pours and additional around 300 surface type sensors are being installed. The list of sensors include vibratory wire strain gauges of embedded and spot-welded type, electrical resistance strain gauges, dial gauges, earth pressure cells, tilt meters and high resolution digital camera systems for structural response, crack monitoring and fracture parameter measurement to evaluate the local and global behaviour of the containment test model. The model will be tested pneumatically during the low pressure tests (LPTs) followed by proof test (PT) and integrated leakage rate test (ILRT) during commissioning, which will be followed by the over pressure test (OPT) up to the functional failure of the test model. Finally the ultimate load capacity test (ULCT) will be completed.
Kingdom (2) and India (5) have registered. The registered participants were provided with the model design document and supporting drawings for the pre-test prediction of the test model performance for the over pressurization test. Total sixty-nine (69) Specified Sensor Locations (SSL) out of around 1100 sensors were identified for the pre-test predictions by the participants. The outputs recorded at these specified locations during the test along with the pre-test predictions by various registered participants will help to assess the over all test data collected during the various phases of the experiments. With this International Round Robin exercise, it has been possible to predict the ultimate load capacity of the BARCOM test model and understand the overall global and local failure modes. It is expected that the present pre-test and the future post–pre-test numerical analyses submitted by various participants will assist in benchmarking different computer codes and the constitutive models along with the analysis procedures for the ultimate load capacity assessment of concrete containments. Further, with the evaluation of the test data, the margin against the design pressure of the PHWR containment structures will be established with greater confidence. Thus the PHWR containment structure performance evaluation for extremely low probable beyond the design basis accidents can be made for the public acceptance of Indian nuclear power plants.
The features of the BARCOM test model and the constitutive data for the pre-test analysis along with the comparison of the results submitted by various participants are described in this paper.
2.1 Background Review
In order to assess the integrity of the containment structure for beyond the design basis severe accidents, which has extremely low probability of occurrence; it is desirable to evaluate the margin over the design pressure for different failure modes. The accidents at Three Mile Island (USA) and Chernobyl (former USSR) nuclear plants had led to wide attention on the ultimate load capacity assessment of containments structures. The German regulation requires ruling out containment structure failure by design measures and studies by Liersch et. al. [1] recommend a load factor of 3 over the design pressure at which normally the containment target leak tightness is ensured. The current practice for US and British nuclear plants is to design the containment structure with a factor of safety above 2 on the DBA pressure as demonstrated in the pre-stressed concrete model test for Sizewell B PWR plant in Davies et. al. [2] and earlier Sandia model test reported by Horschel et. al. [3] for reinforced concrete containments. All the new nuclear containments around the world are being constructed with this standard practice as per the pre-stressed concrete reactor vessel design philosophy of ASME design code section III 1998 [4], where a factor of safety of 2 is assured over the design basis accident.
Earlier, Sandia National Laboratory, USA and Nuclear Power Engineering Corporation, Japan sponsored a round robin exercise on a PWR steel lined pre-stressed concrete containment model in the year 2000-01 [5]. In the pre-test evaluation of the ultimate load capacity of the PWR test model, the participants from BARC Trombay provided the requisite analysis feedback. Subsequently the predictions made by BARC in-house finite element code ULCA, developed by Singh et. al. [6,7] were found to be in excellent agreement with the observed and published test results, as reported by Basha et. al. [8,9] and another paper by Singh [10]. This code has earlier been extensively used to predict the ultimate load capacity of 220 / 540 MWe PHWR containment designs and a factor of safety ~2.3-2.5 over the design pressure has been demonstrated for the PHWR primary inner pre-stressed concrete containment [6,7]. The pressure associated with these beyond design basis accidents have been found to be considerably in excess of design basis accidents pressures due to Main Steam Line Break (MSLB) or Loss of Coolant Accident (LOCA) conditions.
studies with round robin analysis results obtained from around 14 registered participants during the pre-test and post-test phases.
2.2 Objectives of BARCOM Test Program
The objective of the present test program is to obtain the pressure, displacement and strain data related to the various failure modes of the BARCOM test model. The experimental program is distributed in four phases to study the functional and structural behavior of the containment test model up to the ultimate pressure during the year 2009-10. Following observations would be recorded that would aid in understanding the functional and structural behavior of the containment model up to the functional limit and ultimate pressures.
• Instrument calibration tests and preliminary lower pressure tests at half the design pressure
• Proof test and integrated leakage rate test at the design pressure of 0.1413 MPa (1.44 kg/sq cm) and various leakage experiments in different phases
• First appearance of concrete cracking
• First through thickness cracking
• First yielding of the reinforcement bars and subsequent strain levels at various pressure levels
• Tendon strain levels and gradual loss of pre-stress and associated leakage through concrete and around different openings
• First significant loss of leak tightness
• Maximum pressure sustained by the model before massive leakage signifying the functional failure of the containment structure (1% strain in tendon)
• Ultimate collapse pressure of the containment test model
It is planned to measure the leakage rate to establish the degree of imperviousness at the above milestone pressures reached by the test model. This study would help to validate the available analytical and semi-empirical models for the prediction of the leakage rate with respect to the pressure and crack width data. The test results will be used by the organizers for the comparison and evaluation of the numerical pre-test and post-test results submitted by the registered participants of the present international round robin program. The registered participants have been requested to predict the response of the test model for the above milestones in addition to the response at the Specified Sensor Locations (SSL). This would give insight into the failure behaviour of the concrete containment structures and experimentally benchmark computer codes and modelling procedure thus evolved would be the future tools for design and safety analysis of containment structures.
3. BARCOM TEST MODEL DESCRIPTION
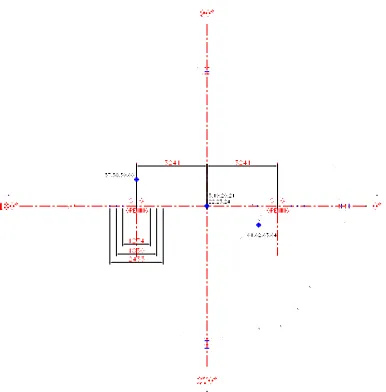
wire mesh on the outer structure, missiles of concrete chunks and other structural members generated due to the failure of the containment model during the ultimate pressure test will be arrested. In this containment model, two steam generator (SG) openings in the dome along with main air lock (MAL), fuelling machine airlock (FMAL) and emergency air lock (EAL) barrel openings in the cylindrical wall have been simulated as detailed in [12]. The test model wall is enclosed with a torispherical dome of radius 9.794 m. At the spring line of ring beam and the dome a local dome thickness of 425 mm has been provided. The two steam generator (SG) openings of diameter 1.35 m are spaced symmetrically at 3.241 m from E-W axis from the dome apex. The local thickness of IC dome is 250 mm near the SG openings, which are closed by dished shape steel hatch welded to the embedded part around the openings.
Figure 2 shows the developed view of the wall, where the EAL, FMAL and MAL positions are indicated at the azimuths of 90o, 180o and 270o. The azimuth of 0o has been selected as the location to represent the general free-field behaviour of the model, since it is situated beyond the influence zone of any penetration for evaluation of the experimental results. Fig 3 shows the plan view of the dome, where the two SG openings are located. The solid bullets in Figs. 2-3 show the specified sensor locations (SSL) where the Round Robin participants have been requested to submit the pre-test predictions and post-test analysis results for comparison with response of the model under different stages of pressurization.
Extensive material test programs were identified and initiated to determine the concrete stress-strain response, compressive and split tensile strengths and fracture energy values for trial and pour concrete mixes (Fig 4-5). Standard stress-strain tests on rebars and specialized tests on pre-stressing tendons (Fig 6) were carried out. In particular, the tests on concrete specimens continued till the end of the construction with samples cast from different pours. In the pre-test the participants have been given some of the available specimen test results at the initiation of the round robin analysis activity and additional data will be supplied to them for the post-test evaluation of BARCOM test model.
4 PRE-TEST ROUND ROBIN RESULT COMPARISON
4.1 Pre-test Response at Specified Sensor Locations
Fig 7-8 show the radial displacement plots with respect to pressure at 3 m above FMAL and dome crown. The displacement response is reasonably comparable within the elastic region in the wall, while there are variations in the radial displacement at the dome apex location. Fig. 9-11 show the hoop concrete strain, hoop rebar strain and hoop tendon strain comparison in the wall free field at 6.95 m EL. At least three participants have clearly predicted functional failure with the strain levels crossing 1% in the hoop tendon. Fig 12-13 show the concrete hoop strain and rebar hoop strain plots above FMAL at 5.85 m EL. Fig 14 show the hoop tendon strain above EAL at 3.24 m elevation and again the three results have crossed the mark of 1% tendon strain signifying the functional failure. It is noted that in general the agreement among the different results is reasonable within the elastic regime but there are large variations in the inelastic response of BARCOM test model as predicted by various participants. The participants will be provided the recorded strain data collected on the instrumented tendons for the improved pre-stressing simulation in their respective numerical models.
5 CONCLUSIONS
The present paper has identified the objectives of the Round Robin analysis program for containment safety research undertaken by BARC Trombay. The specific features of BARC Containment (BARCOM) test model, sensors and experimental program in various phases have been highlighted. Based on the pre-test results additional sensors are being installed and the participants will be given the data of instrumented tendons and additional data on the recorded strains and displacements. In addition, constitutive data is also being generated through additional sample tests for the improved computation and post test evaluation of BARCOM test model.
6 REFERENCES
1. Liersch G et. al. “Concept Study for a Combined reinforced Concrete Containment”, Proc. Third Int. Conf. on Containment Design and Operation”, CNS, 1994.
2. Davies D R, Roberts A C, Ness D, “A Review of the Design and Construction of the Sizewell B Pressurized Water Reactor Building Containment Structure”, NED 156, p 259-268, 1995.
3. Herschel D S, “ Experimental Results from Pressure Testing of a 1:6 Scale Nuclear Power Plant Containment, NUREG/CR-5121, SAND88-0906, Jan 1992.
4. ASME Boiler & Pressure Vessel Code, ‘Rules for Construction of Nuclear Power Plant Components.”, Section III, Division-1, Division-2 and Appendices, 1998.
5. PCCV Round Robin Analysis Design Package, SO-97-O47, Sandia National Laboratories, USA, 1997.
6. Singh R K, Gupta A, Kushwaha H S, Mahajan S C, Kakodkar A, “Ultimate Load Capacity Assessment of Indian PHWRS - Some Pre Test Results”, U02/5, SMiRT 12, Stuttgart, Germany, Aug.15-20, (1993).
7. Gupta A, Singh R K, Kushwaha H S, Mahajan S C, Kakodkar A, “Assessment of Ultimate Load Capacity of Inner Containment for Indian PHWR”, Invited Paper, Division H, SMiRT 13, Porto Alegre, Brazil, (1995).
8. Basha S M, Singh R K, Patnaik R, Ramanujam S, Kushwaha H S, Venkat Raj V, “Predictions of Ultimate Load Capacity for Pre-Stressed Concrete Containment Vessel Model with BARC Finite Element Code ULCA”, “Annals of Nuclear Energy” 30/4, pp. 437-471, March (2003).
Pre-stressed Concrete Containment Test Model”, SMiRT-17, Prague, August 17-22, 2003 (Division H).
10. Singh R K, “Nonlinear Analysis of RC/PC Structures using Phenomenological Stress-Strain Plasticity, Fracture and Damage Mechanics Constitutive Models”, Invited Paper in Panel Workshop, WH1, SMiRT-19, Toronto, 2007.
11. “Features of 1:4 Size 540 MWe PHWR Pre-Stressed Concrete Containment Test Model at Tarapur and the List of Proposed Experiments”, A Report Prepared by the Committee Constituted by Director, BARC for X-PLAN Project 5.06-A1 of Reactor Safety Division, BARC, Trombay, Mumbai-400085, Oct (2006.
12.
Singh R K. 2009. Pre-Test Report on International Round Robin Analysis of BARC Containment (BARCOM) Test Model. Jan 28, 2009. ISBN: 97.8-81-8372-046-5.Fig 2 Specified Sensor Locations (SSL) on BARCOM Wall Developed View
0 10 20 30 40 50 60
0 0.001 0.002 0.003 0.004 0.005 0.006 Strain (mm/mm)
S
tr
e
s
s
(M
P
a
)
Strain-1 Strain-2
0.0 0.5 1.0 1.5 2.0 2.5 3.0 3.5 4.0
0 5000 10000 15000 20000 25000 30000
L
O
A
D
i
n
K
g
Elongation in %
Fig 3 Specified Sensors Locations (SSL) on
Dome
Fig 4 Softening Curve for M 45
Grade Concrete
Fig 5 Tendon Stress Strain Curve