ABSTRACT
MANHARD, ROBYN ELISE. Impact of Grade 80 Reinforcing Steel Production Process on the Seismic Behavior of Bridge Columns. (Under the direction of Dr. Mervyn Kowalsky).
The use of ASTM A706 Grade 60 reinforcing steel is ubiquitous in modern seismic design of reinforced concrete structures due to well-established behavior including high ductility capacity along with strict specifications on material properties. Higher strength reinforcing steel has been available for decades, and Grade 80 was added to the ASTM A706 specification in 2009. The use of higher strength steel could be beneficial in reducing congestion in reinforced concrete members and creating designs that are more efficient. However, design codes limit the use of Grade 80 reinforcing steel in seismic applications due to lack of research establishing its performance in inelastic members.
Previous research found that various factors, including rib geometry and manufacturing process, may affect the performance of Grade 80 reinforcing steel under cyclic loading. This previous research proposed a new material test that may be able to predict column performance. Two types of reinforcing steel that performed favorably in these material tests were selected, and four reinforced concrete columns were constructed with this steel. These columns were used to test the hypothesis of the material tests and expanded upon the current understanding of the behavior of members constructed with Grade 80 reinforcing steel. The results of the column tests were also compared against Grade 60 columns in order to determine the suitability of current models and design provisions for Grade 80 reinforcement.
Furthermore, this research utilized both quench-and-self-tempered (QST) steel and micro-alloyed as longitudinal reinforcement for the columns. QST steel may be an advantageous material; however, QST steel typically has a lower T/Y ratio than micro-alloyed steel and, for this reason, is not classified as ASTM A706. Although there is a minimum specified T/Y ratio of 1.25 in the ASTM A706 standard, there has not been research to prove that this value is
This research expanded upon the knowledge both of Grade 80 reinforcing steel and QST steel for use in seismic applications. The results suggest that Grade 80 steel may be used in place of Grade 60 steel for inelastic members. Furthermore, the T/Y ratio was found to be less
Impact of Grade 80 Reinforcing Steel Production Process on the Seismic Behavior of Bridge Columns.
by
Robyn Elise Manhard
A thesis submitted to the Graduate Faculty of North Carolina State University
in partial fulfillment of the requirements for the degree of
Master of Science
Civil Engineering
Raleigh, North Carolina 2019
APPROVED BY:
_______________________________ Dr. Mervyn J. Kowalsky
Committee Chair
BIOGRAPHY
Robyn Elise Manhard was born and raised in Johnson City, Tennessee as the youngest of four daughters. She graduated from Science Hill High School in 2013 and went on to attend Auburn University. At Auburn, she developed an interest in structural engineering and had internships with Colonial Pipeline Company in Alpharetta, Georgia and Chad Stewart and
iii ACKNOWLEDGMENTS
This research was funded by the California Department of Transportation (Caltrans), whose support is gratefully acknowledged. The donations from reinforcing steel mills CMC, Gerdau, and Nucor, and discussions with their metallurgists are also greatly appreciated.
Thank you to my advisor, Dr. Mervyn Kowalsky, for giving me the opportunity to
participate in hands-on research and being an enthusiastic mentor to me throughout this project. I would also like to thank Dr. Jim Nau and Dr. Rudi Seracino for serving on my committee and being so welcoming since my arrival at NC State.
Thank you to the all the staff and students at the Constructed Facilities Laboratory at NC State. I am very grateful for the staff: Jerry Atkinson, Dr. Greg Lucier, Johnathan McEntire, and Ben Smith. Your patience, practical advice, and troubleshooting is truly appreciated, and this project would have been impossible without you. Thank you to the undergraduate researchers: Daniel Binello, Taylor Brodbeck, Cade Karrenberg, Annie Loeliger, Anthony Pandoli, and Zach Shurow. You all were indispensable in both the construction and testing, from helping with the heavy lifting, to problem-solving on the spot, to making mundane tasks more enjoyable. Thank you to my fellow graduate researchers who kept me sane. I will always cherish the camaraderie we had through all the late nights, thousands of cups of coffee, debates of various theories, and breaks for crossword puzzles.
TABLE OF CONTENTS
LIST OF TABLES ... vii
LIST OF FIGURES ... viii
LIST OF SYMBOLS ... xiv
Chapter 1: Introduction ... 1
1.1 Background ... 1
1.1.1 Current Use of Grade 80 Reinforcing Steel ... 1
1.1.2 Use of Quench-and-Self-Tempered Steel ... 2
1.2 Experimental Program at North Carolina State University ... 4
1.3 Scope ... 6
1.3.1 Column Tests ... 6
1.3.2 Investigation of T/Y Ratio Effects ... 7
1.4 Overview of Document Contents ... 7
Chapter 2: Literature Review... 9
2.1 Grade 80 Reinforcing Steel ... 9
2.1.1 Overby, Kowalsky, and Seracino (2017) ... 9
2.1.2 Barcley and Kowalsky (2018) ... 12
2.1.3 Restrepo, Seible, Stephan, and Schoettler (2006) ... 17
2.1.4 Rautenberg, Pujol, Tavallali, and Lepage (2013) ... 18
2.1.5 Barbosa, Link, and Trejo (2016) ... 19
2.2 Quench-and-Self-Tempered Reinforcing Steel ... 19
2.3 Tensile-to-Yield Ratio ... 20
Chapter 3: Column Tests ... 23
3.1 Experimental Setup ... 23
3.1.1 Summary of Tests ... 23
3.1.2 Test Specimen and Setup ... 23
3.1.3 Load Protocol ... 27
3.1.4 Specimen Construction ... 28
3.1.5 Instrumentation ... 33
3.1.6 Material Properties ... 34
3.2 Column Test 1 ... 38
3.2.1 Damage Progression ... 42
3.2.2 Axial Strain Analysis ... 46
v
3.2.4 Energy Dissipation ... 55
3.2.5 Components of Displacement ... 58
3.3 Column Test 2 ... 63
3.3.1 Damage Progression ... 66
3.3.2 Axial Strain Analysis ... 71
3.3.3 Bending Strain Analysis ... 75
3.3.4 Energy Dissipation ... 75
3.3.5 Components of Displacement ... 77
3.4 Column Test 3 ... 80
3.4.1 Damage Progression ... 83
3.4.2 Axial Strain Analysis ... 87
3.4.3 Bending Strain Analysis ... 91
3.4.4 Energy Dissipation ... 92
3.4.5 Components of Displacement ... 93
3.5 Column Test 4 ... 96
3.5.1 Damage Progression ... 99
3.5.2 Axial Strain Analysis ... 104
3.5.3 Bending Strain Analysis ... 107
3.5.4 Energy Dissipation ... 108
3.5.5 Components of Displacement ... 109
Chapter 4: Comparisons of Column Performance ... 112
4.1 Overall Response... 112
4.1.1 Column Tests 1 and 2 ... 112
4.1.2 Column Tests 3 and 4 ... 116
4.1.3 Overall Comparison ... 119
4.2 Axial Strain Demands and Limit States ... 121
4.2.1 Pre-Yield Strains ... 121
4.2.2 Strain Profiles... 122
4.2.3 Strain Limit States... 124
4.3 Bending Strain ... 126
4.4 Energy Dissipation ... 128
4.4.1 Cumulative Energy Dissipation ... 129
4.4.3 Equivalent Viscous Damping ... 132
4.6 Plastic Hinge Length ... 134
4.7 Strength Hardening ... 137
Chapter 5: Defining the Onset of Bar Buckling ... 139
5.1 Background ... 139
5.2 Physical Definition of Bar Buckling ... 139
5.3 Visual Identification ... 140
5.4 Strain History ... 141
5.5 Bending Strain Analysis ... 143
5.6 Global Force Degradation ... 144
5.7 Comparisons & Recommendations ... 145
Chapter 6: Impact of Ultimate Tensile to Yield Strength Ratio ... 148
6.1 Importance and Background ... 148
6.2 Analytical Study ... 149
6.2.1 Concepts ... 149
6.2.2 Methodology ... 150
6.2.3 Results and Discussion ... 152
6.3 Experimental Results... 154
6.4 Material Tests ... 155
Chapter 7: Conclusions and Future Work ... 158
7.1 Column Tests ... 158
7.2 T/Y Ratio ... 159
7.3 Future Work ... 160
REFERENCES ... 162
vii LIST OF TABLES
Table 2.1 A706 Grade 80 Tensile Testing Results and Design Parameter
Recommendations (Overby et al. 2017) ... 11
Table 2.2 “Phase 1” Test Matrix of Barcley and Kowalsky (2018) ... 12
Table 3.1 Phase 2 Test Matrix ... 23
Table 3.2 Tensile Properties of Reinforcing Steel ... 35
Table 3.3 Concrete Strength Test Results ... 36
Table 3.4 Column Test 1 Summary Information ... 38
Table 3.5 Limit State Definitions (Kowalsky 2000) ... 51
Table 3.6 Column Test 1 Strains at Damage Levels ... 52
Table 3.7 Column Test 2 Summary Information ... 63
Table 3.8 Column Test 2 Strains at Damage Levels ... 74
Table 3.9 Column Test 3 Summary Information ... 80
Table 3.10 Column Test 3 Strains at Damage Levels ... 91
Table 3.11 Column Test 4 Summary Information ... 96
Table 3.12 Column Test 4 Strains at Damage Levels ... 107
Table 4.1 Column Tests 1 & 2 Ultimate Limit State Comparisons ... 116
Table 4.2 Column Tests 3 & 4 Ultimate Limit State Comparisons ... 119
Table 4.3 Overall Comparison of First Instance of Bar Buckling ... 120
Table 4.4 Overall Comparison of Last Cycle without Bar Fracture ... 120
Table 4.5 Strain Comparisons at Initial Cracking, Crushing, and Spiral Yielding ... 125
Table 4.6 Phase 2 Strain and Drift Comparisons at Bar Buckling ... 126
Table 6.1 Design Parameters Considered in Analysis ... 151
LIST OF FIGURES
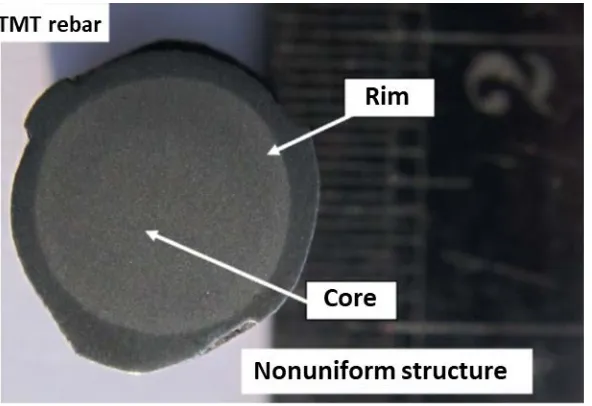
Figure 1.1 Microscopic View of TMT Reinforcing Bar (Paul et al. 2014) ... 3
Figure 1.2 Strain Demand on Buckled Bar (Barcley and Kowalsky 2018) ... 5
Figure 2.1 BBT Test Results for Column Steel (Barcley and Kowalsky 2018) ... 14
Figure 2.2 Comparison of Strain Histories and Critical Strains for Grade 80 and Grade 60 Column Tests (Barcley and Kowalsky 2018) ... 15
Figure 2.3 BBT Results for Mill 2 Grade 80 (Barcley and Kowalsky 2018) ... 16
Figure 2.4 (a) Mill 1 bar profile; (b) Mill 2 bar profile (Barcley and Kowalsky 2018) ... 16
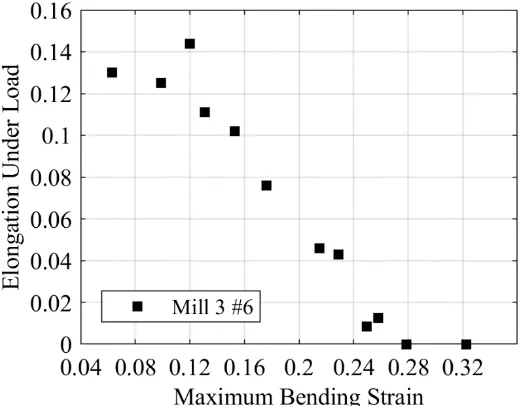
Figure 2.5 BBT Results for Mill 3 Grade 80 (QST) ... 17
Figure 2.6 Force-Displacement Response for Beams with (a) Yield Ratio of 0.90 (T/Y = 1.11); (b) Yield Ratio of 0.75 (T/Y = 1.33) in the Japan New RC Project (NEHRP Consultants Joint Venture 2014) ... 22
Figure 3.1 Specimen Reinforcement Configuration ... 24
Figure 3.2 Plan View of Footing Reinforcement Configuration ... 24
Figure 3.3 Conceptual Test Setup ... 25
Figure 3.4 Actual Test Setup ... 26
Figure 3.5 Longitudinal Bar Labeling ... 26
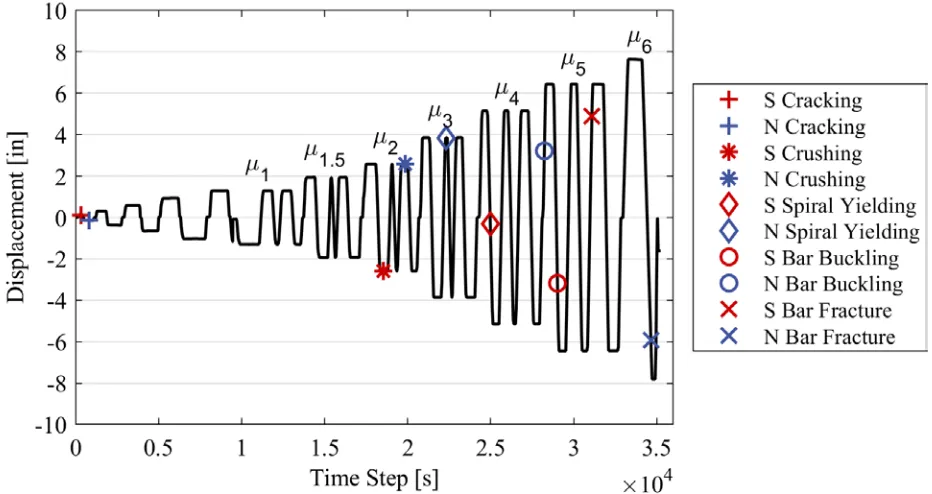
Figure 3.6 Load Protocol Example ... 28
Figure 3.7 (a) Column Cage Construction; (b) Tails of Longitudinal Bars ... 29
Figure 3.8 Joint Reinforcement Construction ... 30
Figure 3.9 (a) Footing Reinforcement; (b) Completed Footing Construction ... 30
Figure 3.10 (a) Cover Block-Out Strips; (b) Cover Block-Out Foam Sheet ... 31
Figure 3.11 (a) Column and Cap Beam Formwork; (b) Column and Cap Beam Casting; ... 32
Figure 3.12 (a) Removal of Foam Strips; (b) Final Instrumented Specimen ... 33
Figure 3.13 (a) Longitudinal Steel Stress-Strain Curves; (b) Comparison of Yield Plateaus ... 35
Figure 3.14 (a) Footing Concrete Measured Strength Gain; (b) Column Concrete Measured Strength Gain ... 37
Figure 3.15 Column Test 1 Displacement History ... 39
ix Figure 3.17 Column Test 1 Comparison of Experimental and Prediction Backbone
Curves ... 41
Figure 3.18 Calculation of Theoretical Force including P-Delta Effects ... 41
Figure 3.19 Column Test 1 (a) South Face at +0.75𝐹𝐹𝐹𝐹′; (b) North Face at -0.75𝐹𝐹𝐹𝐹′ ... 43
Figure 3.20 Column Test 1 (a) South Face at +𝐹𝐹𝐹𝐹′; (b) North Face at -𝐹𝐹𝐹𝐹′ ... 43
Figure 3.21 Column Test 1 (a) Crushing on South Face at µ21-; (b) Crushing on North Face at µ23+; ... 44
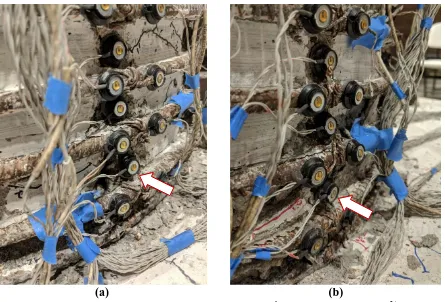
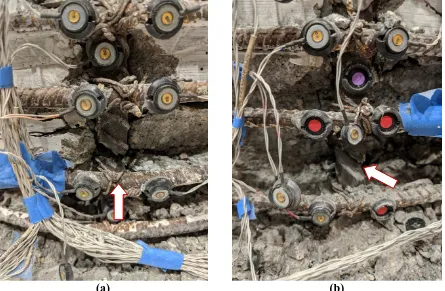
Figure 3.22 Column Test 1 (a) S4 Buckling at µ51-;(b) N4 Buckling at µ52+; ... 44
Figure 3.23 Column Test 1 (a) S4 Fracture at µ53+;(b) N4 Fracture at µ61- ... 45
Figure 3.24 Column Test 1 (a) South Face after Test;(b) North Face after Test ... 45
Figure 3.25 Column Test 1 (a) S4 Strain Profiles up to First Yield;(b) N4 Strain Profiles up to First Yield ... 47
Figure 3.26 Column Test 1 (a) S4 Strain Profiles;(b) N4 Strain Profiles ... 48
Figure 3.27 Column Test 1 (a) South Spiral Strain Profiles;(b) North Spiral Strain Profiles ... 48
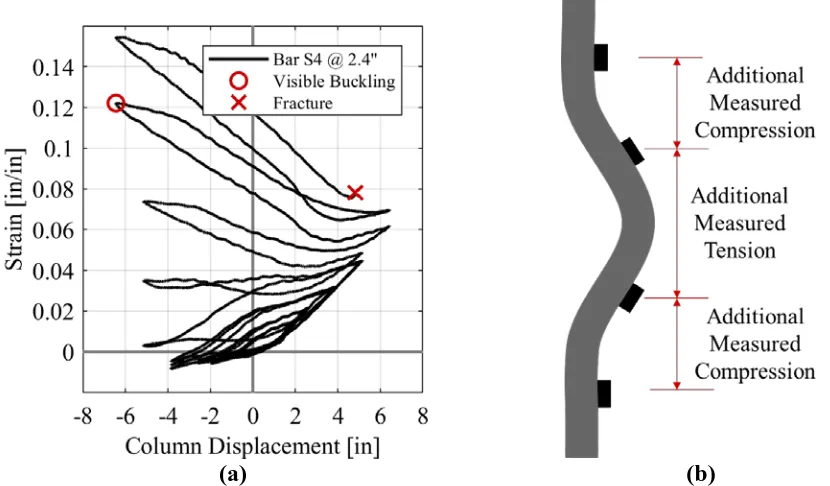
Figure 3.28 (a) Column Test 1 Bar S4 Strain vs. Displacement;(b) Bar Buckling Measurement with Optical Sensors, Adapted from Goodnight et al. (2015)... 49
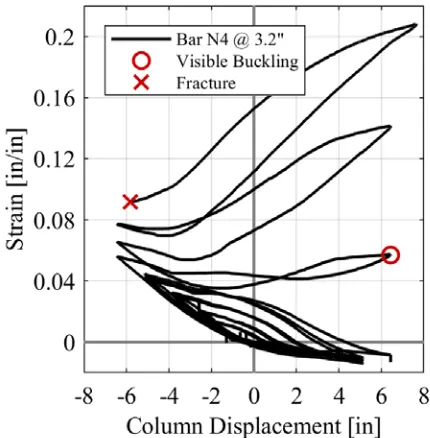
Figure 3.29 Column Test 1 Bar N4 Strain vs. Displacement ... 50
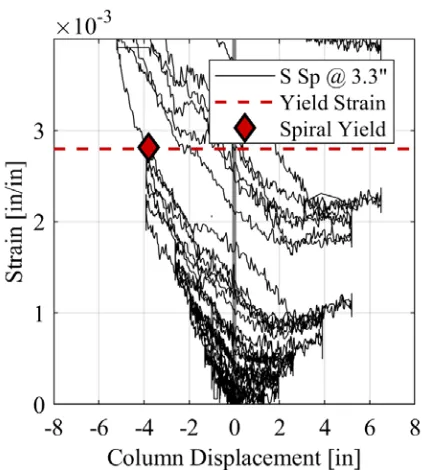
Figure 3.30 Example of Spiral Yield Determination ... 51
Figure 3.31 Bending Strain Calculation for Column Test 1 Bar N4 at µ53+... 53
Figure 3.32 Column Test 1 Bending Strain Histories ... 54
Figure 3.33 Column Test 1 Energy Dissipation ... 55
Figure 3.34 Calculation of Area-Based Damping ... 57
Figure 3.35 Column Test 1 Damping ... 58
Figure 3.36 Cross-Sectional Strain Profile ... 59
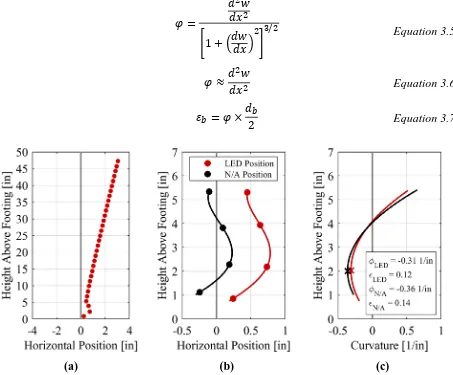
Figure 3.37 Example of Curvature Calculation Using Optical Sensor Data ... 59
Figure 3.38 Column Curvature Distribution Example ... 60
Figure 3.39 Column Test 1 Curvature Profiles for (a) Push Cycles; (b) Pull Cycles ... 61
Figure 3.40 Column Test 1 Strain Penetration for (a) Push Cycles; (b) Pull Cycles ... 62
Figure 3.41 Column Test 1 Components of Deformation for (a) Push Cycles; (b) Pull Cycles ... 62
Figure 3.43 Column Test 2 Force-Displacement Response ... 65
Figure 3.44 Column Test 2 Comparison of Experimental and Prediction Backbone Curves ... 66
Figure 3.45 Column Test 2 (a) South Face at +0.75𝐹𝐹𝐹𝐹′; (b) North Face at -0.75𝐹𝐹𝐹𝐹′ ... 68
Figure 3.46 Column Test 2 (a) South Face at +𝐹𝐹𝐹𝐹′; (b) North Face at -𝐹𝐹𝐹𝐹′ ... 68
Figure 3.47 Column Test 2 (a) Crushing on South Face at µ31 ; (b) Crushing on North Face at µ23+; ... 69
Figure 3.48 Column Test 2 (a) S4 Buckling at µ61-; (b) N4 Buckling at µ62+ ... 69
Figure 3.49 Column Test 2 (a) S4 Fracture at µ62+; (b) N4 Fracture at µ62- ... 70
Figure 3.50 Column Test 2 (a) South Face after Test;(b) North Face after Test ... 70
Figure 3.51 Column Test 2 (a) S4 Strain Profiles up to First Yield;(b) N4 Strain Profiles up to First Yield ... 71
Figure 3.52 Column Test 2 (a) S4 Strain Profiles;(b) N4 Strain Profiles ... 72
Figure 3.53 Column Test 2 South Spiral Strain Profile ... 73
Figure 3.54 Column Test 2 Bar S4 Strain vs. Displacement ... 74
Figure 3.55 Column Test 2 Bending Strain Histories ... 75
Figure 3.56 Column Test 2 Energy Dissipation ... 76
Figure 3.57 Column Test 2 Hysteretic Damping ... 77
Figure 3.58 Column Test 2 Curvature Profiles for (a) Push Cycles; (b) Pull Cycles ... 78
Figure 3.59 Column Test 2 Strain Penetration for (a) Push Cycles; (b) Pull Cycles ... 78
Figure 3.60 Column Test 2 Components of Deformation for (a) Push Cycles; (b) Pull Cycles ... 79
Figure 3.61 Column Test 3 Displacement History ... 81
Figure 3.62 Column Test 3 Force-Displacement Response ... 82
Figure 3.63 Column Test 3 Comparison of Experimental and Prediction Backbone Curves ... 83
Figure 3.64 Column Test 3 (a) South Face at +0.75𝐹𝐹𝐹𝐹′; (b) North Face at -0.75𝐹𝐹𝐹𝐹′ ... 84
Figure 3.65 Column Test 3 (a) South Face at µ13+; (b) North Face at µ13- ... 85
Figure 3.66 Column Test 3 (a) Crushing on South Face at µ1.53-; (b) Crushing on North Face at µ1.53+ ... 85
xi
Figure 3.68 Column Test 3 (a) S4 Fracture at µ51+;(b) N4 Fracture at µ51- ... 86
Figure 3.69 Column Test 3 (a) South Face after Test;(b) North Face after Test ... 87
Figure 3.70 Column Test 3 (a) S4 Strain Profiles up to First Yield;(b) N4 Strain Profiles up to First Yield ... 88
Figure 3.71 Column Test 3 (a) S4 Strain Profiles;(b) N4 Strain Profiles ... 89
Figure 3.72 Column Test 3 (a) South Spiral Strain Profiles; (b) North Spiral Strain Profiles ... 89
Figure 3.73 Column Test 3 Strain vs. Displacement for (a) Bar S4; (b) Bar N4 ... 90
Figure 3.74 Column Test 3 Bending Strain Histories ... 91
Figure 3.75 Column Test 3 Energy Dissipation ... 92
Figure 3.76 Column Test 3 Hysteretic Damping ... 93
Figure 3.77 Column Test 3 Curvature Profiles for (a) Push Cycles; (b) Pull Cycles ... 94
Figure 3.78 Column Test 3 Strain Penetration for (a) Push Cycles; (b) Pull Cycles ... 94
Figure 3.79 Column Test 3 Components of Deformation for (a) Push Cycles; (b) Pull Cycles ... 95
Figure 3.80 Column Test 4 Displacement History ... 97
Figure 3.81 Column Test 4 Force-Displacement Response ... 98
Figure 3.82 Column Test 4 Comparison of Experimental and Prediction Backbone Curves ... 99
Figure 3.83 Column Test 4 (a) South Face at +0.75𝐹𝐹𝐹𝐹′; (b) North Face at -0.75𝐹𝐹𝐹𝐹′ ... 101
Figure 3.84 Column Test 4 (a) South Face at µ11+; (b) North Face at µ11- ... 101
Figure 3.85 Column Test 4 (a) Crushing on South Face at µ21- (not initial) (b) Crushing on North Face at µ31-(not initial) ... 102
Figure 3.86 Column Test 4 (a) S4 Buckling at µ42-; (b) N4 Buckling at µ41+ ... 102
Figure 3.87 Column Test 4 (a) S4 Fracture at µ52+; (b) N4 Fracture at µ43- ... 103
Figure 3.88 Column Test 4 (a) South Face after Test;(b) North Face after Test ... 103
Figure 3.89 Column Test 4 (a) S4 Strain Profiles up to First Yield;(b) N4 Strain Profiles up to First Yield ... 104
Figure 3.90 Column Test 4 (a) S4 Strain Profiles;(b) N4 Strain Profiles ... 105
Figure 3.91 Column Test 4 (a) South Spiral Strain Profiles; (b) North Spiral Strain Profiles ... 105
Figure 3.93 Column Test 4 Bending Strain Histories ... 107
Figure 3.94 Column Test 4 Energy Dissipation ... 108
Figure 3.95 Column Test 4 Hysteretic Damping ... 109
Figure 3.96 Column Test 4 Curvature Profiles for (a) Push Cycles; (b) Pull Cycles ... 110
Figure 3.97 Column Test 4 Strain Penetration for (a) Push Cycles; (b) Pull Cycles ... 110
Figure 3.98 Column Test 4 Components of Deformation for (a) Push Cycles; (b) Pull Cycles ... 111
Figure 4.1 Hysteretic Response of Phase 2 Tests and Comparison Grade 60 Tests for (a) Column Test 1; (b) Column Test 2 ... 113
Figure 4.2 Hysteretic Response of Column Tests 1 and 2 with Comparison Grade 60 Tests ... 115
Figure 4.3 Hysteretic Response of Phase 2 Tests and Comparison Grade 60 Tests for (a) Column Test 3; (b) Column Test 4 ... 117
Figure 4.4 Hysteretic Response of Column Tests 3 and 4 with Comparison Grade 60 Tests ... 118
Figure 4.5 Overall Comparison of Backbone Responses ... 121
Figure 4.6 Difference between Experimental and Theoretical Strains Up to Yield for (a) Columns 1 and 2; (b) Columns 3 and 4 ... 122
Figure 4.7 Strain Profiles of Bar N4 for (a) Column Test 1; (b) Column Test 2; (c) Column Test 3; (d) Column Test 4 ... 123
Figure 4.8 Bending Strain Histories for (a) Phase 1 Columns; (b) Grade 60 Columns ... 127
Figure 4.9 Bending Strain Histories for Phase 2 Columns with (a) Mill 3 steel; (b) Mill 2 steel ... 128
Figure 4.10 Cumulative Energy Dissipation of Column Tests 1 & 2 with Comparison Grade 60 and Phase 1 Columns ... 130
Figure 4.11 Cumulative Energy Dissipation of Column Tests 3 & 4 with Comparison Grade 60 and Phase 1 Columns ... 130
Figure 4.12 Cumulative Energy Dissipation Comparisons for (a) Phase 1 Test 1; (b) Phase 1 Test 3 ... 131
Figure 4.13 Comparisons of Energy Dissipation between Buckling and Fracture ... 131
Figure 4.14 Comparison of Equivalent Viscous Damping ... 133
xiii Figure 4.16 Idealization of Curvature Distribution, Adapted from Priestley et al.
(2007) ... 135
Figure 4.17 Experimental Lp Values for (a) Phase 2 Columns; (b) Phase 1 Columns, Barcley et al. (2018) ... 136
Figure 4.18 Backbone Responses of Phase 2 Columns... 137
Figure 4.19 Experimental Difference from Predicted Force for Phase 2 Tests ... 138
Figure 5.1 (a) Column Test 1 Bar S4 Strain vs. Displacement (Gage 1);(b) Bar Buckling Measurement with Optical Sensors, adapted from Goodnight et al. 2015 ... 141
Figure 5.2 Column Test 1 Bar S4 Strain vs. Displacement (Gage 3) ... 142
Figure 5.3 Bending Strain History Example (Barcley and Kowalsky 2018) ... 143
Figure 5.4 Column Test 1 Backbone Response Comparisons ... 144
Figure 5.5 Comparison of Methods of Identifying Bar Buckling ... 146
Figure 5.6 Comparison of Drifts for Methods of Identifying Bar Buckling ... 147
Figure 6.1 Extent of Plasticity for a Column in Single Bending ... 150
Figure 6.2 Process for Determining Required T/Y Ratio for One Design ... 151
Figure 6.3 Idealization of Column Displacement for T/Y = 1.0 ... 152
Figure 6.4 Drift Capacity vs. Required T/Y Ratio for Designs of a Column in Single Bending ... 154
Figure 6.5 Cyclic Test Results ... 157
Figure 7.1 Strain vs. Displacement for Test 1 Fractured Bars ... 166
Figure 7.2 Strain vs. Displacement for Test 2 Fractured Bars ... 167
Figure 7.3 Strain vs. Displacement for Test 3 Fractured Bars ... 168
LIST OF SYMBOLS
Ag Gross cross sectional area of column Ast Area of longitudinal steel in column db Diameter of longitudinal bar
D Diameter of column
Es Elastic modulus of steel f'c Concrete compressive strength fy Yield stress of longitudinal steel fyh Yield stress of transverse steel Fy Force at nominal yield of column F'y Force at first yield of column L Height of column
Lc Clear length of the column Lp Equivalent plastic hinge length
Lp,exp Experimentally calculated equivalent plastic hinge length
Lsp Strain penetration length Mn Nominal moment of column M'y First yield moment of column
w(x) Position function fit to buckled bar shape
Δ'y Displacement at first yield of column Δy Displacement at nominal yield of column ΔF Displacement of column due to flexure ε Axial strain in steel
εb “Bending strain”, local compression strain due to buckled shape of longitudinal bar εy Yield strain of steel
µΔ Displacement ductility of column ξel Elastic damping
ξeq Equivalent viscous damping ξhyst Hysteretic damping
xv
ρl Longitudinal steel ratio (As/Ag)
ρt Transverse steel ratio ϕ Curvature of column
Chapter 1:
Introduction
1.1 Background
1.1.1 Current Use of Grade 80 Reinforcing Steel
In current design of reinforced concrete elements, the use of Grade 60 reinforcing steel is ubiquitous. However, steel manufacturers are now able to generate higher strength reinforcing steel, and Grade 80 was added to the ASTM A706 and A615 specifications in 2009. Despite the wide availability of Grade 80 reinforcement, engineers have yet to be able to implement it in seismic use due to building code restrictions. ACI 318-14, AASHTO LRFD Bridge Design Specification, and Caltrans Seismic Design Specification are some of the many codes that do not allow steel of higher nominal strength than Grade 60 for use in members that are expected to form plastic hinges, a key feature of modern seismic design.
The reason for these limitations, as laid out in the codes, is based on reasonable hesitation due to lack of research. For example, ACI 318-14 limits the use of reinforcing steel in special seismic systems to Grade 60 “because of insufficient data to confirm applicability of existing code provisions for structures using the higher grade.” The Caltrans Seismic Design Criteria states “Grade 80 bars are not to be used in seismic critical members (SCMs) until definitive data from ongoing research become available.”
The benefits of high strength reinforcing steel are evident: use of higher strength steel means that less material will be needed to achieve a given capacity. This in and of itself yields many advantages, including reduced congestion, faster construction time, less material
transportation, and smaller structural members. Generally speaking, cheaper and more efficient designs are possible with higher strength steel. Structures could also have overall smaller
amounts of reinforced concrete, which would provide architectural, monetary, and environmental benefits. Furthermore, in the case of transverse steel, high strength steel could improve
confinement.
The main concerns about the use of higher strength reinforcement all stem from the unknown. Grade 60 steel has been used in industry and research for decades, and its behavior is widely understood. A primary concern with higher strength steel is that as steel strength
2 This is particularly critical in seismic design, where members are expected to endure large
displacements without substantial loss of strength. Furthermore, much of modern seismic design is based on member displacement ductility capacity, which is defined as a member’s
displacement capacity divided by its yield displacement. If two similar members have the same displacement capacity but differ in strength of reinforcing steel, the column with higher strength steel will result in a higher yield displacement and, therefore, a lower displacement ductility capacity. This may cause engineers to be hesitant in using higher strength steel since it will inherently result in lesser displacement ductility capacity. However, displacement capacity and energy dissipation may be better indicators of a structure’s performance during a seismic event.
The potential benefits of Grade 80 reinforcing steel along with its current limitations and concerns of engineers lead to an apparent need for research. Although high strength steel clearly has advantages, governing bodies of codes must have evidence of suitable behavior before allowing it to be used for such a critical part of design as seismic capacity. Furthermore, current design guidelines have been based on experimental data for Grade 60 steel. These design standards must either be adjusted for Grade 80 reinforcement or proven appropriate for use in design with Grade 80 steel.
1.1.2 Use of Quench-and-Self-Tempered Steel
Figure 1.1 Microscopic View of TMT Reinforcing Bar (Paul et al. 2014)
The manufacturing process of QST steel also affects its material properties. One main concern is the lower ratio of ultimate tensile strength to yield strength (T/Y ratio) of QST steel. The T/Y ratio of micro-alloyed Grade 80 steel is typically between 1.28 and 1.36 (Overby et al. 2017). QST steel generally has a lower T/Y ratio than this, on the order of 1.15 (Slavin and Ghannoum 2015). This takes it out of qualification for the ASTM A706 specifications, which sets a minimum T/Y ratio of 1.25. However, there is no evidence that this value was based on experimental data or research. Standards of countries such as Japan have lower minimum values, including for seismic use, typically ranging from 1.15 to 1.20 (Madias et al. 2017; NEHRP Consultants Joint Venture 2014). Therefore, it is possible that a lower T/Y ratio provided by QST steel would be acceptable, but this needs to be widely studied and understood before making such claims. The value must be high enough to allow sufficient spread of plasticity and rotation in plastic hinges, but there has beeen very little research into a minimum acceptable value. A concentrated region of plasticity could also cause higher strain demands in plastic hinge regions.
Researchers have also investigated the cyclic behavior of QST steel and found differences between QST and micro-alloyed steel. The manufacturing process can cause
4 performance. However, other research found QST steel may have higher low-cycle fatigue life (Ghannoum and Slavin 2016). Due to these variances and the expansion of QST steel production, especially in the production of high-strength steel, its effects on seismic performance will be evaluated, both experimentally and analytically, in Chapter 6.
1.2 Experimental Program at North Carolina State University
This research is part of a broader experimental program funded by Caltrans at North Carolina State University (NCSU) investigating the seismic behavior of Grade 80 reinforcing steel. The program began with a study of the tensile behavior of ASTM A706 Grade 80 steel. Overby et al. (2017) performed approximately 800 tensile tests to determine expected values of various stress-strain parameters for A706 Grade 80 reinforcing steel. The tensile tests involved multiple mills and heats, and bar sizes ranged from No. 4 to No. 18. All of the steel was
manufactured using a micro-alloying process; the values from this study do not include QST steel. The results of this program were a series of expected parameters such as yield stress and strain at maximum stress.
The work done by Overby et al. (2017) was important to understanding the tensile behavior of A706-Grade 80 steel. However, the tensile properties do not necessarily explain the expected seismic behavior. In order to better understand the hysteretic behavior under applied seismic loads, Barcley and Kowalsky (2018) tested four reinforced concrete columns constructed with A706-80 steel. These columns were tested under quasi-static, unidirectional three-cycle sets to analyze their hysteretic behavior. These columns were compared to current design models and comparison Grade 60 columns tested under the same conditions.
The Grade 80 columns largely performed similarly to their counterpart Grade 60 columns. Hysteretic behavior, observed axial strains, and energy dissipation were comparable and matched well with current models. The report concluded, however, that the bars in the Grade 80 columns experienced fewer cycles after buckling and prior to fracture. This was an important distinction since buckling is an ultimate design limit state with the expectation that there is some remaining capacity after buckling and prior to bar fracture. Bar fracture, unlike bar buckling, results in a rapid and substantial loss in force capacity. If bar buckling were to occur at
Grade 80 columns were also slightly less than that of their comparison Grade 60 columns, and this was attributed to the post-buckling behavior.
The work done by Barcley and Kowalsky (2018) constitutes what will be referred to as “Phase 1” of the large-scale experimental portion of the research. Through the results of the column tests and the development of a new material test, it was concluded that the difference in post-buckling behavior was due to a property which will be referred to as “bending strain”, or the local strain induced on a bar due to buckling, as shown in Figure 1.2. A bar with a higher
bending strain capacity can be buckled to a more severe curvature without rupturing in a brittle manner upon tensile loading. The research found through material testing that the Grade 80 steel used in the Phase 1 columns had a lower bending strain capacity compared to steel similar to that used in the Grade 60 columns.
Figure 1.2 Strain Demand on Buckled Bar (Barcley and Kowalsky 2018)
The material tests, which will be described in more detail in Section 2.1.2, were performed on a variety of reinforcing steels, and two steel samples were identified as having a high bending strain capacity that was similar to that of the Grade 60 steel. One of these samples was supplied by Mill 3, which uses a QST manufacturing process. The other sample was
supplied by Mill 2, a micro-alloying mill, and its high bending strain capacity was attributed to a large radius of the transverse ribs.
6 the new batches of Grade 80 steel had higher bending strain capacities, the Phase 2 columns would be able to sustain more cycles between buckling and fracture, which would result in larger displacement capacities. These columns were constructed and tested, and results will be explored in the remainder of this paper.
1.3 Scope
The goal of this research is to evaluate the suitability of Grade 80 reinforcing steel for use in plastic hinges such that it can be utilized in seismic applications. As discussed previously, the tensile behavior of A706 Grade 80 steel has been established (Overby et al. 2017). Furthermore, members constructed with A706 Grade 80 steel were tested under cyclic loading, and it was determined that specific steel properties could become critical in high strength steel (Barcley and Kowalsky 2018). This research described in this paper consists of two main portions:
experimental cyclic testing of large-scale columns, including the use of QST steel; and an investigation into the potential differences in seismic performance caused by differing T/Y ratios.
1.3.1 Column Tests
Four large-scale circular reinforced concrete columns were tested in order to better understand the seismic performance of various Grade 80 steels. The columns were eight feet tall and two feet in diameter, with (16) #6 bars generating a longitudinal steel ratio of 1.6%. All columns had #3 A706-Grade 80 spirals supplied by Mill 1, a micro-alloying mill, as transverse steel; two columns had spirals spaced at 1.5" (ρt = 1.3%), and two columns had spirals spaced at 2" (ρt = 1.0%).
material properties on column performance, and to better understand the behavior of Grade 80 steel as a whole.
1.3.2 Investigation of T/Y Ratio Effects
QST steel has many advantages, and QST column test results from this research were promising. However, one of the results of its manufacturing process is a lower T/Y ratio than micro-alloyed steel. Although there is a minimum T/Y ratio of 1.25 in the ASTM A706 standard, it is not known if 1.25 is necessary or if some lower value is acceptable. A higher T/Y ratio is generally favorable because it allows a larger spread of plasticity such that strain demands are lower in plastic hinge regions. If the extent of plasticity is reduced, it may lower rotation capacity of the member. While there have been a few experiments which provide scattered data points of performance of members built with varying T/Y ratios, the potential impact must be understood analytically in conjunction with looking at experimental data such that its effects can be fully recognized.
1.4 Overview of Document Contents
Chapter 1 of this document contains background on the research discussed in this paper. It also explains the motivation and scope of the research project.
Chapter 2 consists of a literature review that summarizes previous research relevant to this project. This involves a more in-depth discussion of the previous stages of this experimental program (Barcley and Kowalsky 2018; Overby et al. 2017). There is also discussion of other published research into seismic use of Grade 80 reinforcing steel. This chapter also summarizes research about QST reinforcing steel, its properties, and its use in seismic applications. Lastly, there is summary of research involving the impact of the T/Y ratio, since this is a major difference between QST steel and micro-alloyed steel and has yet to be fully explored.
Chapter 3 contains a summary of the Phase 2 column tests constructed and tested throughout this research. This chapter begins with a description of the column tests, the
8 Chapter 4 compares the results of the Phase 2 column tests (as described in Chapter 3) with one other, the Phase 1 Grade 80 columns, and comparison Grade 60 columns. The only variable altered between all compared Grade 80 columns was the reinforcing steel used. Thus, the impact of the reinforcing steel properties and manufacturing process on actual member performance can be evaluated. Previous research supplied a database of thirty circular reinforced concrete columns constructed with A706-Grade 60 steel (Goodnight et al. 2015). This provided comparison columns for the Grade 80 tests, some of which had matched steel content (and therefore lower strength than the Grade 80 columns), and some of which had more steel to provide roughly the same nominal capacity as the Grade 80 columns. In order to use Grade 80 steel, its comparison to Grade 60 performance and models must be fully understood. This chapter also explores the results of the hypothesis proposed by Barcley and Kowalsky (2018) and its manifestation in the column test results.
Chapter 5 discusses the definition of the onset of bar buckling, which came up through the course of this research. The onset of bar buckling is generally defined by the observer, which introduces bias and uncertainty into its identification. Several methods are discussed for
quantitatively defining the onset of bar buckling such that the limit state can be refined. Chapter 6 consists of a discussion of the impact of T/Y ratio on column performance. This study was begun due to the growing production of QST steel and its potential benefits. QST steel typically has a lower T/Y ratio than micro-alloyed steel, and also lower than the ASTM A706 minimum requirement of 1.25. However, the impact of a lower T/Y ratio has not been fully evaluated to the authors’ knowledge. This chapter explores whether or not the ASTM A706 limit is necessary and if a lower limit can be determined.
Chapter 2:
Literature Review
2.1 Grade 80 Reinforcing Steel
The use of high strength steel in reinforced concrete columns was first investigated in 1934 in a series of large-scale column tests (Richart and Brown 1934). Columns with
longitudinal steel of yield strengths up to approximately 96 ksi were used in construction of columns, and the researchers concluded that the high-strength reinforcing steel used in the tests was “fully effective in producing column strength” compared to columns constructed with typical steel. While the benefits of high-strength steel have been acknowledged for a substantial period of time, and its use is permitted in members expected to behave elastically, governing codes have not yet allowed high strength steel for use in plastic hinge regions. As previously mentioned, this is due to a lack of experimental data establishing its performance under seismic loading.
Recent research has begun to provide data for such loading conditions and will be described in the following section. Most research has found similar or slightly diminished capacities of columns constructed Grade 80 reinforcing steel compared to Grade 60 reinforcing steel. However, the ultimate displacement capacities found have been acceptable, generally reaching at least 4% drift at failure. This may be a matter to be considered in the use of high strength steel; if performance is slightly diminished from that of Grade 60 steel, but still
considered acceptable, engineers and codes may be hesitant to utilize higher strength steel unless advantages are substantial or use becomes commonplace.
2.1.1 Overby, Kowalsky, and Seracino (2017)
10 protected members can have higher moment demands than otherwise expected. Thus, it is
important to establish the expected stress-strain behavior of A706-Grade 80 steel and understand its inelastic behavior. The stress-strain behavior must also be understood to determine if current steel models for Grade 60 steel are still applicable to Grade 80 steel, and to understand if there are any major concerns in material properties that may cause unexpected performance.
Furthermore, parameters such as yield stress and ultimate tensile strain must be able to be relatively accurate for design models.
Overby et al. (2017) performed 788 tensile tests on ASTM A706 Grade 80 reinforcing steel, with bar sizes ranging from No. 4 through No. 18 (approximate metric No. 13 through No. 57). The data set included three different mills, with three heats from each mill, and three
samples were taken from three different bars of the same size from each heat. This created a thorough dataset from which statistically defendable recommendations on stress-strain
parameters could be made. This body of work was the first stage of the Caltrans-funded research project at NCSU investigating the use of A706 Grade 80 steel for plastic hinge forming
members.
Strain values were calculated using the Optotrak Certus HD system (manufactured by Northern Digitial, Inc.), an optical position sensor system that allowed strains to be calculated through bar fracture, even in large bars such as No. 18 bars which would damage typical extensometers upon rupture. The system reported three-dimensional position data of LED sensors and was accurate to 0.1 mm according to the manufacturer. Using this data, the strain was calculated by dividing the change in distance between two LED sensors on a specimen by the original distance between the two LED sensors. In the tension tests, seven LED sensors were spaced 2 inches apart, which simultaneously created six 2-inch gage lengths and three 8-inch gage lengths. The strain values for all gage lengths were very similar and were also found to be similar to typical extensometer data. The reported strain values used for each tension test ultimately came from the average of all six 2-inch gage lengths on the bar.
The paper created recommended values for seven key stress-strain parameters: modulus of elasticity, yield strength, yield strain, strain at onset of strain hardening, tensile strength, ultimate tensile strain, and T/Y ratio. Most of these were based on the mean values found for the parameters, and the results and recommendations are summarized in Table 2.1. The yield
“top-of-knee”. The paper also calculated this parameter based on the Extension Under Load Method using a strain of 0.0035 and the 0.2% Offset Method. Very little difference was found between the three methods, and the top-of-knee method was used for creating the recommended values. Many of the values found in Table 2.1 were incorporated into the 2018 version of the Caltrans Seismic Design Guidelines (Caltrans 2018).
Table 2.1 A706 Grade 80 Tensile Testing Results and Design Parameter Recommendations (Overby et al. 2017)
Mean St. Dev. COV 95
th
Percentile
5th
Percentile Recommendation
Modulus of
Elasticity [ksi] 27,888 1601 5.74% 30,322 25,111 28,000
Yield Strength [ksi] 85.0 3.03 3.56% 89.2 79.0 85.0
Yield Strain 0.0033 0.0003 9.03% 0.0038 0.0029 0.0033
Strain at Onset of
Strain Hardening 0.0074 0.0019 26.17% 0.0109 0.0048 0.0074
Tensile Strength
[ksi] 112.5 3.65 3.24% 118.9 106.4 112.5
Ultimate Tensile
Strain 0.0954 0.0055 5.80% 0.1024 0.0845 0.0954
Tensile-to-Yield
Ratio 1.32 0.03 2.19% 1.36 1.28 1.32
Overby et al. (2017) also analyzed the variability in the data. There were no consistent trends across mills in terms of variability or tendency towards extreme values. Overall, the length of the yield plateau had the highest variability. This was expected as it was seen in past research due to its sensitivity to many factors related to the manufacturing process and chemical
composition. Bar sizes No. 11, 14 and 18 had overall lower yield and tensile strength than No. 4 through No.10, but no other parameters had observable trends based on bar size.
The shape of the stress-strain curve for A706 Grade 80 steel was also analyzed, and the existing Raynor model was found to be a good fit. The shape was also nearly identical to the A706 grade 60 curve and fit well with existing grade 80 models. Therefore, the paper concluded that no new model was necessary for A706 Grade 80 steel.
12 These tests were subjected to three separate pre-strain levels and five aging periods, and another subset was also subjected to sub-freezing temperatures. No observable trend was observed for decrease in ultimate tensile strain or increase in tensile strength after the aging periods, which would have indicated strain aging. The low temperature tests also did not have any observable effect from strain aging. Therefore it was concluded that there was not an increased susceptibility of strain aging in A706 Grade 80 reinforcement.
The experimental work and outcomes of this paper increased the body of publicly accessible A706 Grade 80 stress-strain data by over 650%. It was found that existing models were sufficient for modeling the stress-strain behavior of A706 Grade 80 reinforcement.
Furthermore, recommended values based on statistically defendable data analysis were provided. Many of these parameters were used in modeling for the current phase of this project. However, it should be noted that this set of data did not include any QST steel as it is generally not
classified as A706. If it is found that this type of steel in high strength is useful for seismic design, it may be necessary to confirm that it adheres to the existing models, or establish its stress-strain parameters separately.
2.1.2 Barcley and Kowalsky (2018)
The research in this report began with consideration of the findings of Barcley and Kowalsky (2018), and so their work will be discussed thoroughly. After the tensile tests done by Overby et al. (2017) to establish stress-strain parameters of A706 Grade 80 steel, the next stage of the research project was the large-scale column test program. These began with Phase 1 column tests, which were conducted and analyzed in Barcley and Kowalsky (2018). The test matrix and details of these columns are shown in Table 2.2.
Table 2.2 “Phase 1” Test Matrix of Barcley and Kowalsky (2018) Column
Number Diameter L/D Longitudinal Steel
Transverse Steel (Spirals)
Axial Load Ratio
1 24" 4 16 #6 (1.6%) #3 @ 2" (1.0%) 5%
2 24" 4 16 #6 (1.6%) #3 @ 2" (1.0%) 10%
3 24" 4 16 #6 (1.6%) #3 @ 2.75" (0.7%) 5%
4 24" 4 16 #6 (1.6%) #3 @ 1.5" (1.3%) 5%
steel. However, through the course of their research, a material test was developed which the authors hypothesized would predict certain aspects of column performance. One objective of the current research was to test the hypothesis of the material tests as described by Barcley and Kowalsky (2018).
The first portion of the report looked at the fundamental results and limit states of four columns constructed with A706 Grade 80 steel. These columns each had Grade 60 comparison columns from the tests done by Goodnight et al. (2015), some with matched detailing and some with matched strength capacity, to which they were compared. The columns were also compared to current design models to determine if adjustments needed to be made for designing with A706 Grade 80 steel.
The columns were found to perform similarly to Grade 60 columns in almost all regards. The plastic hinge lengths were found to be comparable to current models and previous Grade 60 columns. Bond slip, which some researchers have suggested may be higher for Grade 80
columns (Restrepo et al. 2006; Sokoli and Ghannoum 2016) was broadly similar to that of the comparison Grade 60 columns, although slightly greater at high levels of displacement. Bar buckling and the level at which there was significant core damage occurred at a similar level of displacement for Grade 60 and Grade 80 columns. Equivalent viscous damping, which can be a proxy for measuring energy dissipation capacity, was found to be nearly identical between Grade 60 and Grade 80 columns. The authors concluded that current models and design parameters were applicable for A706 Grade 80 steel.
The main difference between the Grade 60 and 80 columns was a slightly lower displacement capacity of the Grade 80 columns. It was noticed that although the comparison columns buckled at similar levels of displacement, the Grade 80 columns experienced fewer cycles after buckling prior to bar fracture. Bar fracture typically represents the point at which a large loss in lateral strength capacity occurs. The most severe limit state that is generally
14 diminished factor of safety against post-buckling fracture creates concern for replacing Grade 60 reinforcement with Grade 80 steel.
In order to characterize the state of strain of the buckled bars in the columns tests, Barcley and Kowalsky (2018) developed a procedure called the “Buckled Bar Tension Test” (“BBT Test”). This test involved simulating the loading conditions of a buckled longitudinal bar by applying a single compressive and tensile load on a reinforcing steel specimen in an MTS machine. Bars were subjected in compression to a prescribed level of curvature due to buckling, and subsequently pulled in tension until fracture. Two distinct failure surfaces were observed: ductile failures, which were characterized by large amounts of elongation similar to a typical tensile test, and brittle failures, in which the bars ruptured under smaller strains and had flat failure surfaces across the shaft of the bar.
This test was repeated for the same heat of steel under varying levels of curvature due to buckling, and a distinct point was found that demarcated ductile from brittle failures. This
distinct point, measured as a “bending strain” as shown in Figure 1.2 and calculated using optical markers and a fourth-order polynomial as described in Section 3.2.3, was identified as the
“critical bending strain” for a heat of steel. This process became the BBT Test, and was conducted for the steel used in the Grade 80 columns and for steel similar to that used in the Grade 60 columns. The critical bending strains were identified as 0.10 and 0.14 for the Grade 80 steel and Grade 60 steel, respectively, and results are shown in Figure 2.1.
Bending strains were also calculated for longitudinal bars in the column that underwent buckling and subsequent fracture. Bending strain histories for individual bars throughout a column test are shown in Figure 2.2, where the history for one bar is shown vertically. The red ‘x’ points represent the highest strain from bending measured prior to bar fracture. The Grade 60 columns appear to have sustained larger values of bending strain prior to bar fracture compared to the Grade 80 columns, and the largest sustained value of bending strain without subsequent fracture was noted as approximately 0.10 for the Grade 80 columns and 0.14 for the Grade 60 columns.
Figure 2.2 Comparison of Strain Histories and Critical Strains for Grade 80 and Grade 60 Column Tests (Barcley and Kowalsky 2018)
Due to the correlation between the BBT Test results and the column test results, the authors concluded that the displacement capacity of the Grade 80 columns was lower than the Grade 60 comparison columns due to a lower critical bending strain of the Grade 80 steel, as this would affect performance after buckling. The authors hypothesized that if the critical bending strain of steel were increased, the displacement capacity of a column would also increase. It should also be noted that this type of phenomenon was first noticed by Restrepo-Posada (1993), who hypothesized that there was a “critical buckle” which would cause cracks formed during the buckling mechanism to propagate under subsequent tension, leading to “premature failure”.
16 first was a steel that was manufactured by “Mill 2”, and found to have a critical bending strain of approximately 0.16 as shown in Figure 2.3.
Figure 2.3 BBT Results for Mill 2 Grade 80 (Barcley and Kowalsky 2018)
The high bending strain capacity of this steel was attributed to the geometry of its ribs (also known as deformations or lugs), which was characterized by a large rib radius. This is evident when examining the bar cross-section as shown in Figure 2.4. Previous research has shown that rib radius drastically affects the stress concentrations at the base of the rib and can cause cracks to propagate at this location (Ghannoum and Slavin 2016; Helgason et al. 1976; Zheng and Abel 1998). Under cyclic loading including buckling, these stress concentrations may become critical, causing cracks to form prematurely and propagate upon subsequent tension.
(a) (b)
Figure 2.4 (a) Mill 1 bar profile; (b) Mill 2 bar profile (Barcley and Kowalsky 2018)
As seen in the figure, the QST steel did not demonstrate a steep drop-off in elongation at fracture as the various micro-alloyed steels did, but instead had a slow deterioration in elongation under tensile load with increase in buckling-induced bending strain. While the performance starts to diminish around a strain of 0.12, the bar still experiences some amount of elongation under tension until a bending strain of approximately 0.26. It was unknown how exactly this would behavior would be manifested in column tests, but the increased bending strain capacity was hypothesized to correspond to improve column performance.
Figure 2.5 BBT Results for Mill 3 Grade 80 (QST)
The findings of Barcley and Kowalsky (2018) were the basis for the research presented in this report. The two batches of steel mentioned, from Mill 2 and Mill 3, were chosen to construct four new columns. This was done in order to test the hypothesis made in the report and see if columns constructed with Grade 80 steel could be improved. Furthermore, the new columns expanded the current database of large-scale structural members constructed with Grade 80 reinforcement, and allowed for better understanding of Grade 80 reinforcing steel.
2.1.3 Restrepo, Seible, Stephan, and Schoettler (2006)
high-18 strength steel had lower post-cracking stiffness. The columns constructed with high-strength steel had an ultimate drift capacity of at least 3.9% (Restrepo et al. 2006).
One major discrepancy found by Restrepo et al. (2006) was a substantial underestimation of equivalent plastic hinge lengths using equations developed by Priestley et al. (1996). The experimental values that were calculated exceeded the calculated equivalent plastic hinge lengths by at least 40%. This resulted in higher displacements than predicted. This was partially
attributed to larger values of strain penetration than the predicted value, and partially due to an underestimation of the extent of plasticity. The authors remark that if the current equations are used without modification for high strength steel, a greater displacement than expected may occur.
2.1.4 Rautenberg, Pujol, Tavallali, and Lepage (2013)
Rautenberg et al. (2013) performed experiments on columns constructed with Grades 80 and 120 reinforcing steel and compared performance, primarily drift capacity, to that of columns constructed with Grade 60 steel. The columns had similar flexural capacity, and the amount of steel used in the columns were inversely proportional to the increase in yield strength of the steel; i.e. the column constructed with Grade 60 steel contained twice as much steel as that constructed with Grade 120 steel. The columns were loaded under cyclic displacements in terms of drift ratios.
The authors found that all columns retained their integrity until drift ratios of at least 4% and up to 8% (Rautenberg et al. 2013), which would generally be considered acceptable in current practice. However, the drift capacities of the columns constructed with high-strength steel were lower than their comparison Grade 60 columns, and the decrease in drift capacity ranged from 10 to 50%.
experience higher drift ratios under seismic loading if constructed with high-strength reinforcing steel than similar columns constructed with typical Grade 60 steel.
2.1.5 Barbosa, Link, and Trejo (2016)
This research involved the testing of paired columns constructed with Grade 60 and Grade 80 steel with aspect ratios (height divided by diameter) of three and six. The main objectives of the experiments were to evaluate the effects of reinforcing steel yield strength and column aspect ratio on column performance. The columns were loaded in terms of drift in three-cycle sets (Barbosa et al. 2016).
All columns exhibited a typical flexural failure, with damage occurring at the base of the column and extreme fiber longitudinal bars experiencing buckling and subsequent fracture. Overall, all columns exhibited similar ultimate drift ratios, and displacement ductility values were greater than four for all columns. The Grade 60 columns experienced more energy dissipation (due to slightly “fatter” hysteretic loops), especially after yield and prior to column failure. However, the authors point out that this is primarily a function of the amount of longitudinal steel rather than the grade of steel itself. The Grade 60 columns also had larger curvature ductility values. Grade 80 columns exhibited lower overstrength factors than the Grade 60 columns. However, the authors found that the AASHTO-recommended overstrength factor of 1.2 was still reasonable for the Grade 80 columns and overly-conservative for Grade 60 columns (Barbosa et al. 2016).
2.2 Quench-and-Self-Tempered Reinforcing Steel
20 compressive residual stresses were found on the surface and subsurface of QST bars, as well as surface imperfections. These may affect performance of reinforcing bars under loading. The highest stress concentrations were found at the transition from the rib to shaft on the bars, and were mainly impacted by the rib radius and height. A larger rib radius and smaller height resulted in a smaller stress concentration factor (Rocha et al. 2016).
Researchers have found contradictory evidence regarding the fatigue performance of QST steel. Paul et al. (2014) examined the high and low-cycle fatigue performance of QST steel and compared it to that of micro-alloyed steel. The researchers found that QST steel had lower fatigue lives, both low-cycle and high-cycle, than counterpart micro-alloyed steel. However, with increasing strain amplitudes, they found that the fatigue lives became similar. These high strain amplitudes are likely more representative of extreme seismically-induced demands, which can include large displacements and strains. The reason given for the larger fatigue life of the micro-alloyed steel was a higher uniform elongation and higher T/Y ratio. Similar to other fatigue research, they found that the cracks initiated at the base of the rib and then propagated through the cross-section. Other research, however, found that reinforcing bars produced with the QST process exhibited larger low-cycle fatigue life, by approximately 19 percent, compared to micro-alloyed bars (Ghannoum and Slavin 2016). However, they concluded that this difference was statistically insignificant. It is possible that the fatigue lives are similar enough between micro-alloyed and QST steel that different experiments will find one slightly larger than the other simply due to data variations.
2.3 Tensile-to-Yield Ratio
While the T/Y ratio is mentioned in literature, no full examination of its impacts
ensures the realization of the assumed failure mechanism. Several related benefits are also mentioned by NEHRP Consultants Joint Venture (2014), including maintaining section strength after cover spalling, increasing plastic hinge lengths, potentially increased ductility, and
controlling the relative strength of members such as beams and columns in a moment frame. Madias et al. (2017) summarized some of the various standards around the world and their requirements. A minimum T/Y ratio of 1.25 is the highest among global standards, whereas the Australia and New Zealand code establishes a minimum of 1.15 for seismic grades. Other literature has also noted the lower requirements on T/Y ratio of other global standards. The Japanese code specifies a yield strength to ultimate tensile strength ratio of 0.85 (JIS 2010), and when reciprocated, results in a T/Y ratio of 1.176 (or rounded, 1.18). (NEHRP Consultants Joint Venture 2014) suggested that a minimum ratio of 1.25 may be too costly and not achievable for Grade 100 steel “based on the Japanese experience”, and proposed a value of 1.18 to be more realistic. Citing this recommendation, Wiss, Janney, Elstner, and Associates Inc. (2015)
suggested that a minimum T/Y ratio of 1.17 (a truncated value of 1.176) be used for Grade 100 steel. Interpolation between a T/Y ratio of 1.25 for Grade 60 and the recommended 1.17 for Grade 100 led to a recommended value of 1.21 for Grade 80. While these recommendations were made for practicality and based on the experience of other countries, they did not include
supporting analytical or experimental data.
22 the two values. Nonetheless, it is reasonable to conclude that a value of 1.11 was insufficient for the members tested in the New RC Project.
(a) (b)
Figure 2.6 Force-Displacement Response for Beams with (a) Yield Ratio of 0.90 (T/Y = 1.11); (b) Yield Ratio of 0.75 (T/Y = 1.33) in the Japan New RC Project (NEHRP Consultants Joint
Chapter 3:
Column Tests
3.1 Experimental Setup
3.1.1 Summary of Tests
The experimental program consisted of four large-scale column tests as part of “Phase 2” of a broader research program at NCSU. Each column test was subjected to a quasi-static, unidirectional three-cycle set loading which will be described in more detail in Section 3.1.2. The columns were constructed with reinforcing steel from Mill 2 and Mill 3 in order to
determine the validity of the material tests described in Section 2.1.2 and compare performance to previously tested Grade 60 columns. Two different sets of detailing were used, each of which were built with both types of reinforcing steel. The detailing varied transverse steel content and axial load ratio. The column test matrix is seen in Table 3.1.
Table 3.1 Phase 2 Test Matrix Column
Number
Mill
ID Diameter L/D
Longitudinal Steel Transverse Steel (Spirals) Axial Load Ratio 1 3 24" 4 16 #6 (1.6%) #3 @ 1.5" (1.3%) 5% 2 2 24" 4 16 #6 (1.6%) #3 @ 1.5" (1.3%) 5%
3 3 24" 4 16 #6 (1.6%) #3 @ 2" (1%) 10%
4 2 24" 4 16 #6 (1.6%) #3 @ 2" (1%) 10%
3.1.2 Test Specimen and Setup
The specimens were built with detailing to match previously tested columns as described in Section 2.1.2. All specimens had a height of 8 feet and a diameter of 24", resulting in an aspect ratio of 4. The footing and loading stub were both designed as capacity protected members, and all reinforcing steel for the footing and cap beam was A615 Grade 60.
24
Figure 3.1 Specimen Reinforcement Configuration
Figure 3.2 Plan View of Footing Reinforcement Configuration
spreader beam atop a neoprene pad, which were connected with Dywidag bars through the strong floor. The jacks were connected with hoses to a third jack in an MTS Tensile Testing Machine. This closed loop, controlled by the MTS Machine, allowed the axial load to remain constant throughout the test within approximately 2% of the target axial load. A ¼" layer of gypsum cement was cast between the footing and the strong floor to ensure a fixed connection at the specimen base. The footing was then secured to the strong floor using four 1-3/8" post-tensioning bars with approximately 100 kips in each bar. The conceptual setup is shown in Figure 3.3, and a photo of the actual setup is shown in Figure 3.4. Nomenclature for longitudinal bars is shown in Figure 3.5; the direction of push cycles corresponded to the “North” side of the specimen and the direction of pull cycles corresponded to the “South” side of the column. This nomenclature was consistent throughout all four tests.
26
Figure 3.4 Actual Test Setup
3.1.3 Load Protocol
The chosen load protocol for the four columns was selected considering the intended outcomes of the experiments: to test the seismic performance of the columns and to compare with previously tested Grade 60 and Grade 80 columns. Similarly to previously tested columns, the Phase 2 columns were subjected to a three-cycle set loading history based on displacement ductility.
First, the columns were subjected to single positive and negative cycles of 0.25𝐹𝐹𝑦𝑦′, 0.5𝐹𝐹𝑦𝑦′, 0.75𝐹𝐹𝑦𝑦′, and 𝐹𝐹𝑦𝑦′, where 𝐹𝐹𝑦𝑦′ was the theoretical force at which the longitudinal steel first yielded. The displacements at the positive and negative cycle at 𝐹𝐹𝑦𝑦′ were averaged and taken as the experimental first yield displacement, ∆𝑦𝑦′. The equivalent yield displacement, ∆𝑦𝑦, was then calculated using the analytical ratio of nominal to first yield moments as shown in Equation 3.1. Multiples of this equivalent yield displacement were then used to define displacement ductility levels, 𝜇𝜇∆, of 1, 1.5, 2, 3, 4, 5, and 6, as shown in Equation 3.2. The column was subjected to three positive and negative cycles at each ductility level. For ease of reference, this report will use a shorthand notation for referencing specific cycles in each test, where µ42- signifies the second pull cycle at a displacement ductility level of 4. The tests were stopped after at least two longitudinal bars ruptured on each side of the column. The completed tests, with between five and seven fractured bars, resulted in losses in lateral strength capacity between 19 and 53%. An example of the load protocol is shown in Figure 3.6.
∆𝑦𝑦= �𝑀𝑀𝑀𝑀𝑛𝑛 𝑦𝑦′� ∆𝑦𝑦
′
Equation 3.1
𝜇𝜇∆= ∆∆
28
Figure 3.6 Load Protocol Example
3.1.4 Specimen Construction
All specimen construction was completed at the Constructed Facilities Laboratory at NCSU. The first stage involved tying the spirals to the longitudinal bars. Custom plywood formwork was created to ensure accurate placement of longitudinal bars, and a crane was used to hold the cage in place while tying the spiral. Wood spacers and clamps were used to ensure the spiral spacing was consistent and accurate. The ends of the longitudinal bars had a 90degree bend to ensure adequate development of the bars. The tails closest to the extreme fibers were turned towards the center of the column to enhance shear capacity of the joint, while the
(a) (b)
Figure 3.7 (a) Column Cage Construction; (b) Tails of Longitudinal Bars
30
Figure 3.8 Joint Reinforcement Construction
(a) (b)
Figure 3.9 (a) Footing Reinforcement; (b) Completed Footing Construction
the width of the spiral diameter and equal in height to the clear distance between spirals were cut and wrapped with tape to prevent concrete bonding. These strips were tied between the spirals in the bottom 48 inches of the column as shown in Figure 3.10(a). This section of the column was then wrapped with a foam sheet in order to accommodate the remaining portion of cover, as shown in Figure 3.10(b).
(a) (b)
Figure 3.10 (a) Cover Block-Out Strips; (b) Cover Block-Out Foam Sheet
A concrete tube form was then placed over the column cage. Wooden support framework was constructed atop the footing to support the cap beam formwork. The cap beam steel and PVC pipes that provided blocked-out holes for actuator connection points were then placed in the cap beam formwork. Cap beam and column formwork is shown in Figure 3.11(a). Ratchet straps around the cap beam formwork were included as additional protection against bowing or
32
(a) (b)
Figure 3.11 (a) Column and Cap Beam Formwork; (b) Column and Cap Beam Casting;
(a) (b)
Figure 3.12 (a) Removal of Foam Strips; (b) Final Instrumented Specimen
3.1.5 Instrumentation
Lateral displacement of the column was measured using two string potentiometers. Both potentiometers were located at mid-height of the loading stub to capture the measurement at the center of the applied load. The main potentiometer was located at the center of the cap beam, and another was located at the edge of the cap beam to measure any twisting that occurred from asymmetric or angled loading. Lateral force was measured by the actuator load cell.
The Optotrak Certus HD system manufactured by Northern Digital, Inc. was used to track approximately 400 infrared target LED markers that were placed on exposed reinforcement on the lower half of the specimen. Cameras were set up in a triangular manner around the