Joseph P. Roise).
The goal of this research study was to develop a mathematical model for enhancing forest
carbon management and to develop a novel algorithm for performing individual tree detection from UAV-derived Canopy Height Model as a first step towards the future of carbon mapping via UAVs. In the first chapter, a tradeoff between Net Present Value (NPV)
of timber resources, and carbon sequestration is analyzed in detail and Multiple Objective optimization is used to determine the production possibility curves showing the relationship
between NPV and Carbon. The analysis results revealed that NPV opportunity cost associated with increasing carbon sequestration at Hofmann Forest is less than the current California carbon market price. In the second chapter, advancements of remote sensing
technologies for monitoring forest attributes is evaluated. A simplified framework for automated tree detection from UAV-derived imagery based on modified local maxima
algorithm is presented. Among the 367 reference trees used for this study, 358 trees were detected correctly with an overall F-score of 0.86. In total, the algorithm missed 55 trees, and
falsely detected 46 trees meaning under detection was higher than over detection. Based on
our final results, it can be stated that local maxima algorithm combination is capable of derived tree counts with satisfactory accuracy and has the potential to supplement future
by Midhun Mohan
A thesis submitted to the Graduate Faculty of North Carolina State University
in partial fulfillment of the requirements for the degree of
Master of Science
Operations Research
Raleigh, North Carolina
2016
APPROVED BY:
_______________________________ _______________________________ Dr. Glenn P. Catts Dr. Michael Kay
_____________________________ Dr. Joseph P. Roise
DEDICATION
To everyone who believed in me and to everyone who helped me realize my potential,
Without their constant encouragement, advice, and all-round support, I would not be where I am today!
Thanks for making me understand it is okay to dream big and remain a risk-taker, I really
BIOGRAPHY
Midhun Mohan a.k.a Mikey was born June 22, 1992 in Palakkad, Kerala, India. After
finishing schooling from Amrita Vidyalayam, he started his undergraduate studies in mechanical engineering at Amrita University, India. Later, in his senior year he moved to California after getting selected for UC Davis Global Study Program. This marked the
beginning of his research career and his love for Mathematics and Environment made him choose a graduate research career in Operations Research (OR) at NC State after his
graduation.
Mikey started his research on optimization from the start of his first semester at NC State in August 2014 and under Dr. Joseph’s Roise guidance, he was able to make a smooth
transition to Environmental Science related OR problems. His initial research revolved
around multi-objective mathematical modeling of Forest Carbon. While progressing on with his OR research, the author was exposed to various spatial modeling strategies by Dr. Glenn Catts, and Mikey realized his unfair advantage over application of GIS skills and decided to
start a graduate certificate degree in the same. Also, soon enough with his mentors’
encouragement and support Mikey had developed the necessary analytical and GIS skills
required to approach real-world issues. During his third semester he started his independent research on Habitat modeling of Red-cockaded woodpecker and also got enrolled for a parallel Master’s degree in Forestry. The author currently resides in Raleigh, NC and works
ACKNOWLEDGMENTS
I am indebted to the NCSU Departments of Operations Research, Forestry and Geospatial
Analytics for the support I have received during my dual degree graduate research career.
Special thanks to Dr. Joseph Roise for believing in me and for helping me develop an
analytical mindset, Dr. Glenn Catts for always being there as a support, a guide and a friend, and Dr. Michael Kay for his professional and personal support throughout this endeavor.
I would like to especially thank the people who have been with me through the good and bad times… my family: Mohan T, Pushpa M & Sneha Narasimhan. Thanks for always helping
me get up when I fell and for teaching me to carry my own sunshine wherever I go. My special thank-you(s) goes to Carlos Silva for putting trust on me and encouraging me to
work on multiple publications over the past few months
when things were uncertain, Kevin Harnish for serving as a backbone during my initial research career and Travis Howell for being that wonderful awesome dude who introduced
me to the magical world of drones. Thanks also to everyone else who helped along the way: Dr. James McCarter, Dr. Stacy Nelson, Sarah Slover, Dr. Stacy Supak, Jean Chung,
TABLE OF CONTENTS
LIST OF TABLES ... vi
LIST OF FIGURES ... vii
CHAPTER 1 Analysis of Trade-off between Net Present Value (NPV) and Forest Carbon Sequestration and Storage ...1
INTRODUCTION...2
Trade-offs between Carbon and NPV ...4
MATERIALS AND METHODS ...5
Study area ...5
Methodology ...7
ANALYSIS AND RESULTS ...11
DISCUSSION AND CONCLUSIONS ...14
REFERENCES ...16
CHAPTER 2 A Framework for Detecting Individual Trees from UAV-derived Canopy Height Model: First step towards Carbon Mapping ...21
INTRODUCTION...22
MATERIALS AND METHODS ...25
Study Area ...25
Data Acquisition and Processing...26
Individual Tree Identification ...28
ANALYSIS AND RESULTS ...30
DISCUSSION AND CONCLUSIONS ...33
LIST OF TABLES
Table 2.1 Summary of drone-image processing using Agisoft ...27
LIST OF FIGURES
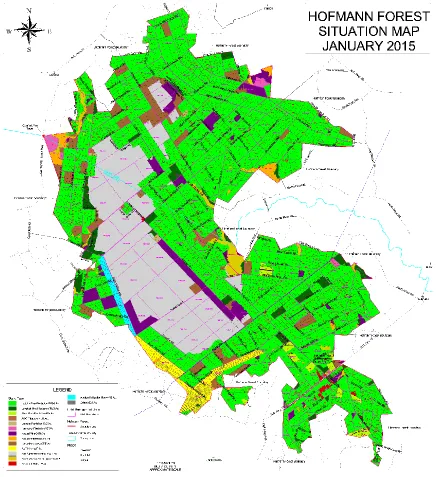
Figure 1.1 Hofmann Forest 2015 Operations Map ...6
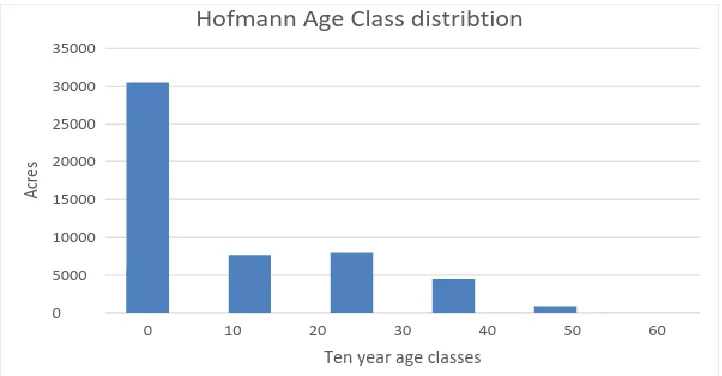
Figure 1.2 Land use age class distribution of the Hofmann Forest in March 2015 ...7
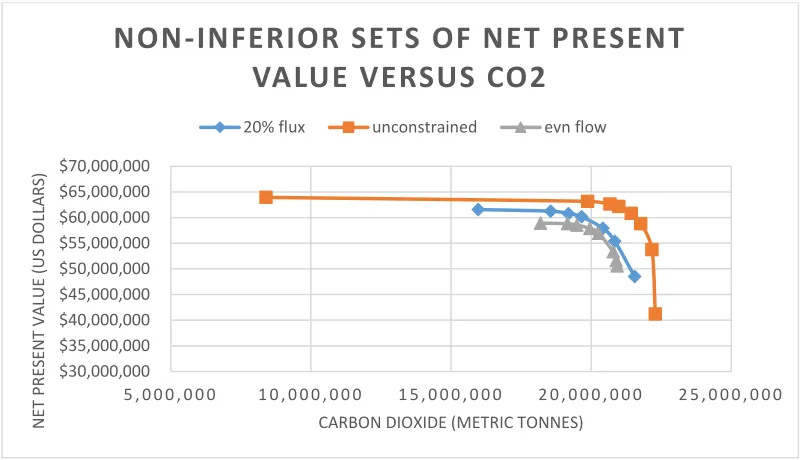
Figure 1.3 Optimal combinations Net Present Value and CO2 presented as production possibility curves for NPV and Carbon under the three harvest flow constraints ...12
Figure 1.4 The opportunity cost per tonne in, NPV US dollars, associated with increases in carbon production for the three different harvest flow constraints ...13
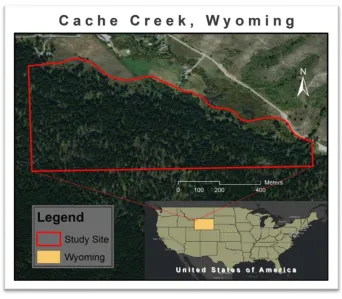
Figure 2.1 Map of Study Area – Cache Creek ...25
Figure 2.2 Orthomosaic at 0.14m/pixel resolution generated from UAV imagery ...27
Figure 2.3 UAV-derived Canopy Height Model ...28
Figure 2.4 Tree tops (red dots) identified using the FindTreesCHM function in R ...30
CHAPTER 1
INTRODUCTION
Over the years, global warming has become a widespread environmental concern and a
number of studies have been trying to demonstrate the damaging impacts of anthropogenic emissions of greenhouse gases (GHG). A number of international and national agreements and policies, such as the Kyoto Protocol, the Paris Agreement, and the EU climate policy
have also backed this calling for stabilizing the carbon content in atmosphere. Even though the main focus of these agreements and policies is on reducing GHG emissions, carbon
content in the atmosphere can also be offset by carbon sink enhancement (Gren & Zeleke, 2016).
Terrestrial carbon sequestration through reforestation, afforestation and improved forest management practices which can be viewed as methods to mitigate the issues related to CO2
accumulation in the atmosphere. Several studies have found that growing trees to sequester carbon could provide relatively low-cost net emission reductions for a number of countries (Hoen and Solberg, 1994; Newell and Stavins. 2000). However, As the amount of forest land
is limited, there is a need to give more emphasis on the implementation of sustainable harvest procedures in existing forest areas and on the efficiency with which forest products are
In this chapter a forest management model designed to optimize the combination of two objectives: Net Present Value (NPV), and carbon sequestration and storage, on the Hofmann
Forest in North Carolina is presented. For growth and yield estimates we used both LOBDSS and the USDA Forest Vegetation Simulator (FVS). LOBDSS (Amateis et al., 2000; Amateis et al., 2001) is an expert system, with FastLob2.1 as the underlying growth-and-yield model
used to determine intensively management treatment effects of short (<49 years) rotation options (Amateis et al., 2000; Amateis et al., 2001). FVS is used to simulate longer (≥49
years) rotation effects on forest outcomes and conditions. FVS is a family of models that simulate growth and yield in an individual-tree and distance-dependent fashion. Considerable investments have been made by the US Forest Service to include as many forest outputs and
conditions as science will support (Dixon, 2002). We spliced these two models together to produce realistic short rotation plantations which maximize NPV and long rotation estimates
that are assumed to be needed to maximize Carbon sequestration and storage. Our
prescriptions included three levels of management intensity over a 100-year planning horizon using 5-year planning periods. Through sensitivity analysis we explore the effects of changes
in carbon storage and NPV, and compare our final values to the current markets (ARBOCS1) to evaluate their feasibility to produce change in management practices.
1 CRT Carbon Credits, Your Vercarbon Guide; Climate action Reserve Approved to Register
Trade-offs between Carbon and NPV
A tradeoff is a situation, in which a balance is made between two (or more) options, where a decision must be made to forego one or more items in exchange for another desirable item. This is the Parato Optimum condition (Barr, 2012). White and others (2011) illustrated the
relationship between NPV and carbon from different (independent) land uses. For example, they show, natural forests have high carbon stocks but low profitability and agricultural crops
have low carbon and high profitability. Other land uses have both low carbon and profitability (White et al., 2011).
To sell carbon credits from forest management projects one has to show additional carbon storage and sequestration above what would have been achieved without the project. Recent
research findings indicate that the additionality requirement of carbon will result in high economic costs to private landowners which only can be mitigated by a corresponding high price paid for carbon credits. Public land is a different story, because they typically do not
have a profit motive and they could feasibly be called on to sequester and store additional carbon, for the public good. The opportunity cost of carbon sequestration depends on the
contribution margins of the sold timber, and thus varies from place to place and time to time (Ndjondo et al., 2014). Even though several authors have written about carbon sequestration, it can be hard to compare studies due to differences in objectives, products and substitutions
practice that can be applied to every situation, but we can make better trade-offs depending on our needs, if we are able to comprehend the situation and understand the variables behind
it efficiently.
MATERIALS AND METHODS Study Area
The geographic focus of this study is the Hofmann Forest, a major land holding of the
Forestry School at North Carolina State University, USA (Figure 1). It encompasses approximately 32,000 contiguous hectares in the coastal plain of North Carolina ranging from 12 to 20 meters above sea level with an average slope of ≤1%. For this study we
analyzed only the 24,000 ha of operational land, consisting mostly of loblolly pine (Pinus Taeda L.) plantations. Figure 2 shows the associated age class distribution and other land use
Figure 1.2: Land use age class distribution of the Hofmann Forest in March 2015.
Methodology
A multi-objective forest management linear programing approach was the base formulation
involving different levels of management intensity and rotation ages from 15 to 100 years. The Remsoft Spatial Planning System™ provided the modeling structure. The approach was
designed to evaluate the tradeoff between NPV and carbon by maximizing the weighted total NPV from timber and additional tonnes of carbon. The decision land management variables
are hectares allocated to each combination of planting density, thinning timing and intensity, and rotation length. Besides timber volumes and values of sawtimber, chip-n-saw and pulpwood, we track tonnes of carbon in standing timber, in harvest residuals and slash, in
We use the following typical management prescriptions to capture the range of possibilities for multi-objective management. These are listed as follows:
1) The minimum final harvest age set to be 15 years. 2) The maximum final harvest age set to be 150 years. 3) Three possible thinning regimes:
● At 10 and 20 years reduce stocking to 10.9 m2/ha (70 square feet/acre). ● At 15 and 25 years reduce stocking to 10.9 m2/ha
● No thinning
4) Clear cutting was restricted to 5 years or greater following a thinning.
5) Planting site preparation: shear, bed and plant at 1.5 X 6 meters spacing or 697 trees/ha (5
X 20 feet spacing or 1075 trees/ha) (Fertilizer Applied)
6) Planting site preparation: shear, bed and plant at 1.5 X 6 meters spacing or 697 trees/ha (5
X 20 feet spacing or 1075 trees/ ha (436 trees/acres) (No Fertilizer)
7)Planting site preparation. Shear, no bedding, plant at 3705 trees/ha (1500 trees/acre) (fertilizer)
8) Planting site preparation. Shear, no bedding, plant at 3705 trees/ha (no fertilizer)
It should be noted that in a multi-programming model, the relative importance of each objective will vary depending on the decision maker’s interests, and even the non-decision
carbon and efficacy of management practices (Prodanovic et al., 2003). In other words, the value of a forest is directly related to management objectives.
In our model we use the California Carbon Market quantification methodology (CARB, 2015) and consider this study an improved forest management project. This type of project is
required to improve the carbon sequestration in relation to a historical baseline. This can be done through several ways such as, extending rotation ages, increasing forestry productivity
by sanitary practices and thinning, keep high stocking of trees and other forest silviculture management practices (CARB, 2015). For our baseline, we used the initial standing timber inventory and the subsequent management associated with the single objective of net present
value. Additionality was calculated as the difference between the sum of tonnes of C
sequestered and stored in each period and the baseline. The current inventory is the result of
80 + years of managing the Forest to Maximize NPV, acknowledging that over the first 50 year classical methods were used and only over the last 30 years were modern planning methodology applied.
For improved forest management projects, all protocols require that parties applying for
Carbon credits must certify additionality. It is based on how similar forests are being managed, rather than guessing how a particular landowner would act. After completing the calculation process and applications there are very specific processes for monitoring the
consequent expenses. Monitoring is a way of demonstrating that the Carbon pool estimated has not been reversed, and it accounts for both onsite and offsite carbon (basically products).
The current inventory is the result of 80 + years of managing the Forest to Maximize NPV, acknowledging that over the first 50 year classical methods were used and only over the last
30 years were modern planning methodology applied. Timber prices for estimating net present value were obtained from Timber Mart-South2. For improved forest management
projects, all protocols require that parties applying for Carbon credits must certify
additionality. It is based on how similar forests are being managed, rather than guessing how a particular landowner would act. After completing the calculation process and applications
there are very specific processes for monitoring the accomplishment. Some of these procedures require independent third party verification with consequent expenses.
Monitoring is a way of demonstrating that the Carbon pool estimated has not been reversed, and it accounts for both onsite and offsite carbon (basically products). The Products
considered were Pine Sawtimber, Pine Chip-N-Saw, and Pine Pulpwood, and the product
units were in green tons. Details on carbon conversion can be found in Appendix C Estimating Carbon (CARB, 2015).
2 Timber Mart-South Eastern regional averages for the state of North Carolina for the 1st
It should be noted that in a multi-programming model, the relative importance of each objective will vary depending on the decision maker’s interests, and even the non-decision
variables such as weights, discount rates, site indices, costs, and prices do affect the cost of carbon and efficacy of management practices (Prodanovic et al., 2003). In other words, the value of a forest is directly related to management objectives.
ANALYSIS AND RESULTS
The multi-objective formulation was evaluated under three different constraint scenarios; unconstrained harvest flow, 20% variation from period to period harvest flow and even harvest flow. The results are summarized in figure 3 which displays production possibility
curves of the relation between optimal NPV and additional CO¬2 sequestration and storage. Each curve is a non-inferior set of points, with each point on a curve being equally valid
depending on the decision maker preferences, while each point below the curve is inferior because you can always increase both NPV and/or CO¬2 by moving to the curve. Each point above the curve is non-feasible given the capabilities of the land base and the policies being
applied. In each case, when optimizing for carbon stored over the entire 100-year planning horizon, the model selected stands with the highest available planting density (3705 trees
Figure 1.3: Optimal combinations Net Present Value and CO2 presented as production
possibility curves for NPV and Carbon under the three harvest flow constraints.
The completely unconstrained maximization run resulted in unrealistic harvest results.
Operational and market experience suggest that no more than 8,100 ha (20,000 ac) could be harvested in a 5-year period. In order to maximize the annual growth potential of the standing
carbon stocks, the unconstrained model clear-cut unrealistically large areas in periods 5, 13, and 20. Adding the 20% variation in harvest flow constraint lowered clear cut areas to realistic levels and increased the amount of thinning substantially from 209 ha yr-1 (517 ac
yr-1) to 630 ha yr-1 (1,558 ac yr-1).
Sensitivity analysis revealed that the tradeoff between carbon sequestration and net present value maximization requires only a slight reduction in carbon sequestration to achieve dramatic increases in net present value (fig. 1.3). Under the 20% constraint, carbon
$30,000,000 $35,000,000 $40,000,000 $45,000,000 $50,000,000 $55,000,000 $60,000,000 $65,000,000 $70,000,000
5 , 0 0 0 , 0 0 0 1 0 , 0 0 0 , 0 0 0 1 5 , 0 0 0 , 0 0 0 2 0 , 0 0 0 , 0 0 0 2 5 , 0 0 0 , 0 0 0
N ET P R ES EN T V A LUE ( US DO LL A R S)
CARBON DIOXIDE (METRIC TONNES)
NON-INFERIOR SETS OF NET PRESENT
VALUE VERSUS CO2
maximization yielded a net present value $48,531,255 and 5,576,235 additional Mg CO¬2 over the 100-year horizon (point 1, fig. 1.3). On the other end of the 20% curve, maximum
NPV is $61,552,806 and CO¬2 is at 0 Mg (Point 2, fig.1.3). Total CO2 sequestered and stored is 15,969,129 Mg but none of this is additional, since we get this under current management. However, if we increased CO2 to the maximum level (Point 1, Fig. 1.3 and
1.4), NPV falls by $13,021,551 yielding a gain of 5,576,235 Mg CO2 at an opportunity cost of $2.34 Mg-1 (Point 1, fig.1.4). Current CARB market prices (over $10 per Mg CO¬2)
suggest that an improved forest management plan for large forest owners in the Southeastern United States could effectively improve both carbon sequestration and profitability.
Figure 1.4: The opportunity cost per tonne in, NPV US dollars, associated with increases in carbon production for the three different harvest flow constraints.
0 20 40 60 80 100 120
10,000,000 14,000,000 18,000,000 22,000,000 26,000,000
US D / me tr ic to n n e
Additonal CO2 (Metric tonnes)
Marginal cost of additional CO2
DISCUSSION AND CONCLUSIONS
Our results indicate that pine plantations represent a major potential carbon pool in the South
East United States. The baseline formulation in our model is defined by a NPV optimization condition and this type of baseline approach is important as it affects the quantity, credibility, and equity of credits generated from efforts to reduce forest carbon emissions (Chomotz,
2000; Griscom et al., 2009; Gibbs et al., 2009). For this study we have not considered the minimum baseline level (average carbon stocks of forest of the same cover type in the same
region) to be the baseline level of available carbon stocks as we aimed to assess the net change in CO2e sequestration relative to a business as usual scenario, and not to other forests within the region. From figure 3 and 4, we understand that for a small cost per tonne we can
sequester and store additional carbon. Although carbon sequestration in forest might not be a permanent carbon sink, it can buy us some extra time and thereby help in delaying
temperature increase and related issues (Backéus et al., 2006). Considering an uncertain future, these methods have an advantage of being flexible and reversible most of the times (Solberg, 1997; Van Kooten et al., 1997). Moreover, it is easier to evaluate the cost of carbon
uptake as compared to cost associated with future damages caused due to changing climatic conditions (Backéus et al., 2006; Van Kooten et al., 1997). There are also several other
mechanisms such as emission trading and joint implementation, which opens opportunities to pursue transfer and creation of carbon reduction units through industrial projects at a global scale (Burley et al., 2007; Pretty & Ball, 2001). Considering all these factors there is a huge
markets to alter their management practices and increase carbon storage capacity of forest, without costing a large amount of money. However, recent studies show that these research
findings are not accepted by large segments of the American public for various reasons (Leiserowitz et al., 2013; Khanal et al., 2016).
One of the primary hurdles for including plantations in the market is the species diversity requirement (CARB, 2015). Plantations are inherently monocultures and currently, improved
forest management (IFM) protocols within the United States, require mixed species,
consistent with natural forest management. Another concern regarding carbon storage is the saturation issue, which is a measure of how much carbon forests can carry at a given time
(Marland et al., 2001; Lee et al., 2005; Canadell et al., 2007; Nabuurs et al., 2013). From our saturation curve we can notice that 100 years were not enough for reaching a steady state in
standing volume, which means that there is less risk of carbon storage over the next 100 years given the fact that the net growth of our carbon model reflects carbon sequestration and there are no large scale disturbances happening at the study site. However, it is advised to
understand the actual risk and magnitude of potential reversals beforehand, so that suitable management strategies can be incorporated in situations involving intentional or
With respect to global climate change and mitigation strategies, a measure of detailed carbon balance is necessary as the net release or uptake of carbon by forests could have a large
impact on the atmosphere's CO concentration (IGBP Terrestrial Carbon Working Group, 1998; Körner, 2003). Also, variation in forest management strategies can have serious impacts on other carbon pools and this will in turn affect the overall carbon sequestration
capacity of a given forest land. For example, harvesting, thinning and fertilizer applications are found to affect the soil carbon dynamics of forests to a moderate degree (Johnson &
Curtis, 2001; Luo et al., 2003; Jandl et al., 2007; Peng et al., 2008; Nave et al., 2010; Noormets et al., 2015). It should be borne in mind that the carbon inventory used for this study was derived from merchantable inventory, which does not include carbon pools such as
soil, standing dead trees and trees below minimum dbh class. Hence for improving the overall efficiency of current model, further research focused on implementation of inventory
data to include all possible carbon pools is essential.
REFERENCES
Amateis, R. L., Liu, J., Ducey, M. J., & Allen, H. L. (2000). Modeling response to midrotation nitrogen and phosphorus fertilization in loblolly pine plantations. Southern Journal of Applied Forestry, 24(4), 207-212.
Amateis, R. L., Burkhart, H. E., Allen, H. L., & Montes, C. (2001). FASTLOB: A stand-level growth and yield model for fertilized and thinned loblolly pine plantations. Loblolly Pine Growth and Yield Research Cooperative Report, (115), 26.
Backéus, S., Wikström, P., & Lämås, T. (2005). A model for regional analysis of carbon sequestration and timber production. Forest ecology and management, 216(1), 28-40.
Baskent, E. Z., & Keleş, S. (2009). Developing alternative forest management planning strategies incorporating timber, water and carbon values: An examination of their interactions. Environmental Modeling & Assessment, 14(4), 467-480.
Birdsey, R., Pregitzer, K., & Lucier, A. (2006). Forest carbon management in the United States. Journal of environmental quality, 35(4), 1461-1469.
Brown, S., Sathaye, J., Cannell, M., & Kauppi, P. E. (1995). Management of forests for mitigation of greenhouse gas emissions. Cambridge University Press.
Burley, J., Ebeling, J., Costa, P. M., Freer-Smith, P. H., Broadmeadow, M. S. J., & Lynch, J. M. (2007). 5 Carbon Sequestration as a Forestry Opportunity in a Changing
Climate. Forestry and Climate Change, 31.
Canadell, J. G., Pataki, D. E., Gifford, R., Houghton, R. A., Luo, Y., Raupach, M. R., ... & Steffen, W. (2007). Saturation of the terrestrial carbon sink. In Terrestrial ecosystems in a changing world (pp. 59-78). Springer Berlin Heidelberg.
CARB. (2015). Compliance Offset Protocol, California Air Resources Board. Adopted June 25, 2015, Downloaded Dec. 7, 2015:
http://www.arb.ca.gov/cc/capandtrade/protocols/usforest/forestprotocol2015.pdf CO2Now. (2015). Global Carbon Emissions. Dec. 1, 2015.
http://co2now.org/Current-CO2/CO2-Now/global-carbon-emissions.html
Chomitz, K. M. (2000). Evaluating carbon offsets from forestry and energy projects: How do they compare? (Vol. 2357). World Bank Publications.
Dı́az-Balteiro, L., & Romero, C. (2003). Forest management optimisation models when carbon captured is considered: a goal programming approach. Forest Ecology and Management, 174(1), 447-457.
Dixon, G. E. (2002). Essential FVS: A user’s guide to the Forest Vegetation Simulator. Fort Collins, CO: USDA-Forest Service, Forest Management Service Center.
Dixon, R., Brown, S., Houghton, R. E. A., Solomon, A. M., Trexler, M. C., & Wisniewski, J. (1994). Carbon pools and flux of global forest ecosystems. Science (Washington), 263(5144), 185-189.
Gharis, L., Roise, J., & McCarter, J. (2015). A compromise programming model for developing the cost of including carbon pools and flux into forest management. Annals of Operations Research, 232(1), 115-133.
Gibbs, H. K., Brown, S., Niles, J. O., & Foley, J. A. (2007). Monitoring and estimating tropical forest carbon stocks: making REDD a reality. Environmental Research Letters, 2(4), 045023.
Griscom, B., Shoch, D., Stanley, B., Cortez, R., & Virgilio, N. (2009). Sensitivity of amounts and distribution of tropical forest carbon credits depending on baseline rules. Environmental Science & Policy, 12(7), 897-911.
Heath, L. S., & Smith, J. E. (2004). Criterion 5, indicator 26: total forest ecosystem biomass and carbon pool, and if appropriate, by forest type, age class and successional change.
Hoen, H. F., & Solberg, B. (1994). Potential and economic efficiency of carbon sequestration in forest biomass through silvicultural management. Forest science, 40(3), 429-451.
Hoen, H. F., & Solberg, B. (1999). Policy options in carbon sequestration via sustainable forest management: an example from the North. Forest transition and carbon fluxes—Global scenarios and policies. Edited by M. Palo. World Development Studies, 15, 117-132.
IGBP Terrestrial Carbon Working Group. (1998). The terrestrial carbon cycle: implications for the Kyoto Protocol. Science, 280(5368), 1393-1394.
Jandl, R., Lindner, M., Vesterdal, L., Bauwens, B., Baritz, R., Hagedorn, F., ... & Byrne, K. A. (2007). How strongly can forest management influence soil carbon
sequestration?. Geoderma, 137(3), 253-268.
Johnson, D. W., & Curtis, P. S. (2001). Effects of forest management on soil C and N storage: meta analysis. Forest Ecology and Management, 140(2), 227-238.
Khanal, P. N., Grebner, D. L., Munn, I. A., Grado, S. C., Grala, R. K., Henderson, J. E., & Measells, M. K. (2016). Nonindustrial Private Forest Landowner Beliefs Toward Climate Change and Carbon Sequestration in the Southern United States. Journal of Forestry. Körner, C. (2003). Slow in, rapid out--carbon flux studies and Kyoto targets.
Science, 300(5623), 1242-1243.
Leiserowitz, A., Maibach, E. W., Roser-Renouf, C., Feinberg, G., & Howe, P. (2013).
Climate Change in the American Mind: Americans' Global Warming Beliefs and Attitudes in April 2013. Available at SSRN 2298705.
Luo, Y., White, L. W., Canadell, J. G., DeLucia, E. H., Ellsworth, D. S., Finzi, A., ... & Schlesinger, W. H. (2003). Sustainability of terrestrial carbon sequestration: a case study in Duke Forest with inversion approach. Global biogeochemical cycles, 17(1).
Marland, G., Fruit, K., & Sedjo, R. (2001). Accounting for sequestered carbon: the question of permanence. Environmental Science & Policy, 4(6), 259-268.
Nabuurs, G. J., Lindner, M., Verkerk, P. J., Gunia, K., Deda, P., Michalak, R., & Grassi, G. (2013). First signs of carbon sink saturation in European forest biomass. Nature Climate Change, 3(9), 792-796.
Nave, L. E., Vance, E. D., Swanston, C. W., & Curtis, P. S. (2010). Harvest impacts on soil carbon storage in temperate forests. Forest Ecology and Management, 259(5), 857-866. Ndjondo, M., Gourlet-Fleury, S., Manlay, R. J., Obiang, N. L. E., Ngomanda, A., Romero, C., ... & Picard, N. (2014). Opportunity costs of carbon sequestration in a forest concession in central Africa. Carbon balance and management, 9(1), 1.
Newell, R. G., & Stavins, R. N. (2000). Climate change and forest sinks: factors affecting the costs of carbon sequestration. Journal of environmental economics and management, 40(3), 211-235.
Noormets, A., Epron, D., Domec, J. C., McNulty, S. G., Fox, T., Sun, G., & King, J. S. (2015). Effects of forest management on productivity and carbon sequestration: A review and hypothesis. Forest Ecology and Management, 355, 124-140.
Peng, Y., Thomas, S. C., & Tian, D. (2008). Forest management and soil respiration: implications for carbon sequestration. Environmental Reviews, 16(NA), 93-111.
Pretty, J., & Ball, A. (2001). Agricultural influences on carbon emissions and sequestration: a review of evidence and the emerging trading options. Centre for environment and society occasional paper, 3, 31.
Solberg, B. (1997). Forest biomass as carbon sink‐economic value and forest management/policy implications. Critical Reviews in Environmental Science and Technology, 27(S1), 323-333.
van Kooten, G. C., Grainger, A., Ley, E., Marland, G., & Solberg, B. (1997). Conceptual issues related to carbon sequestration: Uncertainty and time. Critical Reviews in
Environmental Science and Technology, 27(S1), 65-82.
van Kooten, G. C., Krcmar-Nozic, E., Stennes, B., & van Gorkom, R. (1999). Economics of fossil fuel substitution and wood product sinks when trees are planted to sequester carbon on agricultural lands in western Canada. Canadian Journal of Forest Research, 29(11), 1669-1678
CHAPTER 2
INTRODUCTION
Forests hold large stores of carbon, yet uncertainty exists regarding their exact influence over global climate change phenomenon and how it is varying over space and time (Chave et al.,
2005; Mitchard et al., 2014). As a result, increasing numbers of studies are being pursued for mitigating global warming and are aimed on reduction of carbon dioxide emission from forests and green spaces. Accurate estimations of aboveground carbon density (ACD) and
any changes in carbon stocks due to human activities are required in order to reduce
emissions from deforestation and forest degradation (REDD+) [Angelson, 2008]. However, as forest study areas are can be vast and not easily accessible with plethora of tree species
with varying shapes and sizes, we need to find an inexpensive yet accurate method to acquire tree characteristics such as tree heights and diameters, which are essential for estimating
ACD (Chang et al., 2006). Although traditional field surveys help us gather detailed information regarding the forest characteristics, they can become uneconomical, time consuming and exhausting, and hence not ideal for studies dealing with periodic/time
enabled data collection (Gardner et al., 2008; Tang & Shao, 2015). Therefore, a key challenge is to determine how to collect forest attribute data in a timely and cost effective
manner.
For sustainable forest management, accurate information about forest composition, structure,
characteristics (Crowther et al., 2015; Nijland et al., 2015), biodiversity conservation (Garabedian et al., 2014) and carbon storage (Saatchi et al., 2011; Zhang et al., 2014).
Standard methodologies used for extracting tree characteristics are usually based on
photogrammetric and LiDAR data (Waser et al., 2008; Wallerman et al., 2012). Both require
expensive cameras, well-trained personnel, and precise technology to obtain accurate results (Zarco-Tejado et al., 2014). Further, as these remote sensing techniques are primarily
designed for large scale data collection, it becomes really expensive when used to acquire
high resolution data of smaller areas which are mostly the case with ecological studies (Wulder et al., 2004).
Advances in the fields of the UAV (Unmanned Aerial vehicle) technology and data processing have made it feasible to obtain very high-resolution imagery and 3D (three dimensional) data (Torres-Sánchez et al., 2015; Kettenborn et al., 2014). In fact, drones can
be seen as forester’s eye in the sky capable of performing forest inventory and analysis on a periodic basis (Zarco-Tejada et al., 2014; Hung et al., 2012). These unmanned aerial vehicles
(UAVs) can be remotely operated from the ground and there are now many lightweight UAVs on offer at reasonable costs. With a wide range of sensors to choose from, these UAVs allow the end users to define the spatial resolutions and thereby open new opportunities for
forest managers (Zahawi et al., 2015). Several studies have been conducted on UAV-derived
Canopy Height Model (CHM) demonstrating its capability to detect tree tops, delineate tree crowns, and subsequently estimate parameters of crown morphology such as height, diameter
et al., 2002; Song, 2007; Wallace et al., 2014; Tang & Shao, 2015; Zarco-Tejada et al., 2014, Katterborn et al., 2014; Zahawi et al., 2015).
With the increasing availability of high spatial resolution data and the computational power to process it, remote sensing research on tree-level characteristics extraction has been gaining
a lot of attention along with stand level statistics calculation (Larsen et al., 2011; Chen et al., 2006; Katterborn et al., 2014; Silva et al., 2016). Detailed forest information, such as tree counts, tree heights, crown base heights and diameter at breast height (DBH) are essential for
monitoring forest regeneration, quantitative analysis of forest structure and dynamics, and evaluating forest damage (Kwak et al., 2007; Chen et al., 2006; Strigul et al., 2008; Strigul,
2012). Irrespective of the medium of acquiring data, for obtaining individual tree-level information, it is critical to detect and delineate individual trees. Various tree detection
methods have been developed based on fundamental different approaches and a few of the most prominent ones are: local maxima detection, valley following (VF), template matching
(TM), scale-space (SS) theory, Markov random fields (MRFs), and marked point processes (MPP) (Silva et al., 2016; Larsen et al., 2011; Larsen & Rudemo, 1998; Gougeon, 1998;
Brandtberg & Walter, 1998; Lindeberg, 1994; Descombes & Pechersky, 2006; Perrin et al., 2006). In the field of environmental sciences, remote sensing techniques are undergoing
is to evaluate the applicability of UAV-derived Canopy Height Models for individual tree detection and to further discuss the possibilities of carbon mapping using UAV-imagery.
MATERIALS AND METHODS Study Area
The study area comprised of 32 ha of private forest at Cache Creek located at east of Jackson,
Wyoming. A total of 30 study plots was selected in such a way that they had a diverse range of tree densities and all the natural stands had a homogeneous composition of tree species.
Data Acquisition and Processing
For this study the survey was conducted on July 13, 2015 using a DJI phantom 3 quadcopter
with a Canon PowerShot S100 (5.2 mm; 4000 x 3000 resolution) camera attached. A total of 383 images from the flights conducted over study area were used to generate various models
and reports using the Agisoft software. Such software uses various photogrammetric algorithms and thereby produce 3D reconstruction models based on the location of images with respect to each other as well to the objects viewed within them (Dandois & Ellis, 2013).
The processing steps included automatic aerial triangulation (AAT), bundle block adjustment (BBA), noise filtering and DEM and ortho-mosaic creation. All the processes were done
under the default settings and in a fully automated way. The imagery was synchronized using the GPS position, and the ortho-mosaics and DEMs were generated using absolute GPS
coordinates; 4 random GCP (Ground Control Point) were also used for enhancing accuracy. Some specific information of the camera locations and image overlaps related to drone-image processing conducted in Agisoft is presented in Table 1. The derived DEM had a resolution
of .14m/pixel and a point density of 49.32 points per sq m. Further, field measurements of the
Table 2.1: Summary of drone-image processing using Agisoft
Figure 2.2: Orthomosaic at 0.14m/pixel resolution generated from UAV imagery
UAV data processing comprised of a series of steps and primary outputs were digital terrain model (DTM), digital surface model (DSM) and canopy height model (CHM). Ground points
were separated out from vegetation using the ground filter function in Lastools. The
We used US Forest Service FUSION/LDV 3.42 software for performing all the remaining point cloud workflow. DTMs were derived using grid surface tools and for generating DSMs
and CHMs, canopy model tool was used. Both DTMs and DSMs were of spatial resolution of 1m. Also, before generating CHMs, we had applied clip data function to DSMs to normalize
heights and improve alignment of z co-ordinates with respect to height above ground.
Figure 2.3: UAV-derived Canopy Height Model
Individual Tree Identification
In this study we developed a new algorithm for tree-detection from UAV derived CHMs by
the rLiDAR package available in R (R core team, 2015; Silva et al., 2015). FindTreesCHM function was used for automatic detection of tree tops. This function is built on local maxima
algorithm and it offers an option to search for tree tops in the CHM through a moving window with a fixed tree window size (TWS) according to the relationship between tree
height and crown size (Silva et al., 2016, Wulder et al., 2000; Popescu & Wynne, 2004). We considered four Fixed Window Sizes (fws) viz. 3x3, 5x5, 7x7, 9x9 and four Smoothen Window Sizes (SWS) viz. No filter, 3x3, 5x5, 7x7, resulting in 16 variant combinations for
TWS and SWS.
For testing the hypothesis, we selected 30 random plots and did a manual comparison
between UAV based tree counts (UTC) and field-based measurements. Further, we chose the best model and performed accuracy assessment for getting a better understanding of the
statistical factors and for identifying possible drawbacks. In particular, we evaluated the accuracy in terms of true positive (TP, correct detection), false negative (FN, omission error)
and false positive (FP, commission error), as well as with respect to recall (r), precision (p)
and F-score (F) [as explained in Li et al. (2012) (Goutte & Gaussier, 2005; Sokolova et al., 2006). The exact equations are listed below:
Here, recall can be viewed as a measure of tree-detected as it is inversely related to omission error, precision represents a measure of trees that were correctly detected as it is inversely
related to commission error and F-score represents the harmonic mean of recall and precision, and hence higher p and r values results in higher F-scores.
ANALYSIS AND RESULTS
FindTreesCHM function proved to be very effective in detecting tree tops from the UAV-derived CHM (figure 2.4, 2.5). Importantly, TWS and SWS combination were found to be a determining factor for tree detection rate (Table 2.2). TWS of 3 x 3 and 5 x 5 provided better
Figure 2.4: Red dots represent the tree tops identified using the FindTreesCHM function in R
Figure 2.5: Tree Identification results of a sample field plot
Finally, we did accuracy assessment on the best combination, which was 3 × 3 SWS and 3 x
3 TWS, and obtained an overall F-score of 0.86 (Table 2.2).
For this study, the recall had an overall value of 0.85 with a range of 0.68 to 1.00; overall value of p was 0.87 with a range of 0.69 to 1.00; and overall value of F-score was 0.86 and it
varied from 0.73 to 0.95 (Table 2.3). Among the 367 reference trees used for this study, the algorithm detected 358 (97.55 %) trees. In total, the algorithm missed 55 trees, and falsely
Table 2.3: Accuracy assessment results of UAV-based individual tree detection
DISCUSSION AND CONCLUSIONS
From the perspective of drone remote sensing based algorithms, this study can be recognized
resolution orthomosaics derived from drone imagery offers foresters an additional source of data for forest monitoring, inventory and planning (Silva et al., 2016; Wulder et al., 2000).
Estimation of tree-level attributes further enhance the forest management strategies to an individual-tree by tree basis. In this paper, a simplified framework for automated tree detection from UAV-derived imagery was presented and based on the final results, it can be
stated that local maxima algorithm combination is capable of derived tree counts with satisfactory accuracy. The final results in fact supported findings of a similar approach done
on LiDAR by (Silva et al., 2016) regarding inverse relationship of tree identification and canopy cover. With rising expansion of drone markets this methodology has the potential for serving as highly effective but affordable and easy to use tool for forest monitoring.
However, as the success of Local Maxima filtering in locating trees highly depends on the size and distribution of trees, proper selection of variable window-size techniques is crucial
for reducing both the commission and omission errors (Wulder et al., 2000).
Individual tree detection accuracy was found to be sensitive towards TWS and SWS
combinations, and we noticed an inverse relationship between TWS and UTC, similar to what was observed in (Silva et al., 2016). For smoothing we used pit-free CHMs instead of
standard Gaussian CHM as it gave better results with similar studies done by (Khosravipour et al., 2014). The best results for SWS were found at 3 x 3 irrespective of TWS. Similar results were obtained with (Silva et al., 2016) where the 3 x 3 filter eliminated spurious local
TWS parameter can be seen more advantageous while performing individual tree detection across a larger area. Hence the best combination, which was 3 x 3 TWS and 3 x 3 SWS, was
chosen for performing accuracy assessment. However, it should be borne in mind that the combinations of filter sizes and CHM filter conditions can be affected by forest types and tree age as well (Lindberg & Hollaus, 2012). Depending on the intended usage, the users
should always make a trade-off between commission and omission errors, and the overall efficiency of a particular window size can be viewed as function of object-resolution
relationship which can serve as a first step for developing site specific tree identification models. (Wulder et al., 2000).
Even though the best results were obtained for 3 x 3 window size, high commission errors were observed in all the cases. As the tree detection is based on a pixel’s reflectance value
compared to the relative pixels within the window, having a small window size results in selection of non-existent trees or multiple radiance peaks for an individual tree crown (Wulder et al., 2000). This further implies that detection of larger trees would be easier as
their crown consists of a higher number of pixels compared to the smaller trees. Hence it is good to have a rough estimate of the threshold tree size beforehand. Recent studies
(Falkowski et al., 2008, Silva et al., 2016) have also found an inversely proportional
relationship between canopy closure and suitable window sizes. Considering that, the higher success rate of 3 x 3 can be attributed to denser canopy cover of the study sites. In addition
or trees having low spectral contrast with respect to understory vegetation are also considered detrimental to tree detection procedure (Wulder et al., 2000). Hence the algorithm needs to
be continuously improved to adapt to different case scenarios and the transferability of our method can be expected to relay on multiple factors with openness of canopy as one of the most dominant determinant.
In the past decade, a lot of studies have mentioned the potential for automatic individual tree
detection on large scale (> 100 trees) forest lands using UAVs, the research area is still in its infant stage (Koh & Wich, 2012). Lim et al (Lim et al., 2015) had layer stacked RGB ortho-image and CHM, and performed segmentation and were able to identify 11 trees out of a
total of 13 trees with one additional falsely identified tree. The reason they found was that the unidentified trees had small width towards tree tops and center of tree tops were not definite
with respect to neighboring trees. (Wallace et al., 2016) tested the potential of uav remote sensing for forestry application using two techniques viz. airborne laser scanning (als) and structure from motion (sfm), and found als (RMSEp 0.59m) to over perform sfm (RMSEp
1.04 m) in areas having dense canopy cover which was the case with ours. Sperlich et al. (2015) developed point clouds photogrammetrically from UAV-based aerial photographs and
got a maximum detection rate of 87.68% within a search radius of 1 m using pouring algorithm. Afterwards Kattenborn (2014) upgraded Sperlich’s (2015) algorithm by
classifying uav-derived point clouds based on geometric characteristics and did individual
98.2% for dense growing palm stands. Irrespective of the tree detection techniques, areas having heterogeneous composition with mixed and unmanaged trees have offered
comparatively higher difficulties in selecting globally optimal segmentation parameters as opposed to homogenous stands (La et al., 2015). Changing overlapping threshold could be seen as a strategy for determining emergent trees as crown overlaps are found to be a major
source for omission errors (Zhou et al., 2013).
While assessing the tree detecting capability of given model, tree location error was not estimated due to data limitations. However, a possible increase of errors with increasing density of stands is anticipated as found in previous studies (Wallace et al., 2014). GPS errors
associated with tree location estimation is another common but unquantifiable source of uncertainty that needs attention (Wing wt al., 2008). Another major drawback of this
methodology can be attributed to the fact that irregular shape of tree crowns can be a big problem in high density areas. Also, as shadowing within and between crowns influence canopy reflectance, texture complexity, tree species variety, vertical stand structure and
image quality can also affect the delineation capacity of the algorithm. (La et al., 2015; Asner & Heidebrecht, 2002; Wulder et al., 2003). The transferability of the method can be affected
based on different forest types, particularly mixed species and multilayered forests.
Modern forestry mostly requires forest information in digital format for maintaining a
(Tang et al., 2009). In addition to that, ease of data collection, flexible control of spatial and temporal resolution, low operational costs and safer work environment underpins the
possibility of having a “drone as a service” data collection market in foreseeable future. Recent studies have efficiently demonstrated usage of drone-derived point clouds for forest survey and monitoring (Puttock et al., 2015; Koh & Wich, 2012; Paneque-Gálvezwt al.,
2014), mapping canopy gaps (Getzin et al., 2012; Getzin et al., 2014), measuring canopy height (Zarco-Tejada et al., 2014; Lim et al., 2015), tracking forest fires (Merino et al., 2012;
Martínez-de Dios et al., 2011) and supporting intensive forest management (Felderhof & Gillieson, 2012; Tang & Shao, 2015). Nevertheless, there are lot of challenges associated with regulated, safe and comprehensive applications of drone remote sensing (Tang & Shao,
2015). As there are no available multidisciplinary collaborations to promote the
standardization of drone remote sensing development, upcoming research expeditions should
prior compare themselves with previous studies for systematically determining ideal drone remote sensing strategy for given forest lands (Tang & Shao, 2015; Shahbazi et al., 2014). Formulating methods to increase point density and developing strategies that optimize tree
detection algorithms based on the characteristics of the point cloud can surely open new windows in drone data analytics. Based on the findings presented in this study, future
REFERENCES
Kwak, D. A., Lee, W. K., Lee, J. H., Biging, G. S., & Gong, P. (2007). Detection of individual trees and estimation of tree height using LiDAR data. Journal of Forest Research, 12(6), 425-434.
Wallace, L., Lucieer, A., & Watson, C. S. (2014). Evaluating tree detection and segmentation routines on very high resolution UAV LiDAR data. IEEE Transactions on Geoscience and Remote Sensing, 52(12), 7619-7628.
Silva, C. A., Hudak, A. T., Vierling, L. A., Loudermilk, E. L., O'Brien, J. J., Hiers, J. K., ... & Khosravipour, A. (2016). Imputation of Individual Longleaf Pine (Pinus palustris Mill.) Tree Attributes from Field and LiDAR Data. Canadian Journal of Remote Sensing, (just-accepted), 00-00.
Gardner, T. A., Barlow, J., Araujo, I. S., Ávila‐Pires, T. C., Bonaldo, A. B., Costa, J. E., ... & Hoogmoed, M. S. (2008). The cost‐effectiveness of biodiversity surveys in tropical
forests. Ecology letters, 11(2), 139-150.
Tang, L., & Shao, G. (2015). Drone remote sensing for forestry research and practices. Journal of Forestry Research, 26(4), 791-797
Larsen, M., Eriksson, M., Descombes, X., Perrin, G., Brandtberg, T., & Gougeon, F. A. (2011). Comparison of six individual tree crown detection algorithms evaluated under varying forest conditions. International Journal of Remote Sensing, 32(20), 5827-5852.
Waser, L. T., et al. "High‐resolution digital surface models (DSMs) for modelling fractional shrub/tree cover in a mire environment." International Journal of Remote Sensing 29.5 (2008): 1261-1276.
Wallerman, Jörgen, Jonas Bohlin, and Johan ES Fransson. "Forest height estimation using semi-individual tree detection in multi-spectral 3D aerial DMC data." Geoscience and Remote Sensing Symposium (IGARSS), 2012 IEEE International. IEEE, 2012
Hung, C., Bryson, M., and Sukkarieh, S. (2012), Multiclass predictive template for tree crown detection, ISPRS Journal of Photogrammetry and Remote Sensing, Vol. 68, pp. 170-183.
Torres-Sánchez, Jorge, et al. "High-throughput 3-D monitoring of agricultural-tree plantations with unmanned aerial vehicle (UAV) technology." PloS one10.6 (2015): e0130479.
Kattenborn, T., Sperlich, M., Bataua, K., & Koch, B. (2014). Automatic Single Tree
Detection in Plantations using UAV-based Photogrammetric Point clouds. The International Archives of Photogrammetry, Remote Sensing and Spatial Information Sciences, 40(3), 139.
Zahawi, Rakan A., et al. "Using lightweight unmanned aerial vehicles to monitor tropical forest recovery." Biological Conservation 186 (2015): 287-295
Saatchi, S. S., Harris, N. L., Brown, S., Lefsky, M., Mitchard, E. T., Salas, W., ... & Petrova, S. (2011). Benchmark map of forest carbon stocks in tropical regions across three
continents. Proceedings of the National Academy of Sciences, 108(24), 9899-9904.
Zhang, J., Huang, S., Hogg, E. H., Lieffers, V., Qin, Y., & He, F. (2014). Estimating spatial variation in Alberta forest biomass from a combination of forest inventory and remote sensing data. Biogeosciences, 11(10), 2793-2808.
Hansen, M. C., Potapov, P. V., Moore, R., Hancher, M., Turubanova, S. A., Tyukavina, A., ... & Kommareddy, A. (2013). High-resolution global maps of 21st-century forest cover change. Science, 342(6160), 850-853.
Crowther, T. W., Glick, H. B., Covey, K. R., Bettigole, C., Maynard, D. S., Thomas, S. M., ... & Tuanmu, M. N. (2015). Mapping tree density at a global scale. Nature, 525(7568), 201-205.
Nijland, W., Coops, N. C., Macdonald, S. E., Nielsen, S. E., Bater, C. W., & Stadt, J. J. (2015). Comparing patterns in forest stand structure following variable harvests using airborne laser scanning data. Forest Ecology and Management, 354, 272-280.
Popescu, S. C., & Wynne, R. H. (2004). Seeing the trees in the forest.Photogrammetric Engineering & Remote Sensing, 70(5), 589-604.
Lim, Y. S., La, P. H., Park, J. S., Lee, M. H., Pyeon, M. W., & Kim, J. I. (2015). Calculation of Tree Height and Canopy Crown from Drone Images Using Segmentation. Journal of the Korean Society of Surveying, Geodesy, Photogrammetry and Cartography, 33(6), 605-614.
Hudak, A. T., Haren, A. T., Crookston, N. L., Liebermann, R. J., & Ohmann, J. L. (2014). Imputing forest structure attributes from stand inventory and remotely sensed data in western Oregon, USA. Forest Science, 60(2), 253-269.
Hansen, E. H., Gobakken, T., Bollandsås, O. M., Zahabu, E., & Næsset, E. (2015). Modeling aboveground biomass in dense tropical submontane rainforest using airborne laser scanner data. Remote Sensing, 7(1), 788-807.
Saremi, H., Kumar, L., Stone, C., Melville, G., & Turner, R. (2014). Sub-compartment variation in tree height, stem diameter and stocking in a Pinus radiata D. Don plantation examined using airborne LiDAR data. Remote Sensing, 6(8), 7592-7609.
Gatziolis, D., Lienard, J. F., Vogs, A., & Strigul, N. S. (2015). 3D tree dimensionality assessment using photogrammetry and small unmanned aerial vehicles. PloS one, 10(9), e0137765.
Levin, S. A., & Harvey, J. A. (1999). Fragile dominion: complexity and the commons: Perseus Reading.
Strigul, N., Pristinski, D., Purves, D., Dushoff, J., & Pacala, S. (2008). Scaling from trees to forests: tractable macroscopic equations for forest dynamics. Ecological Monographs, 78(4), 523-545.
Strigul, N. (2012). Individual-based models and scaling methods for ecological forestry: implications of tree phenotypic plasticity. INTECH Open Access Publisher.
Gong, P., Sheng, Y., & Blging, G. S. (2002). 3d model-based tree measurement from high-resolution aerial imagery, Photogrammetric Engineering & Remote Sensing.
Valuation and Production Possibilities on a Working Forest using Multi-objective
programming, Woodstock, Timber NPV, and Carbon Storage and Sequestration. J. P. Roise , K. Harnish , M. Mohan , H. Scolforo , J. Chung , B. Kanieski , G. P. Catts , J. B. McCarter , J. Posse ,T. Shen. Scandinavian Journal of Forest Research
Turner, W., Spector, S., Gardiner, N., Fladeland, M., Sterling, E., & Steininger, M. (2003). Remote sensing for biodiversity science and conservation. Trends in ecology &
evolution, 18(6), 306-314.
Garabedian, J. E., McGaughey, R. J., Reutebuch, S. E., Parresol, B. R., Kilgo, J. C., Moorman, C. E., & Peterson, M. N. (2014). Quantitative analysis of woodpecker habitat using high-resolution airborne LiDAR estimates of forest structure and composition. Remote Sensing of Environment, 145, 68-80.
Vierling, K. T., Vierling, L. A., Gould, W. A., Martinuzzi, S., & Clawges, R. M. (2008). Lidar: shedding new light on habitat characterization and modeling. Frontiers in Ecology and the Environment, 6(2), 90-98.
Puttock, A. K., Cunliffe, A. M., Anderson, K., & Brazier, R. E. (2015). Aerial photography collected with a multirotor drone reveals impact of Eurasian beaver reintroduction on ecosystem structure 1. Journal of Unmanned Vehicle Systems, 3(3), 123-130.
Anderson, K., & Gaston, K. J. (2013). Lightweight unmanned aerial vehicles will
revolutionize spatial ecology. Frontiers in Ecology and the Environment,11(3), 138-146.
R Core Team. 2015. R: A Language and Environment for Statistical Computing. R Foundation for Statistical Computing, Vienna, Austria, accessed Oct. 15 2015, <http://www.R-project.org≥.
Silva, C.A., Crookston, N.L., Hudak, A.T., and Vierling, L.A. 2015. rLiDAR: An R package for reading, processing and visualizing LiDAR (Light Detection and Ranging) data, version 0.1, accessed Oct. 15 2015, < http://cran.rproject. org/web/packages/rLiDAR/index.html>. Wulder, M., Niemann, K. O., & Goodenough, D. G. (2000). Local maximum filtering for the extraction of tree locations and basal area from high spatial resolution imagery. Remote Sensing of environment, 73(1), 103-114.
Goutte, C., & Gaussier, E. (2005, March). A probabilistic interpretation of precision, recall and F-score, with implication for evaluation. In European Conference on Information Retrieval (pp. 345-359). Springer Berlin Heidelberg.
Sokolova, M., Japkowicz, N., & Szpakowicz, S. (2006, December). Beyond accuracy, F-score and ROC: a family of discriminant measures for performance evaluation.
In Australasian Joint Conference on Artificial Intelligence (pp. 1015-1021). Springer Berlin Heidelberg.
Khosravipour, A., Skidmore, A. K., Isenburg, M., Wang, T., & Hussin, Y. A. (2014).
Generating pit-free canopy height models from airborne lidar.Photogrammetric Engineering & Remote Sensing, 80(9), 863-872.
La, H. P., Eo, Y. D., Chang, A., & Kim, C. (2015). Extraction of individual tree crown using hyperspectral image and LiDAR data. KSCE Journal of Civil Engineering, 19(4), 1078-1087.
Asner, G. P., & Heidebrecht, K. B. (2002). Spectral unmixing of vegetation, soil and dry carbon cover in arid regions: comparing multispectral and hyperspectral
observations. International Journal of Remote Sensing, 23(19), 3939-3958
Wulder, M. A., Dechka, J. A., Gillis, M. A., Luther, J. E., Hall, R. J., Beaudoin, A., & Franklin, S. E. (2003). Operational mapping of the land cover of the forested area of Canada with Landsat data: EOSD land cover program. The forestry chronicle, 79(6), 1075-1083. Lindberg, E., & Hollaus, M. (2012). Comparison of methods for estimation of stem volume, stem number and basal area from airborne laser scanning data in a hemi-boreal
forest. Remote Sensing, 4(4), 1004-1023.
Falkowski, M. J., Smith, A. M., Gessler, P. E., Hudak, A. T., Vierling, L. A., & Evans, J. S. (2008). The influence of conifer forest canopy cover on the accuracy of two individual tree measurement algorithms using lidar data.Canadian Journal of Remote Sensing, 34(sup2), S338-S350.
Tang, L., Shao, G., & Dai, L. (2009). Roles of digital technology in China's sustainable forestry development. International Journal of Sustainable Development & World Ecology, 16(2), 94-101.
Felderhof, L., & Gillieson, D. (2012). Near-infrared imagery from unmanned aerial systems and satellites can be used to specify fertilizer application rates in tree crops. Canadian Journal of Remote Sensing, 37(4), 376-386.
Wallace, L., Watson, C., & Lucieer, A. (2014). Detecting pruning of individual stems using airborne laser scanning data captured from an unmanned aerial vehicle. International Journal of Applied Earth Observation and Geoinformation, 30, 76-85.
Merino, L., Caballero, F., Martínez-de-Dios, J. R., Maza, I., & Ollero, A. (2012). An unmanned aircraft system for automatic forest fire monitoring and measurement. Journal of Intelligent & Robotic Systems, 65(1-4), 533-548.
Martínez-de Dios, J. R., Merino, L., Caballero, F., & Ollero, A. (2011). Automatic forest-fire measuring using ground stations and unmanned aerial systems. Sensors, 11(6), 6328-6353. Getzin, S., Wiegand, K., & Schöning, I. (2012). Assessing biodiversity in forests using very high‐resolution images and unmanned aerial vehicles.Methods in Ecology and
Evolution, 3(2), 397-404.
Getzin, S., Nuske, R. S., & Wiegand, K. (2014). Using unmanned aerial vehicles (UAV) to quantify spatial gap patterns in forests. Remote Sensing,6(8), 6988-7004.
Koh, L., & Wich, S. (2012). Dawn of drone ecology: low-cost autonomous aerial vehicles for conservation.
Paneque-Gálvez, J., McCall, M. K., Napoletano, B. M., Wich, S. A., & Koh, L. P. (2014). Small drones for community-based forest monitoring: An assessment of their feasibility and potential in tropical areas. Forests, 5(6), 1481-1507.
Wallace, L., Lucieer, A., Malenovský, Z., Turner, D., & Vopěnka, P. (2016). Assessment of Forest Structure Using Two UAV Techniques: A Comparison of Airborne Laser Scanning and Structure from Motion (SfM) Point Clouds.Forests, 7(3), 62.
Sperlich, M. A. X. I. M. I. L. I. A. N., Kattenborn, T. E. J. A., Koch, B. A. R. B. A. R. A., & Kattenborn, G. (2014). Potential of unmanned aerial vehicle based photogrammetric point clouds for automatic single tree detection.Available onlilne: http://www. dgpf.
de/neu/Proc2014/proceedings/papers/Beitrag270. pdf (accessed on 15 January 2015).
Dandois, Jonathan P., and Erle C. Ellis. "High spatial resolution three-dimensional mapping of vegetation spectral dynamics using computer vision." Remote Sensing of Environment 136 (2013): 259-276.
Gougeon, F. A. (1998, February). Automatic individual tree crown delineation using a valley-following algorithm and r
ule-based system. In Proc. International Forum on Automated Interpretation of High Spatial Resolution Digital Imagery for Forestry, Victoria, British Columbia, Canada (pp. 11-23).
Larsen, M., & Rudemo, M. (1998). Optimizing templates for finding trees in aerial photographs. Pattern Recognition Letters, 19(12), 1153-1162.
Brandtberg, T., & Walter, F. (1998). Automated delineation of individual tree crowns in high spatial resolution aerial images by multiple-scale analysis.Machine Vision and
Applications, 11(2), 64-73.
Lindeberg, T. (1994). Scale-space theory: A basic tool for analyzing structures at different scales. Journal of applied statistics, 21(1-2), 225-270.
Descombes, X., & Pechersky, E. (2006). Tree Crown Extraction using a Three State Markov Random Field (Doctoral dissertation, INRIA).
Perrin, G., Descombes, X., & Zerubia, J. (2006). A non-Bayesian model for tree crown extraction using marked point processes (Doctoral dissertation, INRIA).
Zhou, J., Proisy, C., Descombes, X., Le Maire, G., Nouvellon, Y., Stape, J. L., ... & Couteron, P. (2013). Mapping local density of young Eucalyptus plantations by individual tree detection in high spatial resolution satellite images. Forest Ecology and
Management, 301, 129-141.
Wing, M. G., Eklund, A., John, S., & Richard, K. (2008). Horizontal measurement performance of five mapping-grade global positioning system receiver configurations in several forested settings. Western Journal of Applied Forestry, 23(3), 166-171.