INVESTIGATION
A General De
fi
nition of the Heritable Variation
That Determines the Potential of a Population
to Respond to Selection
Piter Bijma1 Animal Breeding and Genomics Centre, Wageningen University, 6709PG Wageningen, The Netherlands
ABSTRACTGenetic selection is a major force shaping life on earth. In classical genetic theory, response to selection is the product of the strength of selection and the additive genetic variance in a trait. The additive genetic variance reflects a population’s intrinsic potential to respond to selection. The ordinary additive genetic variance, however, ignores the social organization of life. With social interactions among individuals, individual trait values may depend on genes in others, a phenomenon known as indirect genetic effects. Models accounting for indirect genetic effects, however, lack a general definition of heritable variation. Here I propose a general definition of the heritable variation that determines the potential of a population to respond to selection. This generalizes the concept of heritable variance to any inheritance model and level of organization. The result shows that heritable variance de-termining potential response to selection is the variance among individuals in the heritable quantity that determines the population mean trait value, rather than the usual additive genetic component of phenotypic variance. It follows, therefore, that heritable variance may exceed phenotypic variance among individuals, which is impossible in classical theory. This work also provides a measure of the utilization of heritable variation for response to selection and integrates two well-known models of maternal genetic effects. The result shows that relatedness between the focal individual and the individuals affecting itsfitness is a key determinant of the utilization of heritable variance for response to selection.
G
ENETIC selection is both a major force shaping life andthe principal human tool to improve agricultural pop-ulations. In nature, differences infitness among individuals lead to the evolution of adaptive traits (Haldane 1932; Wright 1937), and in agriculture, breeders improve their populations by selecting the best individuals as parents of the next generation (Lush 1937). Populations respond to selection only if they contain heritable variation, meaning that individuals differ in the effects they transmit to their offspring. In classical quantitative genetics, heritable variation equals the additive genetic variance (Fisher 1918; Haldane 1932; Wright 1937; Robertson 1966; Price 1970). The heri-table variation reflects the potential of a population to re-spond to selection (Robertson 1966; Price 1970; Lande and Arnold 1983), which is important for adaptive evolution in nature and for genetic improvement in agriculture. A clear
definition of heritable variation allows one to investigate the mechanisms maintaining heritable variation in nature and to optimize artificial selection schemes in agriculture.
Here I propose a general definition of the heritable
variation that determines the potential of a population to respond to genetic selection. Thus, throughout this work, “heritable variation”refers to the quantity that determines the intrinsic potential of a population to respond to genetic selection. The remainder of this Introduction summarizes the classical definition of heritable variation and discusses its limitations. Subsequently, I generalize the definition of heritable variation.
In classical quantitative genetics, heritable variation follows from partitioning individual trait values,z, into a her-itable component,A, and a nonheritable residual,e:
z¼Aþe (1)
(Fisher 1918; Haldane 1932; Wright 1937; Falconer and
Mackay 1996; Lynch and Walsh 1998). TheAis the additive
genetic value, or breeding value, which is the sum of the average effects of the alleles carried by the individual,
Copyright © 2011 by the Genetics Society of America doi: 10.1534/genetics.111.130617
Manuscript received May 12, 2011; accepted for publication September 6, 2011
1Address for correspondence: Animal Breeding and Genomics Centre, Wageningen
including the average contributions arising from dominance and/or epistasis (Fisher 1918; Falconer and Mackay 1996;
Lynch and Walsh 1998). The residual, e, includes all
non-heritable components, which may originate from nonaddi-tive genetic effects and the environment. The heritable variation is defined as the variance of the breeding values
among individuals, s2
A, which is known as the additive
ge-netic variance. (Note that additive gege-netic variance excludes transient effects transmitted to offspring, such as additive-by-additive epistatic effects). The additive genetic variance is a component of phenotypic variance (Fisher 1918; Falconer and Mackay 1996; Lynch and Walsh 1998),
s2
z ¼s2Aþs2e: (2)
Response to selection,DzA, is the additive genetic change in mean trait value from one generation to the next and depends on both the selection process and the additive ge-netic variance. Although the common expressions for re-sponse to selection differ between the fields of evolutionary quantitative genetics and artificial breeding, they are
equiv-alent when traits and fitness follow a multivariate normal
distribution (Appendix A). In evolutionary quantitative genet-ics, response is expressed as the product of the selection gra-dient,b, and the additive genetic variance,
DzA¼bs2A (3a)
(Robertson 1966; Price 1970; Rausher 1992; Rice 2004), wherebis the regression coefficient of an individual’s rela-tivefitness on its breeding value. (For this work, it suffices to consider a single trait and discrete generations.) In artificial breeding, response is expressed as the product of the inten-sity of selection, i, the accuracy of selection, r, and the additive genetic standard deviation (Falconer and Mackay 1996),
DzA¼irsA: (3b)
The accuracy of selection is the correlation between an individual’s value for the selection criterion and its breeding value. The intensity of selection is the selection differential expressed in standard deviation units. (The symboliis used
here rather than the usual i, to avoid confusion with the
index for the focal individual).
In accordance with current belief, Equations 3a and 3b
show that additive genetic standard deviation, sA,
deter-mines the potential of a population to respond to selection. In Equation 3b, intensity and accuracy of selection are stan-dardized, scale free, parameters that depend on the breed-ing design; neither intensity nor accuracy includes any information on heritable variation in the trait. The additive genetic standard deviation, by contrast, expresses the heri-table differences in the population in trait units and reflects the intrinsic potential of a population to respond to selec-tion. Equation 3a may suggest thats2
A, rather thansA, is the
relevant parameter. The selection gradient, however, is not scale free. A full separation of selection and heritable varia-tion follows from expressing Equavaria-tion 3a as
DzA¼ ðbsAÞsA;
where bsA is the standardized selection gradient, which
expresses the selection differential in sA units and is scale free. Hence, this expression also identifiessAas the relevant parameter.
The above shows that a variance partitioning perspective (Equations 1 and 2) and a response to selection perspective (Equations 3a and 3b) yield the same result; both identify additive genetic standard deviation as the relevant param-eter. In classical theory, therefore, the heritable variation that determines potential response to selection follows from partitioning the phenotypic variance into additive genetic and remaining components. Because additive genetic vari-ance is a component of phenotypic varivari-ance, it cannot exceed phenotypic variance (Equation 2). In the classical perspective, therefore, phenotypic variance restricts a pop-ulation’s potential to respond to selection.
While the classical quantitative genetic model has in-creased our understanding of inheritance and response to selection tremendously, it overlooks part of the heritable effects that may contribute to response. Specifically, it states that the heritable effects on the focal individual’s trait value originate solely from the focal individual itself, disregarding the social organization of life (Dawkins 1982; Frank 1998; West-Eberhard 2003). It ignores the effects of an individu-al’s genes on trait values of others, known as indirect genetic or associative effects (Griffing 1967; Kirkpatrick and Lande
1989; Moore et al.1997; Wolf et al. 1998; McAdamet al.
2002; Muir 2005; Wilson et al. 2009; Chenoweth et al.
2010; McGlothlin et al. 2010). There is growing evidence
that such indirect genetic effects are widespread (Frank
2007). Individual fitness, for example, depends on number
and quality of offspring, which are affected not only by the genes in the focal individual, but also by those in its mate.
Conspecifics often compete for access to mates, making
in-dividual fitness dependent on genes in competitors. Many
species, moreover, live in groups or colonies, where individ-ual trait values may depend on genes in group mates. Al-though indirect genetic effects are often associated with behavioral interactions, such as interference competition (e.g., Wilson et al.2009) or social learning, they may also work via the environment through effects on resources or exposure to infectious disease. Not only animals, but also microorganisms and plants exhibit numerous social interac-tions, both in agriculture and in nature (Crespi 2001; Frank 2007; Griffinet al.2004; Muir 2005; Westet al.2006; Karban 2008).
a colony in social insects (Wheeler 1933) or the number of prey caught by a hunting pack. For such cases, current quan-titative genetic theory does not provide a measure of heri-table variation. Nevertheless, the individuals involved are members of the same population, and response to selection is the result of changes in a single gene pool, which suggests that it should be possible to define heritable variation also for such cases.
An example of an emergent trait in agriculture is the output of a farm, which may depend on different types of individuals. In pig production, for example, the meat pro-duced per sow is the product of the number of offspring of that sow and average meat yield of her offspring (see example below). Hence, the heritable variation in meat yield per sow will depend on both genes for reproduction in the sow and genes for growth rate in her offspring. While meat yield per sow is not a fundamental biological parameter, the
heritable variation in this parameter does reflect the
potential for genetic improvement of pork production, which is highly relevant to breeders. Moreover, a comparison of realized rates of improvement to the heritable variation
provides a measure of efficiency of breeding schemes.
Hence, a definition of heritable variation for output param-eters of production systems is relevant for breeders.
The importance of social organization is recognized in the biological sciences (Frank 2007), and appropriate quantita-tive genetic models of inheritance have been developed
(Hamilton 1964; Griffing 1981; Mooreet al.1997). Genetic
models accounting for indirect genetic effects, however, have yielded complex expressions for response to selection,
involv-ing multiple genetic variances and covariances (Griffing
1981; Kirkpatrick and Lande 1989; Mooreet al.1997; Wolf
et al.1998; McAdamet al.2002; Muir 2005; Bijma and Wade 2008; Wilsonet al.2009; McGlothlinet al.2010). In contrast to Equations 3a and 3b, those expressions do not partition the response into a parameter describing selection and a parame-ter reflecting heritable variation. Hence, while those
expres-sions have identified important factors in response to
selection, they do not reveal the intrinsic potential of a pop-ulation to respond to selection or provide a measure of the utilization of that potential.
A more general definition of heritable variation has been proposed for the special case of populations structured into groups of equal size, with a single category of individuals (Bijmaet al.2007). The expression for response to selection in Bijmaet al.(2007), however, does not distinguish herita-ble variation from selection and does not connect heritaherita-ble variation to common expressions for response such as
Equa-tions 3a and 3b. Ellen et al.(2007) show that response in
artificial sib selection schemes, with social interactions
among pen mates, can be expressed in terms of Equation
3b (see also Wade et al. 2010). In none of those cases,
however, has heritable variation been connected to the se-lection gradient expression for response to sese-lection
(Equa-tion 3b), and heritable varia(Equa-tion has not been defined for
emergent traits. Thus there are special cases indicating that
a general definition of heritable variation may exist, but it has not yet been identified.
In the following, I propose a general definition of the
heritable variation that determines a population’s potential to respond to selection. The result will have the same simple form as the classical expressions (Equations 3a and 3b), separating selection from heritable variation, but will reveal that heritable variation is not restricted by the phenotypic variation among population members. I provide an approach to derive this heritable variation, which can be applied to any level of organization. Application of this approach is illustrated using examples for natural and agricultural pop-ulations and is used to integrate two common models of maternal genetic effects.
Heritable Variation
Individual trait values can always be partitioned into a heritable component and a nonheritable residual, using the method of least squares (Fisher 1918; Lynch and Walsh 1998). The heritable component may arise not only from the focal individual’s own genes, but also from genes in its con-specifics. We can, therefore, represent an individual’s trait value, zi, as the sum of all heritable effects, PjAk;j, and
a nonheritable residual,ei,
zi¼X j
Ak;jþei; (4)
where i denotes the focal individual, jthe individual
con-tributing the heritable effectAk;jto the focal individual’s trait
value, and k indexes the different categories of heritable
effects underlying individual trait values. The summation is over all individuals affecting the focal individual’s trait value, includingj¼i, in which casekindicates direct effects and Ak;j the classical (direct) additive genetic effect due to
the focal individual’s own genes. In the following, it is as-sumed that the population structure remains the same over time, so that Equation 4 applies also in subsequent gener-ations. (Note that this assumption is not required in the classical prediction of response to selection.)
For example, juvenile growth rate in a mammal may be modeled as the sum of a heritable direct effect of the focal individual’s genes, a heritable maternal effect of its mother’s genes, and a nonheritable residual (Willham 1963). Then,j¼
1 denotes the focal individual,j¼2 its mother,k¼1 refers to direct genetic effects,k¼2 to maternal genetic effects, and the trait value is given by zi¼Adirect;iþAmaternal;motherðiÞþei. (SeeExample 4below for a treatment of maternal effects.)
In general, thePjAk;jin Equation 4 is the best predictor
of zi from the focal individual’s own genes (j=i) and the genes in its population members, defined using least squares (Fisher 1918). EachAk;jis the sum of the so-called average
effects of the genes in individualjonzi(Fisher 1918; Lynch
and Walsh 1998). k indexes average effects of genes by
indexes the individuals carrying the genes. Thus Ak;j is the
additive genetic effect of the genes for categorykin individ-ual jand is expressed in the phenotype of individual i. In total, thePjAk;jincludes the direct average effects of genes
iniand the indirect average effects of the genes in all pop-ulation members that affectzi.
Equation 4 does not imply additive gene action. Irre-spective of the mode of inheritance, one can always partition the resulting phenotype into heritable effects that are additive by construction, using the method of least squares (Fisher 1918). This is fundamental to quantitative genetics (Lynch and Walsh 1998).
By virtue of least squares,ei¼0 in Equation 4, so that the mean trait value equalsz¼ PA. Response to selection,i.e., the change in mean trait value due to a change in gene frequencies, therefore equals
DzA¼D
X
k
Ak; (5)
which is determined by the genes passed on to the next
generation. From the Robertson–Price theorem (Robertson
1966; Price 1970), the change in mean trait value ascribable
to selection equals the covariance with relative fitness,
DPkAk¼Covð
P
kAk;i;wiÞ. Because an individual passes
on its own genes, which may differ in part from the genes affecting its trait value, this covariance is between an indi-vidual’s relative fitness, wi, and the (direct and indirect) average effects of its own genes; hence it includes Ak;i,
rather than the Ak;j that affects the trait value of i. With
a maternal effect, for example, Ak;i refers to the genes for
maternal effect carried by i, whereas the trait value of i
depends onAk;motherðiÞ, which refers to the genes for mater-nal effect in its mother. The distinction between the
herita-ble components of an individual’s trait value and the
heritable effects that an individual passes on to the next generation is central to this work.
It follows from DPkAk¼Covð
P
kAk;i;wiÞ that an
indi-vidual’s value for response to selection is measured by the average effects of its own genes, summed over all heritable categories underlying individual trait values,
Hi¼X k
Ak;i; (6)
so thatDzA ¼DH. SinceHireflects an individual’s value for response to selection, it has been called the“total breeding
value” by Bijma et al. (2007), and I use that term in the
remainder of this article.Hiis entirely a heritable property of individual i, irrespective of whether or notAk;i is a
com-ponent ofzi. With a maternal effect, for example,Hi is the
sum of the direct and maternal breeding value of i, Hi¼
Adirect;iþAmaternal;i, even though the maternal breeding value
of i does not contribute to zi. (Hence, i may be a male.)
Finally, from the definition of a selection gradient,
bw;H¼Covðw;HÞ=s2H, response to selection is
DzA¼bw;H s2H; (7a)
where
s2 H¼Var
X
k Ak
: (7b)
bw;H is the regression coefficient of an individual’s relative
fitness on the summed average effects of its own genes, and
the heritable variation,s2
H, is the variance among individu-als in the summed average effects of their own genes. Thus, in contrast to phenotypic variance,s2
Hcannot contain
cova-riances between individuals. Equation 7a has the same form as Equation 3a, but is not restricted to classical average effects of genes. Note that the selection gradient in Equation 7a differs from the classical selection gradient, which is dis-cussed further in the section on utilization of heritable var-iation below.
While Equations 7a and 7b have been derived for individual trait values, they apply also to traits that cannot be attributed to a single individual, such as the number of
prey caught by a hunting pack. In that case, the iindex is
omitted fromziin Equation 4, but the PjAk;jstill specifies
the heritable effects on the trait.
Equation 7a predicts the ultimate response attributable to a selection. When social interactions act across generations, this response may not surface immediately in the next generation. Maternal effects, for example, result in time lags in the response, causing populations to continue evolving after selection ceases and creating dynamic patterns over time (Kirkpatrick and Lande 1989). Equation 7a, however, predicts the permanent response due to the allele frequency change created by a selection, after transient effects have decayed away (seeExample 4); it is not intended to capture transient effects. Hence, the heritable variance in Equation
7b reflects the potential of a population for a permanent
genetic change in trait value due to selection.
The expression for response to selection common in breeding, Equation 3b, can be generalized in the same way. Consider selection for a criterionx. Response to selec-tion follows from regressingHonx,DzA¼DH¼bH;xðxs2xÞ, wherebH;xis the regression coefficient ofHonx, andðxs2xÞ is the selection differential. Substituting bH;x¼CovðH;xÞ=
VarðxÞ, usingðxs2xÞ ¼isx, and multiplying both numerator
and denominator bysHyield
DzA¼irsH: (7c)
Just as Equation 2b, this expression is an approximation
whenHandxdo not follow a bivariate normal distribution.
level of organization. The classical expression appears as a special case, obtained when trait values depend on direct genetic effects only. This work, therefore, shows that the classical expressions for heritable variation and response to selection can be generalized to include traits affected by genes in multiple individuals, which have so far been treated as special cases (Griffing 1981; Kirkpatrick and Lande 1989;
Moore et al. 1997; Wolf et al. 1998; McAdam et al. 2002;
Muir 2005; Bijma and Wade 2008; Wilson et al. 2009;
McGlothlinet al.2010).
Equation 7b represents a general definition of the
heritable variation that determines a population’s potential to respond to selection, s2
H, which is the variance among
individuals in the average effects of their genes, summed over all heritable categories underlying individual trait val-ues. The selection gradient,bw;H, in turn, expresses the
ex-tent to which selection acts on this full heritable variation. The following shows examples of application of Equations
7a–7c, followed by a section on mechanisms determining
the selection gradient.
Examples
The following examples serve to illustrate the meaning of Equations 7a–7c and demonstrate their application; they are not intended to accurately capture all biological detail of the cases considered. Example 4 also integrates the maternal-effect model of Willham (1963) with that of Falconer (1965) and Kirkpatrick and Lande (1989).
Example 1—interactions among trees
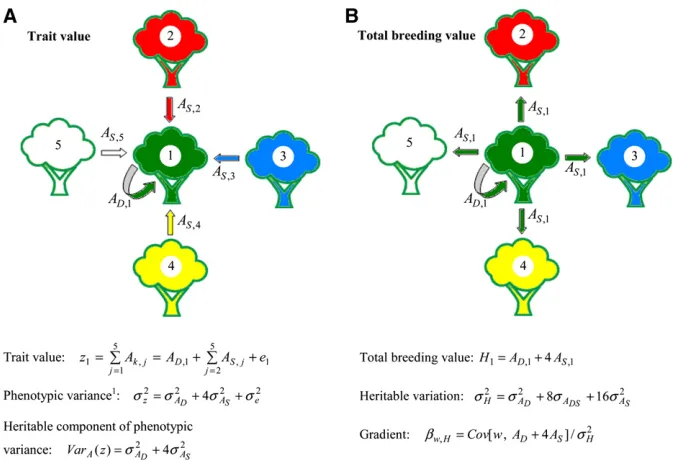
In Figure 1a, the trait value of focal tree 1 depends on the direct genetic effect of the focal tree itself and the indirect
genetic effects of its neighbors, trees 2–5, z1¼
P5
j¼1Ak;j¼AD;1þ
P5
j¼2AS;jþe1, wherek=Drefers to direct
genetic effects, andk=Sto indirect genetic effects (“social effects”) (after Muir 2005). When trees are unrelated, phe-notypic variance equals s2
z ¼s2ADþ4s2ASþs2e, so that the
additive genetic component of phenotypic variance equals VarAðzÞ ¼s2
ADþ4s2AS. When each tree has four neighbors, this model applies to all trees and response to selection equalsDzA¼DADþ4DAS.
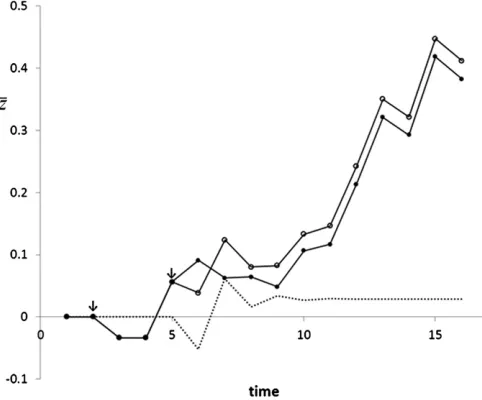
The total breeding value of the focal tree equals its total heritable effect, summed over all heritable categories (Figure 1b). Since each tree has four neighbors, this is the direct genetic effect of the focal individual on its own trait value plus its total indirect genetic effect on the trait values of its four neighbors, Hi¼AD;iþ4AS;i. Hence, response to
selection equals the change in mean total breeding value of the population,DzA¼DH. The heritable variation available
for response to selection equals the variance in H among
individuals, s2
H¼s2ADþ8sADSþ16s
2
AS. s2H differs from the
additive genetic component of phenotypic variance,
s2
H6¼VarAðzÞ. This difference arises because H is entirely a genetic property of the focal individual, whereas the focal
individual’s trait value depends on multiple individuals.
Comparison of s2
H and VarAðzÞ clearly shows that indirect
genetic effects contribute substantially more to the heritable variance that determines potential response to selection (16s2
AS) than to phenotypic variance (4s 2 AS).
The selection gradient is the regression coefficient of an individual’s relative fitness on its total breeding value,
bw;H¼Cov ½w;ADþ4AS=s2H, and response to selection fol-lows from Equations 7a–7c. Thebw;H depends not only on the selection process, but also on relatedness between inter-acting trees (Equations 8a–8d below).
Example 2—adult body weight in the African wild dog
dominant female usually breeds, while subordinates help to raise the pups. Packs hunt collectively, but the alpha female usually stays behind to guard her pups. The hunters share the prey with the pups and their mother. Adult body weight ranges from 18 to 28 kg, and relatedness among pack
mem-bers averages 0.3 (Creel and Creel 2002).
On the basis of the social organization, an individual’s adult body weight may depend on a direct genetic effect of its own, AD;i, a maternal genetic effect of its mother,
AM;motherðiÞ, and the indirect genetic effects its pack mates,
P
j¼1;nAS;j, wherejdenotes an adult pack member,nadult
pack size excluding the alpha female, andSindirect effects,
zi¼
X
j
Ak;j¼AD;iþAM;motherðiÞþ
X
j¼1;n
AS;jþei:
Maternal effects may, for example, relate to the maternal care and milk provided by the mother, whereas indirect effects of pack mates may relate to their hunting success and willingness to share prey.
The additive genetic component of phenotypic variance equals VarAðzÞ= VarðAD;i+AM;motherðiÞ+Pj¼1;nAS;jÞ. Using
a relatedness of 0.5 between mother and offspring and of 0.3 between pack members yields
VarAðzÞ ¼VarðADÞ
þ CovðAD;AMÞ þVarðAMÞ
þ 0:6n CovðAD;ASÞ þ0:6n CovðAM;ASÞ
þ ð0:3n2þ0:7nÞ VarðASÞ:
From the genetic mean trait value, it follows that response to selection equalsDzA ¼D½ADþAMþn AS. Thus the total breeding value equals
Hi¼X k
Ak;i¼AD;iþAM;iþn AS;i:
The heritable variance determining the population’s poten-tial to respond to selection, therefore, equals,
s2
H¼ VarðADÞ
þ 2 CovðAD;AMÞ þVarðAMÞ
þ 2n CovðAD;ASÞ þ2n CovðAM;ASÞ þn2 VarðASÞ :
Comparison of the expressions for VarAðzÞ and s2
H clearly shows that indirect genetic effects of pack mates contribute substantially more to heritable variation for response than to additive genetic variance: n2 VarðA
SÞ ¼ 49 VarðASÞ ?
ð0:3n2þ0:7nÞ VarðA
SÞ ¼19:6 VarðASÞ.
Estimated genetic parameters for direct, maternal, and indirect effects on adult body weight in the African wild dog are not available. An indication of the difference
betweens2
Hand VarAðzÞmay, however, come from domestic
pigs for which estimates have been published, yielding VarðADÞ=VarðzÞ ¼0.21 and VarðASÞ=VarðzÞ ¼0.007 (Bergsma
et al. 2008). Estimates for maternal effects are commonly
VarðAMÞ=VarðzÞ ¼ 0.04 in domestic pigs (Johnson et al. 2002). Using these values, genetic covariances of zero, and a pack size of 7 yieldss2
H=s2z = 0.59, whereas VarAðzÞ=s2z ¼
0.39, and ordinary heritability,h2 5s2
AD=s2z ¼0.21. This
sug-gests that the heritable variation for response to selection may
be 50% greater than the additive genetic component of
phenotypic variance, and 180% greater than the ordinary
(direct) additive genetic variance. This number is probably conservative, since social interactions are much more critical in African wild dogs than in domestic pigs. No unaided pair of wild dogs has, for example, been observed to raise pups (Creel and Creel 2002), whereas nursing sows are usually kept in-dividually in pig herds. Moreover, there is clear opportunity for heritable variance to exceed phenotypic variance. For packs of 14 adults and genetic parameters as above, for ex-ample,s2
H=s2z ¼1.62. The selection gradient for this example
is a complex expression and is not given here, but follows from Equation 10 below.
Example 3—genetic improvement in pig breeding
Livestock genetic improvement aims to increase the effi
-ciency of food production for human consumption. The
prospects for genetic improvement are reflected by the
heritable standard deviation in output parameters of agri-cultural production systems. Consider, for example, a sow line in an integrated pork production system. (In pig breeding, the mothers of fattening pigs come from a breed-ing line specialized for reproduction traits, known as a sow line, whereas the fathers come from a line specialized for growth traits.) Because farm size is usually measured by the number of sows, interest is in the total amount of meat produced from a sow, which is the product of offspring number (n) and offspring meat yield (y),
z¼n y:
Offspring number is genetically determined by the sow, whereas offspring meat yield has both a direct and a mater-nal genetic component (Rothschild and Ruvinsky 1998). Meat yield per sow, therefore, is an emergent trait that can-not be attributed to a single individual.
Linearization at the current average trait values, using afirst-order bivariate Taylor series, yields
zn yþy nþconstant:
Thus response due to selection in the sow line equals
DzA¼n
1
2DAyDþDAy M
þy DAn;
where D and M indicate direct and maternal effects on meat yield, respectively, and the1
response in fattening pigs due to selection in the sow line equals
Hi¼nð12AyD;iþAyM;iÞ þy An;i;
and response equalsDH. Because individuals transmit their own genes to the next generation,Hirefer to genes in a sin-gle individual, even though meat yield depends on multiple individuals (the sow and her offspring). Heritable variation equals the variance inHi,
s2 H¼
1 4n
2 VarðAy DÞ þn
2 CovðAy
D;AyMÞ þn
2 VarðAy MÞ
þn y CovðAyD;AnÞ þ2n y CovðAyM;AnÞ
þy2VarðAnÞ;
where variances and covariances are ordinary additive genetic (co)variances. Finally, response to selection equals
DzA¼irsH, where the accuracy, r, is the correlation
be-tween the selection criterion and theH-values in the candi-dates for selection, which measures the quality of the selection criterion.
With an additive genetic relatedness of 0.5 between mother and offspring, the additive genetic component of phenotypic variance equals
VarAðzÞ ¼n2VarðAyDÞ þn
2 CovðAy D;AyMÞ
þn2 VarðAyMÞ þn y CovðAyD;AnÞ
þ2n y CovðAyM;AnÞ þy
2VarðAnÞ;
which differs from s2
H. Hence, also this example illustrates that partitioning phenotypic variance into an additive ge-netic and residual component may not yield the heritable variance for response to selection, as already observed by Willham (1963).
Example 4—maternal effects and time dynamics of response
Kirkpatrick and Lande (1989) showed that maternal inher-itance creates time lags in response to selection, causing dynamic response patterns over time. The following illustrates that Equation 7b provides the heritable variance also for such traits. This heritable variation refers to the ultimate response attributable to a selection, excluding transient effects and tem-porary dynamics. As a second objective, this example integra-tes the maternal-effect model of Willham (1963) with that Falconer (1965) and Kirkpatrick and Lande (1989).
Following Falconer (1965), Kirkpatrick and Lande (1989) considered a maternal effect that is a simple linear regression on maternal trait value,
zi¼Aiþeiþm zmotherðiÞ;
where zi is the trait value of individual i, Ai the ordinary direct breeding value ofi,eithe (direct) environmental
com-ponent ofzi,mthe partial regression coefficient of offspring trait value on maternal trait value, with jm j ,1, andzmotherðiÞ
the trait value of the mother ofi. As above, thes2
H follows
from identifying the heritable component of the trait mean and treating this as a property of a single individual. Re-peatedly substituting zmotherðiÞ by the expression for zi, ig-noring nongenetic effects, and assuming that genetic parameters remain constant over time yield
zA;i ¼ Ai þ mAmotherðiÞþm2Agr-motherðiÞþm3Agr-gr-motherðiÞþ::::
/zA ¼ AþmAþm2Aþm3Aþ::::
/Hi ¼ nlim/N Aið1þmþm2þm3þ:::þmnÞ ¼ Ai
12m:
Thus the heritable standard deviation determining potential response to selection equals
sH¼ sA
ð12mÞ:
This result shows that positive feedback of maternal trait value on offspring trait value (m.0) increases the heritable variation available for response to selection.
Whetherm.0 increases the actual response to selection
will depend also on the selection process. Falconer (1965) and Kirkpatrick and Lande (1989) considered direct selec-tion on offspring trait value,
wi¼bt zi;
where bt is the ordinary gradient of individual fitness on
individual trait value in generationt. The standardized total gradient in generationtfollows from regression ofHionwi. Using CovðA;zÞ ¼2s2
A=ð22mÞand a mother–offspring relat-edness of 0.5 yields
bw;HðtÞ sH¼ 2bt sA
ð22mÞ:
This result shows that positive feedback of maternal trait value on offspring trait value (m.0) increases the strength of direct selection. The denominator of this expression ac-tually equals 2ð12ri;mothermÞ, indicating that a mother– offspring relatedness .0.5 inflates the effect of feedback (i.e., m6¼0) on the strength of selection. This occurs, for example, when mating is preferentially between kin.
The ultimate response due to selection in generation t,
excluding transient effects and temporary dynamics, equals
bw;HðtÞ s2H, giving
DzA;NðtÞ ¼ 2bts 2 A
ð22mÞð12mÞ:
This result shows that m. 0 increases response to direct
expression is identical to the result of repeatedly applying Equation 3 of Kirkpatrick and Lande (1989) to remove tran-sient effects (Appendix B). Figure 2 illustrates that the
re-sponse of a single selection in generation t asymptotes to
this value, irrespective of selection in later generations.
The relationship between Willham’s and Falconer’s models:
In the main results of this work, I have used Willham’s
(1963) maternal-effects model to illustrate the meaning of
expressions. Willham’s model ignores the time dynamics
of response, but predicts the same asymptotic response as
Falconer’s (1965) model. Both models are well known and
widely used (Lynch and Walsh 1998) and are related as follows (using W63 and F65 to indicate parameters referring to Willham’s model and Falconer’s model, respectively):
AD;W63¼AF65;
AM;W63¼AF65
m
12m;
H¼AD;W63þAM;W63¼
AF65
12m
s2
AD;W63¼s2A;F65;
sADM;W63¼s2A;F65
m
12m;
s2
AM;W63¼s2A;F65
m2
ð12mÞ2;
s2
H¼s2AD;W63þ2sADM;W63þs2AM;W63¼ s2
A;F65
ð12mÞ2:
Depending on the sign ofm, Falconer’s model corresponds
to a direct-maternal genetic correlation of either +1 or–1 in
Willham’s model. When individualfitness is determined by
individual trait value,wi¼bzi , then the standardized total selection gradient is given by
bw;H sH¼b s2
AD;W63þ ð3=2ÞsADM;W63þs 2 AM;W63
sH ¼b
sA;F65
ð120:5mÞ;
and the permanent response to selection by
DzA;N¼b½s2AD;W63þ
3
2sADM;W63þs
2 AM;W63 ¼
2b s2A;F65
ð22mÞð12mÞ:
Utilization of Heritable Variation
As shown above, the standardized selection gradient of relative fitness on total breeding value, bw;HsH, measures the utilization of heritable variation. This standardized gra-dient differs from the classical gragra-dient of individualfitness on individual trait value. Previous work on indirect genetic effects has shown that relatedness between individuals and selection between groups rather than individuals may
con-siderably increase response to selection (Griffing 1967,
1976, 1977; Wade 1977; Muir 1996, 2005; Craig and Muir 1996). This suggests that relatedness and multilevel selec-tion are important determinants of bw;HsH. The following
first illustrates the effects of relatedness and multilevel se-lection onbw;HsHin populations structured into groups, and subsequently considers the general case.
Natural selection
Consider a population structured into a large number of groups of nindividuals each, where indirect genetic effects of group mates affect individual trait values,
zi¼AD;iþ
Xn
j¼2
AS;jþei;
as inExample 1. Moreover, suppose that selection is a func-tion of individual trait value and the summed trait values of
alln–1 group mates,
Figure 2 Evolution of mean trait value with a maternal effect. Selection starts at generation 2 for both populations. The selection gradients are the same for both populations and are randomly sampled from a uniform distribution between 0 and 0.4. For the population indicated with solid circles, selection ceases in generation 5 (b5¼0) and continues in gener-ation 6. The dotted line is the difference in mean trait value between both populations and represents the response of the selection in generation 5 for the population indicated with open circles. Response initiallyfl uctu-ates due to transient effects, but stabilizes at a value of 0.0289. Inputs are s2
wi¼b ðziþgX n21
zjÞ:
Thegrepresents the degree of between-group selection
rel-ative to individual selection; it is the ratio of the selection gradient on the summed trait values of group mates over the selection gradient on individual trait value. A g= 0
repre-sents individual selection, and ag = 1 full between-group
selection (Bijma and Wade 2008). Combining Equation 15
of Bijma and Wade (2008) with Equation 7a, using r to
denote additive genetic relatedness between group mem-bers, yields the following expressions for the standardized total selection gradient. For individual selection with unre-lated group members (g,r= 0),
bw;HsH¼ s2
ADþ ðn21ÞsADS
sH b:
(8a)
For individual selection (g = 0) with related group
mem-bers,r2 ½0⋯1,
bw;HsH¼
rs2
Hþ ð12rÞ½s2ADþ ðn21ÞsADS
sH b: (8b)
For multilevel selection, g2 ½0⋯1, with unrelated group
members (r= 0),
bw;HsH¼
gs2
Hþ ð12gÞ½s2ADþ ðn21ÞsADS
sH b; (8c)
and for multilevel selection with related group members,
bw;HsH
¼½gþrþ ðn22Þgrs
2
Hþ ð12gÞð12rÞ½sA2Dþ ðn21ÞsADS
sH b:
(8d)
In those expressions, s2
AD is the variance of direct genetic effects,sADS the covariance between direct and indirect ge-netic effects, andbthe ordinary selection gradient.
The effects of relatedness and/or multilevel selection on the utilization of heritable variation follow from the partial derivatives ofbw;HsHwith respect togorr. For example, the partial derivative of Equation 8b with respect torequals
@ðbw;HsHÞ
@r ¼ ðn21ÞsADSþ ðn21Þ
2s2 AS:
This derivative takes positive values whenever
rADS. 2 ðn21Þ
sAS
sAD
;
whererADS is the genetic correlation between direct and in-direct genetic effects. This condition will probably be
satis-fied in most cases, except when group sizes are small,
indirect genetic effects have little variance and are strongly negatively correlated with direct genetic effects. For
exam-ple, when n = 4, sAD¼1, and sAS ¼0:3, relatedness
increases the standardized total gradient whenrADS.20:9. Because Equation 8d is symmetric with respect togandr, the effect of between-group selection on bw;HsH may seem to be identical to that of relatedness. However, at the same overall strength of selection, stronger between-group selec-tion reduces the ordinary selecselec-tion gradientb, which in turn reducesbw;HsH. This issue is investigated further in the next section.
Artificial selection
With artificial selection, the accuracy reflects the utilization of heritable variation by the breeder. (The intensity of selection merely reflects the overall strength of selection.) The above case may be investigated in the context of artificial selection by replacingfitness by a selection index of its own trait value and the summed trait values of group mates,
Ii¼ziþgX n21
zj:
The accuracy of this index equals
rI;H¼
½gþrþðn22Þgrs2Hþð12gÞð12rÞ½s2ADþðn21ÞsADS
sI sH :
(9)
Note that the second term in the numerator may take negative values when direct and indirect genetic effects are
negatively correlated, whereas the first term is always
positive. In the denominator, the sI increases with related-ness between group mates and particularly with the degree of between-group selection (Appendix C).
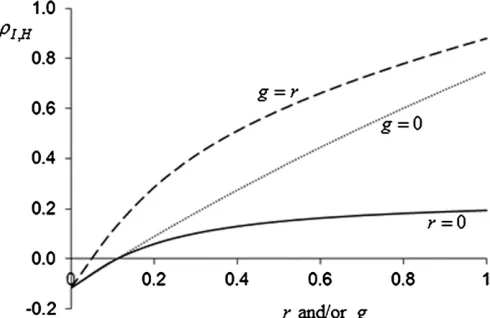
Figure 3 shows that accuracy increases much more with relatedness than with between-group selection. This occurs
because an increase in g strongly increases the sI in
Figure 3 The effect of between-group selection (g) and/or relatedness (r) on the accuracy of selection (rI;H). Solid line:r= 0,g2 ½0⋯1. Dotted line:
r2 ½0⋯1,g= 0. Dashed line:g¼r2 ½0⋯1. Input values aren¼8, s2
zD¼1, s 2
zS¼0:2, h 2
Equation 9. This is the same phenomenon as the reducing effect of between-group selection on the magnitude of the ordinary selection gradient, mentioned above. In most cases, therefore, relatedness can contribute more to the utilization of heritable variation than multilevel selection.
Generalization
The above considered the special case where population members interact within groups. The following investigates whether general statements about the utilization of herita-ble variance can be made.
Since any trait can be decomposed into additive effects using the method of least squares, this decomposition can be applied also tofitness,
wi¼X j9
Awl;j9þewl;
wherej9denotes the individual contributing thejth heritable effect, Awl;j9, to the focal individual’s fitness, l indexes the
different categories of heritable effects on fitness, and the summation is over all individuals affecting the focal individ-ual’sfitness, including the focal individual itself. (For mul-tilevel selection in group-structured populations, the
relationship between the elements of wi and the selection
parameters is given in Equation 11 and Table 2 of Bijma and
Wade 2008). Because heritable effects onfitness may have
a different origin from those on trait values, the indexing in thefitness model,j9andl, differs from that in the trait model (j andk, Equation 4). From the Robertson–Price theorem, response to selection equalsDzA¼CovðHi;wiÞ. Substituting
Hiby Equation 6, and using CovðAk;iAwl;j9Þ ¼rij9CovðAk;AwlÞ,
yields
DzA¼ X
k
X
l
rij9CovðAk;AwlÞ; (10)
where rij9 is the additive genetic relatedness between the
focal individual andj9, and CovðAk;AwlÞ is the ordinary ad-ditive genetic covariance (i.e., within individuals) between the kth heritable component of the trait value and the lth heritable component offitness.
Equation 10 reveals two points of interest. First, response to selection depends on relatedness between the focal individual and the individuals affecting its fitness,rij9, not
on relatedness with the individuals affecting its trait value,
rij. This makes sense in the light of the Robertson–Price equation. (Of course, those individuals may partly or en-tirely be the same.) Second, when relatednessrij9 takes
pos-itive values, the direction of response in a component of the trait value is the same as the sign of the within-individual
covariance of that trait component with fitness. In other
words, if rij9 . 0, then the response DAk originating from
the lth fitness component is positive when CovðAk;AwlÞ is positive and negative when CovðAk;AwlÞ is negative.
Con-versely, when rij9 , 0, then the response DAk originating
from the lth fitness component is negative when
CovðAk;AwlÞ is positive and positive when CovðAk;AwlÞ is negative. [Negative relatedness may occur because related-ness is a measure of correlation, which is zero on average by definition. It merely means that both individuals have below
average additive genetic similarity (Powell et al. 2010).]
Hence, this result shows that relatedness works to change trait values in the direction of increasedfitness, suggesting that relatedness between the focal individual and the indi-viduals affecting its fitness causes an adaptive response to selection. This result agrees with the observation of Bijma (2010), who showed that relatedness contributes to a posi-tive response infitness when individuals interact.
Discussion
In this work a definition has been proposed of the heritable variance that determines the potential of a population to respond to selection. In this definition, heritable variance equals the variance among individuals in the heritable quantity that determines the mean trait value of the popula-tion, rather than the additive genetic component of
pheno-typic variance. This definition encompasses both traits
affected by the focal individual’s genes only, in which case heritable variance equals the ordinary additive genetic vari-ance and traits depending on heritable effects originating from multiple individuals. This work, therefore, generalizes the classical definition of heritable variance and the usual quanti-tative genetic expressions for response to selection to cases where trait values depend on genes in multiple individuals.
Because individuals transmit the genes they carry them-selves, the heritable variance relevant for response to selection may differ from the additive genetic component of phenotypic variance, which may originate in part from genes in others. As a consequence, the heritable variance in traits that depend on genes in multiple individuals is not limited to phenotypic variance, which is a fundamental difference from classical theory (Fisher 1918; Lynch and Walsh 1998). For such traits, heritable variance may exceed the phenotypic variance among population members and has no theoretical upper bound. This result implies that social organization may allow populations to evolve faster by natural or artificial selection.
The partitioning of response to selection into contribu-tions from heritable variation and selection facilitates re-search aiming to identify the mechanisms that determine the utilization of heritable variation by natural or artificial selection. The standardized total selection gradient,bw;H sH, is a scale-free measure of the utilization of heritable variation. Thebw;H differs from the classical selection gradient of indi-vidualfitness on individual trait value and depends on relat-edness between individuals and the levels of selection. Equation 10 shows that positive relatedness causes trait values to respond in the direction of increasedfitness.
Breeders want to know how much genetic improvement is possible in principle and to be able to assess the quality of their breeding programs. The heritable variation, as defined
in Equation 7b, reflects the genetic improvement that is
possible in principle. An efficient breeding scheme generates
1 unit sH response per generation. While heritable
varia-tion is a biological property of the populavaria-tion that is outside the breeder’s control, accuracy of selection depends on the breeding design and can be optimized. Hence, accuracy is an important quality criterion for a breeding scheme. This work has generalized the definition of accuracy, to include traits affected by genes in multiple individuals.
The definition of heritable variance provided here also
explains in a natural way why certain heritable traits cannot respond to selection. Consider, for example, the rank of racing horses. The mean rank cannot respond to selection, because it is fully determined by the number of competitors. With eight competitors, for example, the mean rank is always 4.5. Racing ability nevertheless shows additive genetic variance (Langlois 1980). While it is obvious that rank cannot respond to selection, this case violates the or-dinary quantitative genetic expression for response to selec-tion (Equaselec-tion 3). Equaselec-tion 7b, however, reveals that heritable variance in rank is zero. This occurs because a 1-unit increase in an individual’s rank always decreases the
average rank of its n21 competitors by an exact amount
of21=ðn21Þ. The variance in indirect genetic effects, there-fore, equals 1=ðn21Þ2 times the variance in direct genetic effects, and the correlation between direct and indirect ge-netic effects equals–1. Substitution into Equation 7b shows that heritable variance equals zero:s2
H =s2AD –2ðn21Þs 2 AD=
ðn21Þ+ðn21Þ2s2
AD=ðn21Þ 2
= 0. While the mean rank can-not respond to selection, the model allows for response to selection in the underlying direct and indirect genetic effects; individuals can, for example, become more competi-tive. Wilsonet al.(2011) applied a similar approach to genet-ically analyze dyadic interactions in Scottish deer. This
approach may also be used to genetically analyze fitness in
populations where meanfitness cannot respond to selection
because population size is limited by the carrying capacity of the environment, which is very common.
Acknowledgments
I thank J. Bruce Walsh, Antti Kause, Duur K. Aanen, Johan A. M. van Arendonk, Martien A. M. Groenen, Michael Grossman, James H. Hunt, Hans Komen, Ole Madsen, Arie J. van Noordwijk, Elisabeth H. van der Waaij, and Michael J. Wade for reviewing drafts of this manuscript. This research
was financially supported by the Dutch Science Council and
was coordinated by the Netherlands Technology Foundation.
Literature Cited
Bergsma, R., E. Kanis, E. F. Knol, and P. Bijma, 2008 The
contri-bution of social effects to heritable variation infinishing traits of
domestic pigs (Sus scrofa). Genetics 178: 1559–1570.
Bijma, P., 2010 Fisher’s fundamental theorem of inclusivefitness
and the change infitness due to natural selection when
conspe-cifics interact. J. Evol. Biol. 23: 194–206.
Bijma, P., and M. J. Wade, 2008 The joint effects of kin, multilevel
selection and indirect genetic effects on response to genetic
selection. J. Evol. Biol. 21: 1175–1188.
Bijma, P., W. M. Muir, and J. A. M. Van Arendonk, 2007 Multilevel
selection 1: quantitative genetics of inheritance and response to
selection. Genetics 175: 277–288.
Chenoweth, S. F., H. D. Rundle, and M. W. Blows, 2010 Experimental
evidence for the evolution of indirect genetic effects: changes in the
interaction effect coefficient, PSI (C), due to sexual selection.
Evo-lution 64: 1849–1856.
Craig, J. V., and W. M. Muir, 1996 Group selection for adaptation
to multiple-hen cages: beak-related mortality, feathering, and
body weight responses. Poult. Sci. 75: 294–302.
Creel, S., and N. M. Creel, 2002 The African Wild Dog: Behavior,
Ecology and Conservation. Princeton University Press, Princeton, NJ.
Crespi, B. J., 2001 The evolution of social behaviour in
microor-ganisms. Trends Ecol. Evol. 16: 178–183.
Dawkins, R., 1982 The Extended Phenotype. Oxford University
Press, Oxford.
Ellen, E. D., W. M. Muir, F. Teuscher, and P. Bijma, 2007 Genetic
improvement of traits affected by interactions among
individu-als: sib selection schemes. Genetics 176: 489–499.
Falconer, D. S. 1965 Maternal effects and selection response, pp.
763–774 inGenetics Today, Proceedings of the XIth International
Congress on Genetics, Vol. 3, edited by S. J. Geerts. Pergamon, New York.
Falconer, D. S., and T. F. C. Mackay, 1996 Introduction to
Quan-titative Genetics, Ed. 4. Longman, London.
Fisher, R. A., 1918 The correlation between relatives on the
sup-position of Mendelian inheritance. Trans. R. Soc. Edinb. 52:
399–433.
Frank, S. A., 1998 Foundations of Social Evolution. Princeton
Uni-versity Press, Princeton, NJ.
Frank, S. A., 2007 All of life is social. Curr. Biol. 17(16): R650.
Griffin, A. S., S. A. West, and A. Buckling, 2004 Cooperation and
competition in pathogenic bacteria. Nature 430: 1024–1027.
Griffing, B., 1967 Selection in reference to biological groups. I.
Individual and group selection applied to populations of
unor-dered groups. Aust. J. Biol. Sci. 20: 127–142.
Griffing, B., 1976 Selection in reference to biological groups. VI.
Analysis of full sib groups. Genetics 82: 723–731.
Griffing, B., 1977 Selection for populations of interacting
genotypes, pp. 413–434 in Proceedings of the International
Conference on Quantitative Genetics, edited by E. Pollak, O. Kempthorne, and T. B. Bailey. Iowa State University Press, Ames, IA.
Griffing, B., 1981 A theory of natural-selection incorporating
in-teraction among individuals. 2. Use of related groups. J. Theor.
Biol. 89: 659–677.
Haldane, J. B. S., 1932 A mathematical theory of natural and
artificial selection. Part IX. Rapid selection. Proc. Camb. Philos.
Soc. 28: 244–248.
Hamilton, W. D., 1964 The genetical evolution of social
behav-iour. J. Theor. Biol. 7: 1–16.
Johnson, Z. B., J. J. Chewning, and R. A. Nugent, III,
2002 Maternal effects on traits measured during postweaning
performance test of swine from four breeds. J. Anim. Sci. 80:
1470–1477.
Karban, R., 2008 Plant behaviour and communication. Ecol. Lett.
11: 727–739.
Kirkpatrick, M., and R. Lande, 1989 The evolution of maternal
characters. Evolution 43: 485–503.
Lande, R., and S. J. Arnold, 1983 The measurement of selection
Langlois, B., 1980 Heritability of racing ability in thoroughbreds:
a review. Livest. Prod. Sci. 7: 591–605.
Lush, J. L., 1937 Animal Breeding Plans. Iowa State University
Press, Ames, IA.
Lynch, M., and J. B. Walsh, 1998 Genetics and Analysis of
Quan-titative Traits. Sinauer Associates, Sunderland, MA.
McAdam, A. G., S. Boutin, D. Réale, and D. Berteaux,
2002 Maternal effects and the potential for evolution in a
nat-ural population of animals. Evolution 56: 846–851.
McGlothlin, J. W., A. J. Moore, J. B. Wolf, and E. D. Brodie III.
2010 Interacting phenotypes and the evolutionary process.
III. Social evolution. Evolution 64: 2558–2574.
Moore, A. J., E. D. Brodie III. and J. B. Wolf, 1997 Interacting
phenotypes and the evolutionary process. I. Direct and indirect
genetic effects of social interactions. Evolution 51: 1352–1362.
Muir, W. M., 1996 Group selection for adaptation to multiple-hen
cages: selection program and direct responses. Poult. Sci. 75:
447–458.
Muir, W. M., 2005 Incorporation of competitive effects in forest
tree or animal breeding programs. Genetics 170: 1247–1259.
Powell, J. E., P. M. Visscher, and M. E. Goddard, 2010 Reconciling
the analysis of IBD and IBS in complex trait studies. Nat. Rev.
Genet. 11: 800–805.
Price, G. R., 1970 Selection and covariance. Nature 227: 520–521.
Rausher, M. D., 1992 The measurement of selection on
quantita-tive traits: biases due to environmental covariances between
traits andfitness. Evolution 46: 616–626.
Rice, S. H., 2004 Evolutionary Theory: Mathematical and
Concep-tual Foundations. Sinauer Associates, Sunderland, MA.
Robertson, A., 1966 A mathematical model of the culling process
in dairy cattle. Anim. Prod. 8: 95–108.
Rothschild, M. F., and A. Ruvinsky, 1998 The Genetics of the Pig.
CAB International, Wallingford, Oxon, UK.
Stuard, A., and J. K. Ord, 2004 Kendall’s Advanced Theory of
Sta-tistics(Distribution Theory, Vol. 1). Hodder Education, London.
Wade, M. J., 1977 An experimental study of group selection.
Evo-lution 31: 134–153.
Wade, M. J., P. Bijma, E. D. Ellen, and W. M. Muir, 2010 Group
selection and social evolution in domesticated animals. Evol.
Appl. 3: 453–465.
West, S. A., A. S. Griffin, A. Gardner, and S. P. Diggle, 2006 Social
evolution theory for microorganisms. Nat. Rev. Microbiol. 4:
597–607.
West-Eberhard, M. J., 2003 Developmental Plasticity and
Evolu-tion. Oxford University Press, Oxford.
Wheeler, W. M., 1933 Colony Founding Among Ants,with an
Ac-count of Some Primitive Australian Species. Harvard University Press, Cambridge, MA.
Willham, R. L., 1963 The covariance between relatives for
char-acters composed of components contributed by related
individ-uals. Biometrics 19: 18–27.
Wilson, A. J., U. Gelin, M.-C. Perron, and D. Reale, 2009 Indirect
genetic effects and the evolution of aggression in a vertebrate
system. Proc. Biol. Sci. 276: 533–541.
Wilson, A. J., M. B. Morrissey, M. J. Adams, C. A. Walling, F. E.
Guinnesset al., 2011 Indirect genetics effects and evolutionary
constraint: an analysis of social dominance in red deer, Cervus
elaphus. J. Evol. Biol. 24: 772–783.
Wolf, J. B., E. D. Brodie III. J. M. Cheverud, A. J. Moore, and M. J.
Wade, 1998 Evolutionary consequences of indirect genetic
ef-fects. Trends Ecol. Evol. 13: 64–69.
Wright, S., 1937 The distribution of gene frequencies in
popula-tions. Proc. Natl. Acad. Sci. USA 23: 307–320.
Communicating editor: R Nielsen
Appendix A
This Appendix shows that the common expressions for re-sponse to selection used in evolutionary genetics and artificial breeding are equivalent under multivariate normality (Equa-tions 3a and 3b). Consider artificial selection for a criterion, say x, so that individual fitness is determined entirely by in-dividualx. Thus the effect of breeding value for the trait on individual fitness must arise entirely viax. Moreover, under multivariate normality, regressions are linear and represent conditional expectations (Stuard and Ord 2004). Thus the regression coefficient offitness on breeding value,bw;A, must equal the product of the regression coefficient of the selection criterion on breeding value, bx;A, and the regression coeffi
-cient offitness on the selection criterion,bw;x,
bw;A¼bx;Abw;x:
Next, in Equation 3b,DzA ¼irsA, the intensity of selection is the ratio of the selection differential over the standard deviation of the selection criterion (Falconer and Mackay 1996); i¼Sx=sx. From the Robertson–Price theorem, the
selection differential equals the covariance with relativefi t-ness, Sx¼Covðw;xÞ, giving i¼Covðw;xÞ=sx. Moreover,
from the definition of the correlation coefficient, the accu-racy equalsr¼CovðA;xÞ=ðsAsxÞ. Substituting these values
into Equation 3b yields DzA¼irsA=ððCovðw;xÞ=sxÞ
ðCovðA;xÞ=sAsxÞÞsA =ððCovðw;xÞ=s2xÞðCovðA;xÞ=s2AÞÞs2A = bw;xbx;AsA2 =bw;A s2A, which is Equation 3a.
Appendix B
This Appendix shows that the expression for response to
selection derived in Example 4is identical to the response
from repeatedly applying Equation 3 of Kirkpatrick and Lande (1989),
Dzt¼CovðA;zÞbtþmDzt21þms2zðbt2bt21Þ: (B1)
The last term in this expression is the phenotypic effect of the selection differential in the mothers on the trait value of their offspring and is therefore transient. The second term
is partly transient because it includes mDzt22þ
ms2
zðbt212bt22Þ. Thefirst term reflects the change in breed-ing value and is permanent. Interest is in the ultimate re-sponse ascribable to selection in generationt,DzA;NðtÞ, after
transient effects and temporary dynamics have decayed away. The DzA;NðtÞfollows from the difference in the
ulti-mate mean trait value between a population where selection
ceases after generation tand a population where selection
DzA;NðtÞ ¼ lim
n/N "
Xn
t¼t21
ðDztbt.t¼0Þ2
Xn
t¼t21
ðDztbt.t21¼0Þ
#
:
(B2)
From Equation B1, the series of responses when selection ceases after generationtis
Dzt¼btCovðA;zÞ þm ½Dzt21þ ðbt2bt21Þ s2z
Dztþ1¼mðDzt2bt s2zÞ
Dztþ2¼mDztþ1 ⋮
Dztþn¼mDztþn21:
The series of responses when selection ceases after gener-ationt21 is
Dzt¼0þm½Dzt212bt21s2z
Dztþ1¼mDzt
Dztþ2¼mDztþ1 ⋮
Dztþn¼mDztþn21:
Calculating Equation B2 yields DzA;NðtÞ= limn/N btCovðA;zÞ ð1þmþm2þm3þ:::þmnÞ, giving
DzA;NðtÞ ¼btCovðA;zÞ
12m :
Substituting CovðA;zÞ ¼2s2
A=ð22mÞyields
DzA;NðtÞ ¼ 2bts
2 A
ð22mÞð12mÞ;
which is identical to the result presented inExample 4.
Appendix C
This Appendix provides background information on Figure 3. Direct and indirect additive genetic (co)variances follow froms2
AD¼h
2 D s2PD,s
2
AS¼h
2
S s2PS, andsADS¼rADSsADsAS.
To-tal heritable variance equals s2
H¼s2ADþ2ðn21ÞsADSþ
ðn22Þ2s2
AS. Phenotypic variance equals s
2
z ¼s2PDþ
ðn21Þs2
PSþrðn21Þ½2sADSþ ðn22Þs 2
AS. The variance of the index equals s2
I ¼s2z þ2ðn21Þg Covðzi;zjÞþ g2ðn21Þ½s2zþ ðn22Þ Covðzi;zjÞ, in which Covðzi;zjÞ denotes the
pheno-typic covariance among group mates, which equals
Covðzi;zjÞ¼2sPDSþðn22Þs2PSþr ½s2ADþ2ðn22ÞsADSþ ðn22 3nþ 3Þs2