c
ESO 2003
Astrophysics
&
Hydrodynamic simulation of supernova remnants
including efficient particle acceleration
D. C. Ellison
1, A. Decourchelle
2, and J. Ballet
21 Department of Physics, North Carolina State University, Box 8202, Raleigh NC 27695, USA 2 Service d’Astrophysique, DSM/DAPNIA, CEA Saclay, 91191 Gif-sur-Yvette, France
e-mail:[email protected], [email protected]
Received 11 July 2003/Accepted 14 August 2003
Abstract.A number of supernova remnants (SNRs) show nonthermal X-rays assumed to be synchrotron emission from shock accelerated TeV electrons. The existence of these TeV electrons strongly suggests that the shocks in SNRs are sources of galactic cosmic rays (CRs). In addition, there is convincing evidence from broad-band studies of individual SNRs and elsewhere that the particle acceleration process in SNRs can be efficient and nonlinear. If SNR shocks are efficient particle accelerators, the production of CRs impacts the thermal properties of the shock heated, X-ray emitting gas and the SNR evolution. We report on a technique that couples nonlinear diffusive shock acceleration, including the backreaction of the accelerated particles on the structure of the forward and reverse shocks, with a hydrodynamic simulation of SNR evolution. Compared to models which ignore CRs, the most important hydrodynamical effects of placing a significant fraction of shock energy into CRs are larger shock compression ratios and lower temperatures in the shocked gas. We compare our results, which use an approximate description of the acceleration process, with a more complete model where the full CR transport equations are solved (i.e., Berezhko et al. 2002), and find excellent agreement for the CR spectrum summed over the SNR lifetime and the evolving shock compression ratio. The importance of the coupling between particle acceleration and SNR dynamics for the interpretation of broad-band continuum and thermal X-ray observations is discussed.
Key words.ISM: cosmic rays – acceleration of particles – shock waves – ISM: supernova remnants
1. Introduction
It is commonly believed that the shocks in supernova remnants (SNRs) produce the majority of galactic cosmic rays (CRs) with energies below ∼1015 eV via diffusive shock accelera-tion (e.g., Drury 1983; Blandford & Eichler 1987). Convincing support for the production of TeV electrons in SNRs comes from the synchrotron interpretation of nonthermal X-ray emis-sion (e.g., Reynolds 1998) observed in an increasing num-ber of young SNRs such as SN1006 (Koyama et al. 1995), Cas A (Allen et al. 1997), G347.3−0.5 (Slane et al. 1999), and RCW 86 (Borkowski et al. 2001)1.
In addition to their putative role in accelerating cosmic rays, the shocks in SNRs heat the ambient interstellar medium and ejecta to X-ray emitting temperatures. The interpretation of these X-ray observations leads to inferences for important
Send offprint requests to: D. Ellison,
e-mail:don [email protected]
1 As of this writing, there is no unambiguous evidence for the
pro-duction of TeV ions in SNRs (see Berezhko et al. 2002,for a discus-sion of SN1006 in this regard). The recent claim that TeV emisdiscus-sion from SNR RX J1713.7-3946 (also called G347.3−0.5) observed by CANGAROO II is from pion-decay (e.g., Enomoto et al. 2002) is still under debate (see, for example, Reimer & Pohl 2002; Butt et al. 2002).
quantities such as the supernova (SN) explosion energy, ejecta mass and composition, ambient densities, shock speed, and rate of electron and proton equilibration. That CR production and thermal heating in SNRs may be coupled comes from the fact that diffusive shock acceleration is intrinsically efficient in high Mach number shocks if even a small fraction of the shock heated plasma is injected into the acceleration process (e.g., Ellison & Eichler 1984; Jones & Ellison 1991; Berezhko & Ellison 1999; Malkov 1998; Blasi 2002).
If strong coupling between particle acceleration and shock heating occurs, the modeling of efficient particle acceleration in SNRs offers the possibility of using the high-quality X-ray and γ-ray data currently being collected by spacecraft (e.g.,
Chandra, XMM-Newton, INTEGRAL) to address
fundamen-tal questions concerning the SNR origin of CRs and the un-derlying physics of diffusive shock acceleration, particularly the injection of thermal particles into the acceleration pro-cess. Furthermore, strong coupling implies that the inferences made from X-ray observations may differ substantially be-tween interpretations which include particle acceleration self-consistently and those that do not.
and interpreted assuming that the shocks place an insignificant fraction of their energy in cosmic rays. Exceptions to this in-clude the early works of Chevalier (1983), Heavens (1984), and Boulares & Cox (1988). Chevalier (1983) investigated the effects of cosmic-ray pressure on SNR dynamics using a two-fluid, self-similar solution with an arbitrary fraction of thermal gas (adiabatic index γ = 5/3) and relativistic gas (γ = 4/3). More recent work has been done by Dorfi & B¨ohringer (1993) and Dorfi (1994). In our preliminary work (i.e., Decourchelle et al. 2000), we developed a model which coupled the approximate nonlinear (NL) acceleration calcula-tion of Berezhko & Ellison (1999) with an analytic, self-similar description of the SNR hydrodynamics (i.e., Chevalier 1983) and a non-equilibrium ionization calculation of X-ray emission (e.g., Decourchelle & Ballet 1994). We illustrated this model by fitting ASCA and RXTE observations of Kepler’s SNR and found adequate fits when acceleration was efficient at the for-ward shock but inefficient at the reverse shock.
The effects of efficient particle acceleration on SNR hydro-dynamics where calculated in a hydro computer simulation of SNRs by Blondin & Ellison (2001). This was done by globally changing the effective ratio of specific heats,γeff, from 5/3 to values approaching 1, but did not include coupling between the acceleration and the hydro. Asγeff was decreased, the shocked gas became more compressible, the shock compression ratio in-creased, and the interaction region between the forward and re-verse shocks narrowed. Blondin & Ellison (2001) were able to show in two and three-dimensional simulations that if the inter-action region was narrow enough, convective instabilities pro-duced Rayleigh-Taylor fingers of dense ejecta material which were able to reach and perturb the forward shock.
Here, we introduce and describe in detail a CR-Hydro model which uses the same NL acceleration calculation of Berezhko & Ellison (1999), but replaces the self-similar de-scription used in Decourchelle et al. (2000) with a 1D hydro simulation such as that used by Blondin & Ellison (2001). The simulation is more general than the analytic approach used by Decourchelle et al. (2000) since it is not restricted to self-similar evolution and allows for a continuous change in the ac-celeration efficiency as the SNR evolves. We show, however, that when acceleration efficiency is nearly constant during the self-similar phase, the two models closely correspond, provid-ing an important check on the validity of both models. While we do not calculate X-ray thermal spectra in this paper, we show, with various examples, how the efficient production of CR protons influences SNR evolution and discuss the implica-tions this has on the interpretation of X-ray observaimplica-tions.
2. CR-hydro model
Our CR-hydro model couples a spherically symmetric hydro-dynamic simulation with a calculation of nonlinear diffusive shock acceleration. The particle acceleration calculation deter-mines how energy is divided between the thermal gas and rel-ativistic particles, and provides the particle distribution over all energies behind the shock, as well as the effective ratio of specific heats,γeff, defined below. In future work, we will use the electron and ion distribution functions to calculate the
broad-band continuum photon emission from radio to TeV en-ergies (e.g., Ellison et al. 2001), and use the self-consistent thermal properties in a non-equilibrium calculation of X-ray lines (e.g., Decourchelle et al. 2000). For now, we restrict our-selves to calculating CR proton spectra integrated over the SNR lifetime.
2.1. Hydrodynamic simulation
We use a standard hydrodynamic simulation in one dimension to model the effects of a supernova explosion in the interstel-lar medium (ISM) (see Blondin & Ellison 2001, and references therein). We are free to choose arbitrary ejecta and ISM mass density profiles, but to facilitate our comparisons discussed below, we adopt the parameters determined for SN1006 by Berezhko et al. (2002), i.e., we assume a constant density, con-stant temperature ISM, and take the initial ejecta density pro-file to beρ∝r−n, with n=7 and a constant density plateau at small radii (i.e., Chevalier 1982)2. While the modeling of par-ticular, young SNRs depends critically on the ejecta and ISM densities (e.g., Decourchelle et al. 2000), the general charac-ter of the results we present here are insensitive to these de-tails. Specifically, we begin at some time tstart < 0.1 tchwith undisturbed ejecta and ISM separated by a contact discontinu-ity. Here, tch = Rch/Vch is the characteristic age with Rch = [3Mej/(4πρ0)]1/3, Vch=
p
2Esn/Mej, andρ0=(1+4 fHe)mpnp0, where Esn is the explosion energy, Mejis the ejecta mass, np0 is the ISM proton number density, fHe is the helium to proton number ratio, and mpis the proton mass3.
The magnetic field, B, is ignored in our hydrodynamic model (we implicitly assume that B2/8πis small compared to the thermal pressure), but it is an important parameter for the particle acceleration discussed next.
2.2. Nonlinear diffusive shock acceleration
The full details of the nonlinear acceleration model used here are given in Berezhko & Ellison (1999) and Ellison et al. (2000). This is an approximate, algebraic model of diffusive shock acceleration containing the essential physics of NL ac-celeration, but which parameterizes important properties of the process such as the injection efficiency and the maximum en-ergy particles achieve. While more complete models of non-linear shock acceleration exist (e.g., Jones & Ellison 1991; Berezhko et al. 1996; Malkov & Drury 2001), our algebraic approximation is easier to include in global models of SNRs. It is computationally fast making it far less time consuming to do parameter searches and to compare model results with ob-servations. In Sect. 2.5 we show by direct comparison that it gives similar results to the more physically complete model of Berezhko et al. (2002).
Briefly, the nonlinear effects in diffusive shock acceleration are: (i) the self-generation of magnetic turbulence by counter-streaming energetic particles. Back counter-streaming particles produce 2 At the start of the simulation, the ejecta temperature is assumed to
be low enough to be insignificant.
3 Throughout this paper the subscript 0 (2) implies values upstream
turbulence in the magnetic field which leads to stronger scat-tering of the particles and hence to more acceleration, quickly leading to saturated turbulence levels nearδB/B∼1 in strong shocks; (ii) the modification (i.e., smoothing) of the shock pre-cursor by the backpressure of energetic particles. The precur-sor influences the subshock compression, rsub, the injection and acceleration efficiencies, and the shape of the accelerated spec-trum. Since particle diffusion lengths are generally increas-ing functions of momentum (e.g., Blandford & Eichler 1987; Giacalone et al. 1993), high momentum particles sample a broader portion of the flow velocity profile, and hence expe-rience larger effective total compression ratios, rtot, than low momentum particles. Consequently, higher momentum parti-cles have a flatter power-law index than those at lower mo-menta and can dominate the pressure in a NL fashion. The re-sultant superthermal distribution has a characteristic concave upward curvature until the spectrum turns over at the highest energies from losses (e.g., Ellison & Eichler 1984; Blasi 2002; Malkov et al. 2002); and (iii) the increase in rtotfrom relativis-tic parrelativis-ticle pressure and parrelativis-ticle escape. As relativisrelativis-tic parrelativis-ticles are produced and contribute significantly to the total pressure, their softer equation of state makes the shocked plasma more compressible (γ→ 4/3). Even more important, as the highest energy particles escape from strong shocks they drain away en-ergy flux which must be compensated for by ramping up the overall compression ratio to conserve the fluxes. Just as in ra-diative shocks, this is equivalent toγ→1 and rtotcan become arbitrarily large (e.g., Kazanas & Ellison 1986; Berezhko & Ellison 1999; Malkov 1997). As the overall compression in-creases (rtot >4), the subshock compression ratio, rsub, which is responsible for heating the gas, must become less than the test-particle (TP) value (rsub < 4), causing the temperature of the shocked gas to drop below TP values. These changes in shock compression occur simultaneously with changes in the shape of the accelerated particle spectrum, thus linking X-ray heating to cosmic-ray production. For reviews on diff u-sive shock acceleration see Drury (1983), Blandford & Eichler (1987), Berezhko & Krymsky (1988), Jones & Ellison (1991), and Malkov & Drury (2001).
The most important parameters associated with nonlinear shock acceleration are the Mach numbers (i.e., the shock speed,
u0, pre-shock hydrogen number density, np0, and preshock magnetic field, B0), the injection efficiency,ηinj(i.e., the frac-tion of total protons which end up with superthermal energies), and the maximum proton energy produced, Emax. As described in Berezhko & Ellison (1999), our model includes Alfv´en heat-ing in the precursor which reduces the efficiency compared to adiabatic heating and makes the magnetic field strength an im-portant parameter. For given sonic and Alfv´en Mach numbers (i.e., given MS =
q
ρ0u20/(γP0) and MA =
q
4πρ0u20/B0), and a given shock size and age, ηinj sets the overall acceleration efficiency and determines the importance of NL effects. With other parameters fixed, Alfv´en wave heating causes the accel-eration efficiency to decrease with increasing B0. In a com-plete model of diffusive shock acceleration, the injection effi -ciency would be determined from first principles. However, no current model of diffusive shock acceleration can do this and
injection remains dependent on approximations of poorly un-derstood wave-particle interactions4. Here, we investigate the effects of efficient acceleration by varyingηinj. A principle aim of future work is to constrainηinjfrom models using X-ray and broad-band observations of particular SNRs.
In order to compare our results directly to those of Berezhko et al. (2002), we assume as they do that the magnetic field is turbulent, adopting the Bohm limit for strong particle scattering, and somewhat arbitrarily take the field downstream from the shock to be the compressed upstream magnetic field i.e., B2 = rtotB0, where B0(B2) is the upstream (downstream) magnetic field strength. We do not expressly consider shock obliquity, i.e., the angle between the local shock normal and B0, even though this may be an important factor for understand-ing emission around the rims of some SNRs (see Reynolds 1998, for a discussion of the effects of shock obliquity in a test-particle description of particle acceleration in SNRs). As a crude approximation, we could model the asymmetry seen in many SNRs, including SN 1006, by combining results for dif-ferent quadrants of the remnant where values of the magnetic field and injection parameter were varied.
In our examples presented here, we take the unshocked ISM field to be B0 =20µG to match the value determined by Berezhko et al. (2002) for SN 1006. For simplicity, unless ex-plicitly stated we use the same constant value for the field in the unshocked supernova ejecta even though, in reality, this field is likely to weaken considerably with time because of flux con-servation (in the discussions associated with Figs. 4 (Sect. 2.3) and 8 (Sect. 2.4), we show some effects of a weak ejecta field). The maximum energy cosmic rays obtain depends, in part, on the scattering mean free path,λ, which is assumed to be,
λ=ηmfprg, (1)
whereηmfp>∼1 is taken to be a constant and rg =p/(qB) is the gyroradius in SI units. Small values ofηmfpimply strong scat-tering and allow higher maximum proton energies in a given system. The Bohm limit impliesηmfp'1.
The phase-space momentum distributions for protons,
f (p), are calculated as in Ellison et al. (2000) and consist of a
4 While in principle plasma simulations, where particles move in
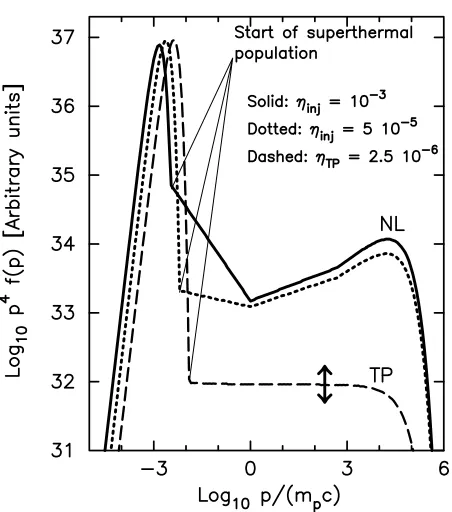
Fig. 1. Schematic particle distribution functions, f (p), versus momen-tum, p, where p4f (p) is plotted to emphasize the spectral curvature
in the nonlinear results (solid and dotted curves). The kinks in these spectra are manifestations of the piecewise approximation used in Berezhko & Ellison (1999). The lowest momentum kink separates the thermal from superthermal population. Above that is the three-component power law, and the turnover at the highest momentum. The up and down arrow on the test-particle result (dashed curve) indicates that there is no constraint in TP models on the density of superthermal particles other than that their energy density be insignificant.
thermal component, a three-component power law at superther-mal energies, and a turnover at the highest energies given by
exp
"
−α1 p
pmax
!α#
· (2)
Here,αis a constant and pmax =Emax/c is determined by set-ting the acceleration time equal to the SNR age, tsnr, or by set-ting the diffusion length of the highest energy particles equal to some fraction, fsk, of the shock radius, Rsk, whichever gives the lowest pmax(see Baring et al. 1999). With these assumptions,
pmax is proportional to the magnetic field strength. Reynolds (1998) has shown that when synchrotron emission is summed over space in a spherically symmetric SNR model, the resul-tant photon spectrum tends to be broader than that produced by a single electron distribution falling offas exp (−p/pmax). This behavior can be approximated in our model by varyingαand α ∼ 0.5 has been used to fit X-ray and radio spectra in par-ticular SNRs (e.g., Berezhko et al. 1999; Ellison et al. 2001). However, Berezhko et al. (2002) obtain a good fit to SN1006 with a sharp turnover in f (p) and to match their results, we take α=4.
Figure 1 illustrates the essential differences in particle spectra between TP shock acceleration (dashed line) and NL
acceleration with different injection efficiencies (solid and dot-ted lines). Compared to the TP power law, i.e.,
f (p) d3p∝p−σd3p with σ= 3rtot
rtot−1,
(3) the high-energy portion (p>mpc) of a NL spectrum is flatter, the low-energy portion of the superthermal spectrum (above the thermal peak and below mpc) is steeper, and the thermal part is at a lower temperature. In the TP approximation, the normal-ization of the power-law portion of the spectrum (relative to the thermal peak) is arbitrary as long as it is low enough to contain an insignificant fraction of the total energy. If we arbi-trarily set this fraction at 0.01, we can determine, for a given set of shock parameters, the injection efficiency,ηTP, below which the thermal gas is decoupled from the power law, i.e., for anyηinj ≤ ηTP, the temperature and density of the ther-mal gas remains constant. For the example shown in Fig. 1, ηTP'2.5×10⁻⁶.
In contrast, the energetic portions of NL spectra are set by the conservation of mass, momentum, and energy fluxes and any change in the relativistic population influences the thermal population. When acceleration is efficient, the relation between the shock velocity, u0, and the temperature of the shocked gas,
T2, is no longer approximated by the commonly used expres-sion for a strong, TP shock. That is,
kT2
µmpu20
, 3
16, (4)
whereµmp is the mean particle mass and k is Boltzmann’s constant. If the equality in Eq. (4) is assumed for a fully ion-ized plasma with nHe/np0 =0.1 (nHeis the unshocked number density of helium) and equal downstream temperatures for all species,
T2'1.3×10⁷
u0 103km s−1
!2
K. (5)
For young SNRs, this predicts temperatures just behind the blast wave well above those capable of explaining observed X-ray line emission (e.g., u0 = 3000 km s−1 → T2 ' 1.2× 10⁸ K) and suggests that the shocked electron temperature is considerably less than predicted by Eq. (5) (e.g., Hughes et al. 2000; Hwang et al. 2002; Long et al. 2003).
Normally, it is assumed that electrons obtain a much lower temperature than the ions in the shock layer and take some time to equilibrate downstream through Coulomb collisions (see Decourchelle & Ellison 2001, for a discussion of electron-ion equilibration in modified shocks). However, the heating pro-cess in the shock layer is certainly dominated by collisionless, wave-particle interactions which are poorly understood. The simplest possibility, that all particles upon crossing the shock gain a speed differential∆u ∼u0−u2, where u2 is the down-stream flow speed as seen from the shock, predicts that ions are heated far more than electrons5. Nevertheless, the possibility 5 That the situation is clearly more complicated than this is evident
exists that electrons equilibrate faster than this simple conjec-ture implies and the fact that efficient acceleration produces a considerably lower proton temperature (Fig. 1) in strong shocks than the TP prediction of Eq. (5), suggests that it may not be as obvious that Te2/Tp21 immediately behind the shock6.
Furthermore, radio synchrotron observations have long confirmed that many SNRs accelerate electrons to relativis-tic energies, although it is not certain that these electrons are drawn from the shock heated population in all cases. What is certain is that if relatively cold upstream electrons enter the downstream region without being heated and then slowly equi-librate as they advect away downstream, very few if any will be injected into the Fermi acceleration process. In the simplest, kinematic models of injection in Fermi acceleration (e.g., Jones & Ellison 1991; Baring et al. 1999), the efficient acceleration of thermal electrons is inconsistent with a lack of electron heating in the shock layer.
2.3. CR–hydrodynamic coupling
When efficient particle acceleration shifts energy from the ther-mal gas into relativistic particles, the fraction of total energy density in pressure is lowered and the evolution of the SNR is modified. The modified evolution, in turn, modifies the shock parameters which determine the acceleration. We model this coupling by including nonlinear shock acceleration in a stan-dard 1D hydrodynamic simulation as follows.
Briefly: (i) the hydro simulation is initiated at some time, tstart < 0.1 tch, after the supernova explosion with a plateau-power-law ejecta distribution and a constant interstellar medium density,ρISM; (ii) at each time step, the hydro evolves and the radii and Mach numbers of the forward and reverse shocks are determined; (iii) with this shock information, the CR acceleration is calculated using the approximate model of Ellison et al. (2000) with the injection parameter,ηinj, kept con-stant during the simulation and having the same value at the forward and reverse shocks7; (iv) The acceleration calculation provides the overall compression ratio, rtot, and the effective ratio of specific heats is determined by
γeff =
MS2(rtot+1)−2rtot
M2
S(rtot−1)
, (6)
6 Estimates of Te2/T
p2based on optical and UV line observations
have been obtained just behind a few SNR shocks (e.g., Raymond et al. 1995; Laming et al. 1996; Ghavamian 1999). These show a wide range, i.e., 0.2<Te2/Tp2<0.8, with large uncertainties and are
gen-erally restricted to regions that are partially neutral where the most efficient particle acceleration may not be occurring (see Drury et al. 2001, for a more complete discussion).
7 In an actual SNR, of course, the injection efficiency might vary
with time, vary over the shock surface, or be different at the forward and reverse shocks (as in our model of Kepler’s SNR; Decourchelle et al. 2000). For the general results presented here, keepingηinj con-stant avoids unnecessary complexity. It is important to note, however, that the acceleration efficiency, i.e., the fraction of ram kinetic energy that is transferred to superthermal particles, depends on the shock pa-rameters (Mach numbers, shock age, etc.) as well as onηinjand does vary with age and between the forward and reverse shocks even ifηinj is constant.
where we note thatγeff < (P/ρen)+1 since γeff includes the effects from “escaping” particles8. Here, P (ρen) is the pressure (energy density) of the shocked gas; (v) The coupling between the CR acceleration and the hydrodynamics is accomplished by replacing the ratio of specific heats used in the hydrodynamic equations withγeff in the shells spanning the shock transition. We use a Lagrangian mode in the hydro simulation so the sim-ulation grid moves with the mass. Once a mass element has been shocked and aγeff has been assigned to it using Eq. (6), that mass element retains thatγefffor the rest of the simulation or until it reencounters a shock. Even though energy is leaving the system via the highest energy cosmic rays, we do not ex-plicitly remove energy from the hydro. Loweringγeffcauses the gas to be more compressible and mimics the escaping energy in one step; (vi) as the SNR evolves, the proton distribution functions in momentum, f (p), associated with each shocked shell undergo adiabatic losses; and finally, (vii) at the end of the simulation, the f (p)’s from all of the shells are summed to determine the total contribution to the Galactic CR source population.
To start, we show in Fig. 2 a TP case whereγeff =5/3 al-ways (top panel). For this example and all others presented in this paper, we have taken Esn =3× 1051erg, Mej = 1.4 M,
B0=20µG, and a constant density ISM with np0=0.3 cm−3, and fHe = 0.1. These values give a characteristic age, tch =
Rch/Vch ' 210 yr. The initial ejecta density distribution is a power law (ρ∝r−7) with a flat plateau at small radii. The sim-ulation spans 6000 yr and various quantities are shown, as a function of radius, at different times during the SNR evolution. The temperature shown in panel (b) is the average temperature defined as
<T2>=
P
ρ µmp
k ×fth, (7)
where P is the pressure,ρis the density,µ =(1+4 fHe)/(2+ 3 fHe), fHe =0.1 is the ratio of helium atoms to protons, and fth is the fraction of pressure in thermal particles. In this plot and all others, we assume the plasma to be fully ionized. When ac-celeration occurs, superthermal particles contribute to the total hydrodynamic pressure, P. We define the temperature from that fraction of total pressure in the “thermal” particles, fth. This fraction is determined from f (p) (see Fig. 1 where the division between thermal and superthermal particles is indicated).
For the particular parameters assumed for the model shown in Fig. 2, the SNR is still in the self-similar phase after 100 yr as the reverse shock moves through the power-law portion of the ejecta. By 300 years, the reverse shock is moving through the plateau region of the ejecta and the forward shock has reached
RFS '4 pc. The density of the unshocked ejecta is now well below the ambient ISM densityρISM =1.4 mpnp0at this stage. By 1000 years, RFS ∼ 8 pc, the RS is now moving back to-ward the origin, and the energy of the explosion is shifting from being in the kinetic energy of the ejecta to thermal pressure. 8 Performing the acceleration calculation at each time step is
com-putationally expensive. If the full spectrum is not needed and only efficient acceleration is considered, a faster approximation can use rtot=1.3M
3/8
A if MA <M2s or rtot=1.5M 3/4
s otherwise (see Berezhko
Fig. 2. Parameters from the hydro simulation versus radius at vari-ous times during the simulation as labeled. These are test-particle re-sults with no adjustment ofγeff from particle acceleration. We have assumed Esn =3× 1051erg, Mej = 1.4 M, and a constant density
ISM with np0 =0.3 cm−3, and fHe =0.1. The ejecta density structure
is initially a power-law with index n=7 beyond the plateau at small radii (panel c)).
By 6000 years, the RS has collapsed back through the ejecta to the origin and the SNR is well into the Sedov phase with a FS speed of about (4/3)750 km s−1 9.
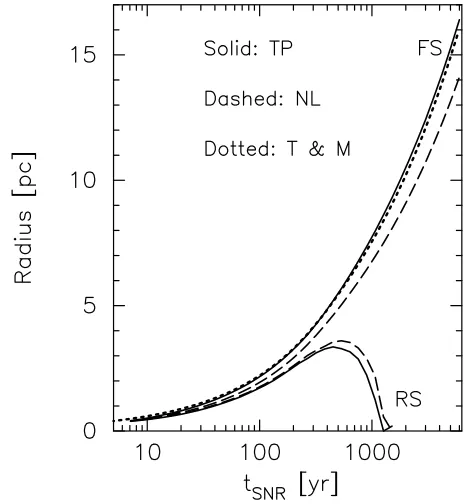
In Fig. 3 we illustrate how particle acceleration influences the SNR shock evolution by comparing TP results (ηinj<∼10−6) against a simulation with ηinj = 10−3. The figure shows the forward and reverse shock radii versus remnant age, tsnr, for the same parameters as used in Fig. 210. The TP results, i.e., those withγeff =5/3 everywhere, are shown with solid curves and the NL results are shown with dashed curves. The dot-ted curve is the TP analytic approximation given by Truelove & McKee (1999) for the FS and this matches the hydro re-sults well over the entire time period. When NL effects are 9 Note that the speed shown in the bottom panel of Fig. 2 and
panel (d) of Fig. 4 is the flow speed in the frame of the explosion. The shock speed is given by u0 =(rtotuds−uup)/(rtot−1), where uup
(uds) is the flow speed just upstream (downstream) from the shock and
rtotis the shock compression ratio. For the ISM conditions we assume
here, uupalways equals zero for the forward shock. At tsnr =6000 yr
in Fig. 2 at the FS, uds'750 km s−1, rtot'4, and u0'1000 km s−1. 10 We do not follow particle acceleration at the reverse shock after it
first collapses to zero radius.
Fig. 3. Shock radius versus SNR age for forward (FS) and reverse shocks (RS) obtained with our hydrodynamic simulation. The dashed curves show NL results with efficient particle acceleration (ηinj = 10−3), while the solid curves are test-particle (TP) shocks with no
par-ticle acceleration. The dotted curve shows the TP forward shock radius obtained with the approximate analytic expression given in Truelove & McKee (1999).
important, the region between the forward and reverse shocks becomes narrower and denser, a result fully consistent with the analytic results of Decourchelle et al. (2000) and the multi-dimensional hydro simulations of Blondin & Ellison (2001).
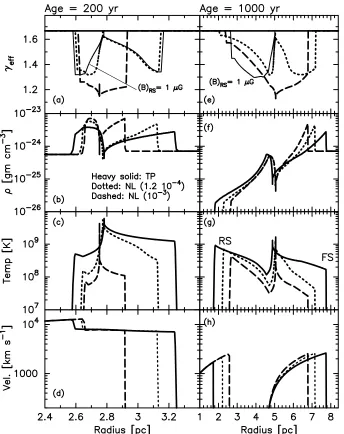
In Fig. 4 we compare TP profiles to NL ones at tsnr =200 and 1000 yr. In all panels, the heavy-weight solid curves are the TP results (ηinj <∼ 10−6), the dotted curves have ηinj = 1.2 × 10⁻⁴, and the dashed curves haveη
inj =10−3. Panels (a) and (e) show the reduction inγeffthat occurs as shock accelera-tion shifts energy into relativistic particles. This produces com-pression ratios greater than 4 and results in denser, narrower regions between the forward and reverse shocks as shown in the density profiles (b) and (f). The separation between the for-ward and reverse shocks varies considerably with tsnrandηinj. At tsnr=200 yr, this separation is∼0.25 pc forηinj=10−3and ∼0.7 pc for the TP case, while at tsnr = 1000 yr it is∼4.2 pc forηinj =10−3and∼6 pc for the TP case. The shift in energy out of the thermal gas also results in a significant decrease in the temperature of the shocked gas in the NL case, as shown in panels (c) and (g).
The flow speed is shown in the bottom panel and the for-ward and reverse shocks are easily identified in all panels. At tsnr = 1000 yr, the flow speeds just behind the forward shocks of the three examples are about equal, i.e., uds(TP) ' 2600 km s−1 and u
ds(ηinj = 10−3) ' 2500 km s−1. However, since the shock speed depends on rtot, the TP shock is mov-ing faster, i.e., u0(TP) ' (4/3)2600 ' 3500 km s−1, while
Fig. 4. Comparison of the parameters for a test-particle simulation (solid curves) with those undergoing particle acceleration. The results are shown at tsnr=200 and 1000 yr and the supernova parameters are the same as those in Fig. 2. The light-weight solid curves in panels a) and e)
show the effect onγeffof reducing the unshocked ejecta magnetic field from (B0)RS=20µG to 1µG. Apart from (B0)RS, all other parameters
are the same as in theηinj=1.2×10⁻⁴examples shown with dotted curves. In panel e), the shocked ISM portion of the (B
0)RS=1µG curve is
essentially identical to the dotted curve.
The intermediate NL case with ηinj = 1.2 × 10⁻⁴ (dot-ted curves) produces temperatures and compression ratios be-tween the TP andηinj =10−3cases, as expected. However, as seen in the variations ofγeff (panels (a) and (e) of Fig. 4), the
ηinj=1.2×10⁻⁴case acts quite differently at the beginning of the simulation. As described in Berezhko & Ellison (1999),
un-modified shocks with rtot'4 can occur for high Mach numbers ifηinjis small enough. In this case, the pressure in relativistic particles, Prel, is small compared to ρ0u20 and these particles do not slow the incoming gas enough to produce the nonlin-ear shock modification. For a givenηinj, as the SNR ages, u0 decreases, Prel/(ρ0u20) increases, and the shock acceleration be-comes more efficient and more nonlinear. Thus, for relatively inefficient injection, γeff drops and rtot increases in the early
stages of evolution, exactly the opposite behavior as with effi -cient injection11.
After the initial transition from a strong, unmodified shock to a strong, modified one, the forward shock will enter the long stage where it slowly weakens, the acceleration becomes less efficient, andγeffincreases toward 5/3. However, as shown by the dotted curve in panel (e) in Fig. 4, the reverse shock weak-ens much more quickly and at tsnr = 1000 yr hasγeff ' 5/3. Since we assume that B0 is a constant everywhere, the RS 11 As discussed in Berezhko & Ellison (1999), it is by no means
Fig. 5. Forward shock compression ratios vs. supernova age for vari-ous injection rates,ηinj. In all cases, the solid curves are obtained from the NL particle acceleration calculation and the dashed curves are ob-tained from the density ratio,ρdw/ρup, just downstream and upstream from the shock.
weakens as the ejecta density drops and the magnetic pressure becomes dominant over the gas pressure. In an actual SNR, magnetic flux conservation in the expanding, unshocked ejecta would cause B0to weaken as the ejecta density drops and the RS would remain stronger than with a constant B0. For a given unshocked density, a weak B0results in efficient shock acceler-ation because the Alfv´en Mach number increases with decreas-ing B0, and because the amount of energy transferred out of accelerated particles into waves and then into heating of the precursor gets less. Of course, if the magnetic field gets too weak, the gyroradii of accelerated particles will become com-parable to the shock radius, or the acceleration time will be-come comparable to tsnr, before high particle energies or high efficiencies are obtained. To illustrate the effects of a low ejecta magnetic field, we show in panels (a) and (e) of Fig. 4γeff pro-duced by ourηinj = 1.2× 10⁻⁴example with the unshocked ejecta field set at 1 µG (light-weight solid curves). As seen clearly in panel (e),γeffremains lower at the end of the simula-tion than in the (B0)RS=20µG case, indicating more efficient acceleration.
In Fig. 5 we plot the compression ratio, rtot, versus tsnrfor our TP and two NL examples. There are two sets of curves be-cause there are two ways of determining rtot. The solid curves are values obtained from the particle acceleration calculation which are then used in Eq. (6) to calculate γeff. The dashed curves are determined directly from the hydro density ratio taken just downstream and upstream from the shock, ρdw/ρup. In principle, these should be identical but in practice diff er-ences occur, indicating the inherent errors in ourγefftechnique. The largest average difference shown here with ηinj = 10−3
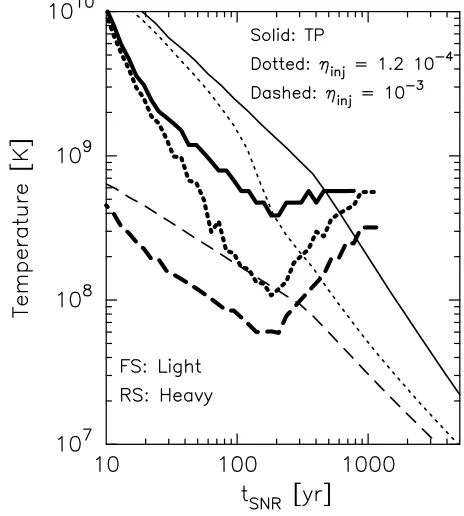
Fig. 6. Temperatures immediately behind the forward and reverse shocks as a function of tsnr. The solid curves are the TP case, the
dot-ted curves are forηinj = 1.2× 10⁻⁴, and the dashed curves are for ηinj = 10−3. The reverse shock temperatures are plotted with
heavy-weight curves.
is<10%. The ηinj = 1.2× 10⁻⁴ case clearly shows the rapid transition from the strong, unmodified shock with rtot ∼ 4 at early times to the modified shock with rtot > 4 at intermedi-ate times. The striking difference between theηinj =10−3and
ηinj=1.2×10⁻⁴cases will leave an imprint on the post-shock gas that may be an important diagnostic for determining if effi -cient Fermi acceleration takes place in young SNRs.
In Fig. 6 we show the postshock proton temperatures for the same three examples. Comparing the heavy-weight solid and dashed curves shows that the RS temperature in theηinj = 10−3efficient shock is less than∼1/10 that of the test-particle shock over most of the time period shown. This is a difference large enough to have profound consequences for the interpre-tation of X-ray thermal emission in young SNRs. Furthermore, the temperature in the intermediate case (ηinj = 1.2× 10⁻⁴) shows a stronger time variation than either the TP orηinj=10−3 case. This is reflected as a somewhat steeper spatial gradient in temperature as seen in panel (g) of Fig. 4, again offering a pos-sible diagnostic to test for efficient particle acceleration.
2.3.1. Comparison with analytic model of Decourchelle et al.
The assumptions of the two models differ mainly in the way the hydrodynamics are treated.
While the hydro simulation has a one-fluid approach with an effective ratio of specific heats derived from the compression ratio (Eq. (6)), the analytical, self-similar solutions are based on a two-fluid approach: a nonrelativistic one withγ=5/3 and a relativistic one withγ = 4/3. The NL particle acceleration calculation provides the compression ratio and the fraction of total pressure in relativistic gas at both shocks which are used to determine the boundary conditions of the self-similar solu-tion. Imposing the compression ratios, which can be greater than 7, mimics the effects of particle loss. The limitations of the self-similar calculation are that the RS must be propagat-ing in the power-law portion of the ejecta density profile, and that it assumes that the forward and reverse shock compression ratios, as well as the fractions of total pressure in relativistic gas, remain constant throughout the evolution. A limitation of our hydrodynamic simulation is that it assigns at the shocks to an element of gas an effective gamma, which is kept constant during its post-shock evolution.
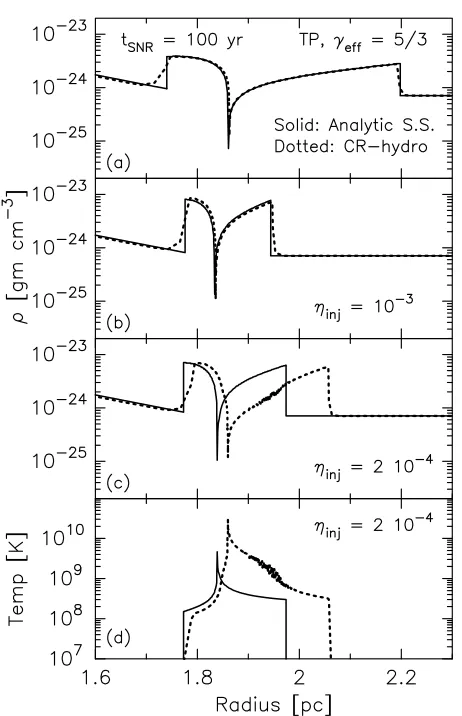
In the top three panels of Fig. 7 we compare the density structures for our two models at tsnr = 100 yr when the RS is still propagating in the power-law portion of the ejecta den-sity profile. We use the same supernova and ISM parameters as in our previous runs. For the TP (panel (a)) andηinj =10−3 (panel (b)) cases, the correspondence between the two mod-els is extremely close with small differences resulting mainly from the finite grid used in the hydro simulation. The reason for this comes from the fact that self-similarity is satisfied in the TP case where rtot ' 4 always. It is also approximately satisfied in theηinj=10−3case since rtot, and thereforeγeff, re-mains fairly constant during the 100 yr evolution, as indicated by the dashed curve in panel (a) of Fig. 4.
While it was not obvious that the γeff procedure used in the hydro model would be a good approximation, the excel-lent agreement we see with the analytic model, which only as-sumes self-similarity, justifies this approach, at least at these early times.
Much larger differences in the two models are seen in pan-els (c) and (d) whereηinj = 2× 10⁻⁴. In this case, rtot and thereforeγeff vary strongly during 100 yr (similar to the dot-ted curve in panel (a) of Fig. 4), and self-similar conditions no longer apply. Since the analytic model takes rtotat the forward and reverse shocks at the final time and applies these values for the entire evolution, it is effectively using values, at least for the FS in theηinj =2× 10⁻⁴case, which are considerably greater than the average values used in the hydro calculation. Using a larger rtotmeans there is less pressure for a given energy density pushing the shock in the self-similar model than in the hydro model. Therefore, the FS in the hydro calculation travels faster and extends further than in the analytic calculation. The vari-ation inγeff is less in the shocked ejecta (again similar to the dotted curve in panel (a) of Fig. 4) so the difference in the two models is less there as well.
We consider the close correspondence between these two models in the TP and ηinj = 10−3 cases to be a clear in-dication that both adequately model the SNR hydrodynam-ics during self-similar conditions. The validation of the γeff
Fig. 7. Density (top three panels) versus radius for two NL models and a TP model, as indicated, at tsnr = 100 yr. The bottom panel
shows temperature versus radius for ηinj = 2× 10⁻⁴. In all
pan-els, the solid curves are calculated using the analytic, self-similar model of Decourchelle et al. (2000) and the dotted curves are from the CR-hydro model presented here. In the CR-hydro model, some nu-merical noise is evident in the shocked ISM profiles forηinj=2×10⁻⁴.
approach by our two-fluid description of the post-shock flow in the framework of self-similar, cosmic-ray modified Chevalier solutions means the more general hydro simulation can be used with some confidence when self-similar conditions do not ap-ply. This will also allow us to use the analytic model to test the hydro model when X-ray thermal and broad-band photon emission is included.
2.4. Energetic proton spectra
The proton distribution functions that are calculated at the for-ward and reverse shocks during the SNR evolution can be summed to determine the total contribution to the cosmic-ray spectrum. The amount of material swept up by each shock is used to weight each spectrum and convert f (p) to N(p,∆t)
where 4πR0∞p2N(p,∆t)dp is the total number of particles over-taken by the shock in the time interval, ∆t. The N(p,∆t)’s
until the end of the simulation (e.g., Reynolds 1998), to pro-duce N(p)12. Typical proton spectra calculated with B0 = 20µG at tsnr =500 yr (tsnr/tch '2.4 for Esn =3× 1051erg,
Mej =1.4 M, np0 = 0.3 cm−3, and fHe = 0.1) are shown in Fig. 8. The NL examples produce cosmic rays at the expense of heating and show lower temperatures, as indicated by the posi-tions of the thermal peaks. The dashed curve is the result with the most efficient injection (ηinj = 10−3) and this spectrum is the flattest at relativistic energies (before the turnover at pmax). The spectrum withηinj=1.2×10⁻⁴is the most distorted from a Maxwellian at thermal energies due to the summing of spectra which evolve from unmodified (rtot '4) to strongly modified (rtot>4), as discussed above.
To illustrate the effects of a weakening unshocked ejecta magnetic field, we show in the bottom panel of Fig. 8 (thin solid curve) N(p) for the case where the unshocked ejecta field is set at (B0)RS =1µG, a factor of 20 lower than in the other cases. The unshocked ISM field is kept at 20µG andηinj=1.2×10⁻⁴ for both the forward and reverse shocks. The flatness of the su-perthermal part of the spectrum compared to the dotted curve indicates that the RS is stronger (i.e., rtotis larger) than when (B0)RS=20µG (see Fig. 4). However, pmaxis well below that in the (B0)RS = 20µG cases because the weak field produces large gyroradii and high momentum particles cannot be accel-erated. The FS spectrum is only slightly changed by changing (B0)RSand is not shown.
In Fig. 9 we show spectra at 1000, 6000, and 4×10⁴yr for the same ISM and SN parameters withηinj =10−3. As the FS expands and weakens, the acceleration efficiency drops and the relativistic portion of the spectrum steepens. As expected, parti-cles accelerated at the RS decrease in importance in later stages of the SNR. As we show in Fig. 11 below, even moderately efficient injection (i.e.,ηinj >∼ 10−4) results in approximately 50% of the explosion energy being put into relativistic parti-cles over the lifetime of the SNR. Another important property shown in the top panel of Fig. 9 is that, even withηinj =10−3 which produces strongly curved spectra at early times, the total particle distribution function after 4×10⁴yr is approximately
N(p) ∝ p−2 at relativistic energies. Thus the total cosmic-ray production is fairly consistent with the observed CR flux after energy dependent escape from the galaxy is included.
2.5. Comparison with kinetic models
One of the most complete models of nonlinear CR pro-duction in SNRs is that of Berezhko and co-workers (e.g., Berezhko et al. 1996; Berezhko & V¨olk 1997) where the time-dependent CR transport equations are solved together with the gas-dynamic equations in spherical symmetry. This model gives the radial distribution of gas and accelerated CR spec-trum at any phase of the SNR evolution and has been used with good success to model a number of young SNRs including SN1006 (Berezhko et al. 2002), Cassiopeia A (Berezhko et al. 2003), and Tycho (V¨olk et al. 2002). In all of the above cases, 12 We do not include radiation (i.e., synchrotron) losses here since
they are always negligible for ions. For electrons, of course, these losses must be considered.
Fig. 8. Proton number distributions, N(p) (multiplied by [p/(mpc)]4mp/M), for hydro simulations with no acceleration
(heavy solid curves), withηinj = 1.2× 10⁻⁴ (dotted and thin solid
curves), and withηinj=10−3(dashed curves) summed over 500 years.
The spectra in the top panel are from the shocked ISM (forward shock), while those in the bottom panel are from the shocked ejecta (reverse shock). The N(p)’s are absolutely normalized to the total number of protons overtaken by the shock during their lifetime. All spectra have been adjusted for adiabatic expansion. The thin solid curve in the bottom panel shows the RS spectrum for the case where the unshocked ejecta magnetic field is set at (B0)RS=1µG.
the authors conclude that satisfactory fits to the radio and X-ray synchrotron emission, along withγ-rays where observed, are best obtained when the forward shocks are strongly
mod-ified by the efficient acceleration of protons in a high mag-netic field. While similar results have been presented before (e.g., Reynolds & Ellison 1992; Ellison et al. 2000, 2001), Berezhko’s model probably contains the most complete physi-cal description of the NL acceleration process at the FS, and the detailed modeling of particular SNRs clearly lends credibility to the suggestion that shocks in young SNRs can be strongly nonlinear with compression ratios greater than 4.
Fig. 9. Particle number distributions, N(p) (multiplied by [p/(mpc)]4mp/M) from the shocked ISM (FS) and shocked
ejecta (RS) at various times during the SNR evolution. Efficient particle injection is assumed (ηinj =10−3) throughout the SNR
evo-lution, but the fraction of energy in relativistic particles varies as the SNR ages. The acceleration efficiency decreases as the SNR ages and the shocks weaken. The RS contributes little to the total CR popula-tion at tsnr=4×10⁴yr. All spectra have been adjusted for adiabatic
expansion.
accelerated particles originate as thermal particles in the up-stream flow, are accelerated as the shock overtakes them, and then remain in the shell of material where they were accel-erated, suffering adiabatic losses as the remnant ages. The re-acceleration of high energy particles with long diffusion lengths can be important as it adds to the maximum energy par-ticles obtain (e.g. Berezhko et al. 1996), but this effect becomes less important as time goes on and new unshocked particles are overtaken and accelerated.
In Fig. 10 we compare our results with those of Berezhko et al. (2002) for the proton distribution at tsnr = 1000 yr they predict for SN1006. We have adjusted the normaliza-tion of the FS to obtain a good fit, but otherwise have used the environmental parameters given in Berezhko et al. While both our models require an arbitrary injection parameter de-fined as the fraction of thermal particles overtaken by the shock that become superthermal, the actual implementation of this parameter may be different in the two models. To fit SN 1006, Berezhko et al. use η = 2× 10⁻⁴; we have used
ηinj = 1.2 × 10⁻⁴ to match their results. A distinct advan-tage of Berezhko’s model is that the maximum CR energy,
Fig. 10. The dashed curve is the inferred FS proton distribution of SN1006 as obtained by Berezhko et al. (2002) at tsnr=1000 yr. Using
their input parameters for Esn, Mej, etc., we have matched this result
(solid curve) withηinj=1.2×10⁻⁴,α=4, and f
sk=0.1 (see Eq. (2)
and the discussion following it). The dotted curve is the corresponding proton distribution from shocked ejecta (RS) from our model.
Emax, and the shape of f (p) near Emax are determined self-consistently. In our CR-hydro model, we parameterize these withαin Eq. (2) for the shape and with the fraction of shock radius, fsk, set equal to the maximum particle diffusion length to determine Emax. To match the results given by Berezhko et al. (2002), we useα=4 and fsk =0.1. While fine tuning of our parameters could provide a more exact match than shown in Fig. 10, the particular values are unimportant compared to the fact that both models show a similar level of injection ef-ficiency and shock modification. Considering the fundamental differences in the two models, the fit of superthermal particles accelerated by the FS shown in Fig. 10 is impressive. The con-cave shape, accentuated by plotting p4N(p), is very similar, al-though the piecewise nature of our approximation is apparent.
We take the excellent correspondence achieved with Berezhko’s calculation as evidence that our CR-hydro model, with its algebraic NL particle acceleration approximation, is accurate.
As is clear in Fig. 10, Berezhko et al. (2002) do not treat thermal particles explicitly although, in principle, they could convert the thermal pressure and density into a Maxwellian distribution as we do. They also ignore the reverse shock, an approximation that is well justified if only continuum emission from relativistic particles is considered at times tsnrtch. In or-der to predict thermal X-ray emission in young SNRs, however, thermal electrons must be modeled and particle heating and acceleration at the forward and reverse shocks must be self-consistently determined. We do not show electron spectra here, but our NL acceleration model, with additional parameters, can produce these along with the broad-band continuum emission from radio to TeVγ-rays produced by them (e.g., Ellison et al. 2001). The most important advantage our CR-hydro model has, however, is the ability to model the RS and the potential for in-cluding X-ray thermal emission from the shock-heated ejecta calculated using a non-equilibrium ionization calculation (e.g., Decourchelle et al. 2000).
In the bottom panel of Fig. 11 we show the fraction of explosion energy in relativistic particles, Ecr/Esn, as a func-tion of tsnr. As in the top panel, the solid curves are from our CR-hydro model and the dashed curve (FS only) is from Berezhko et al. (2002). The total Ecr/Esnis in good agreement at early times but diverges somewhat at later times, a possi-ble indication that adiabatic losses are treated differently in the two models. Most importantly, both models show that approxi-mately 50% of the explosion energy is placed into cosmic rays during the SNR lifetime13. The dotted curves in the bottom panel show that Ecr/Esn at tsnr = 6000 yr remains in a fairly narrow range (∼40 to 65%) forηinjranging from 8× 10⁻⁵(a), to 10−3(d).
3. Conclusions
The efficient production of cosmic rays by shocks in SNRs lowers the pressure to energy density ratio in the post-shock gas causing dramatic changes in the thermal properties of the shocked gas and the SNR evolution. We have presented a CR-hydro model that combines a 1D hydrodynamic simula-tion of a SNR, including the forward and reverse shocks, with particle acceleration. We explicitly include the effects of par-ticle acceleration on the shock heated ejecta, a critical step in determining how X-ray thermal emission from the hot ejecta is modified by particle acceleration.
In accord with previous results (e.g., Dorfi 1990; Berezhko et al. 1996, 2002), we find that SNRs can easily transfer∼50% of the explosion energy into relativistic particles (bottom panel of Fig. 11). Compared to the situation where acceleration is 13 Berezhko et al. (2002) make the important point that injection
may vary over the surface of the SNR and be significantly less where the magnetic field is highly oblique. They estimate that to supply the galactic cosmic-ray population the overall efficiency need only be
∼20% of the maximum values shown in Fig. 11.
Fig. 11. Forward shock compression ratios (top panel) and fraction of Esn going into relativistic particles, Ecr/Esn, (bottom panel) for
SNRs with variousηinj’s versus tsnr. The solid curves are for SN1006
parameters (ηinj = 1.2× 10⁻⁴, B
0 = 20 µG, Esn = 3× 1051 erg,
Mej =1.4 M, np0 =0.3 cm−3, and fHe =0.1) and show rtotand rsub
in the top panel and the total Ecr/Esnand that portion from the RS in
the bottom panel. The dashed curves are the corresponding SN1006 results from Berezhko et al. (2002). The dotted curves are from the CR-hydro model with a) ηinj = 8× 10⁻⁵, b) ηinj = 2.4× 10⁻⁴, c)ηinj=4×10⁻⁴, and d)ηinj=10−3.
thermal X-ray emission model is combined with the CR-hydro model.
Despite the strong NL effects expected for young SNRs, the CR spectrum integrated over the age of a remnant (Fig. 9) should have a spectrum not much flatter than N(E) ∝ E−2 at relativistic energies.
Our one-dimensional CR-hydro model uses a computa-tionally fast, approximate calculation of particle acceleration which is coupled to the hydrodynamics by modifying the ef-fective ratio of specific heats. We have verified the accuracy of this approach for parameters applicable to SN1006 by direct comparison with the more physically complete model of ac-celeration of Berezhko et al. (2002) (Figs. 10 and 11), where the time-dependent CR transport equations are solved self-consistently with the gas-dynamic equations. The main advan-tage of our model lies in the fact that we can model accelera-tion at the forward and reverse shocks during all stages of the SNR evolution. In a preliminary work we modeled thermal X-ray emission from Kepler’s SNR with a two-fluid, self-similar description of the SNR hydrodynamics coupled to the same calculation of particle acceleration (Decourchelle et al. 2000). We have demonstrated (Fig. 7) that the two models give essen-tially identical results when self-similar conditions apply. Our next step will be to include this non-equilibrium calculation of thermal X-ray emission, plus broad-band continuum emis-sion from bremsstrahlung, synchrotron, inverse-Compton, and pion-decay (Baring et al. 1999), in the CR-hydro model.
Acknowledgements. The authors would like to thank J. Blondin for providing his hydrodynamic simulation VH-1 and for help modifying it to include particle acceleration. This work was supported, in part, by a NSF-CNRS grant (NSF INT-0128883) and by a NASA ATP grant (ATP02-0042-0006).
References
Allen, G. E., Keohane, J. W., Gotthelf, E. V., et al. 1997, ApJ, 487, L97
Baring, M. G., Ellison, D. C., Reynolds, S. P., Grenier, I. A., & Goret, P. 1999, ApJ, 513, 311
Berezhko, E. G., & Ellison, D. C. 1999, ApJ, 526, 385
Berezhko, E. G., Elshin, V. K., & Ksenofontov, L. T. 1996, JETP, 82, 1
Berezhko, E. G., & Krymsky, G. F. 1988, Sov. Phys. Usp., 31, 27 Berezhko, E. G., Ksenofontov, L. T., & Petukhov, S. I. 1999, Proc.
26th Int. Cosmic Ray Conf. (Salt Lake City), 99, 4431
Berezhko, E. G., Ksenofontov, L. T., & V¨olk, H. J. 2002, A&A, 395, 943
Berezhko, E. G., P¨uhlhofer, G., & V¨olk, H. J. 2003, A&A, 400, 971 Berezhko, E. G., & V¨olk, H. J. 1997, Astropart. Phys., 7, 183 Blandford, R. D., & Eichler, D. 1987, Phys. Rep., 154, 1
Blasi, P. 2002, Astropart. Phys., 16, 429
Blondin, J. M., & Ellison, D. C. 2001, ApJ, 560, 244
Borkowski, K. J., Rho, J., Reynolds, S. P., & Dyer, K. K. 2001, ApJ, 550, 334
Boulares, A., & Cox, D. P. 1988, ApJ, 333, 198
Butt, Y. M., Torres, D. F., Romero, G. E., et al. 2002, Nature, 418, 499
Chevalier, R. A. 1982, ApJ, 258, 790 Chevalier, R. A. 1983, ApJ, 272, 765
Decourchelle, A., & Ballet, J. 1994, A&A, 287, 206
Decourchelle, A., & Ellison, D. C. 2001, Space Sci. Rev., 99, 219 Decourchelle, A., Ellison, D. C., & Ballet, J. 2000, ApJ, 543, L57 Dorfi, E. A. 1990, A&A, 234, 419
Dorfi, E. A. 1994, ApJS, 90, 841
Dorfi, E. A., & B¨ohringer, H. 1993, A&A, 273, 251 Drury, L. O’C. 1983, Rep. Prog. Phys., 46, 973
Drury, L.O’C., Ellison, D. E., Aharonian, F. A., et al. 2001, Space Sci. Rev., 99, 1–4, 329
Ellison, D. C., Berezhko, E. G., & Baring, M. G. 2000, ApJ, 540, 292
Ellison, D. C., & Eichler, D. 1984, ApJ, 286, 691
Ellison, D. C., Slane, P., & Gaensler, B. M. 2001, ApJ, 563, 191 Enomoto, R., Tanimori, T., Naito, T., et al. 2002, Nature, 416, 823 Ghavamian, P. 1999, Ph.D. Thesis, Rice University
Giacalone, J., Burgess, D., Schwartz, S. J., & Ellison, D. C. 1993, ApJ, 402, 550
Heavens, A. F. 1984, MNRAS, 211, 195
Hughes, J. P., Rakowski, C. E., & Decourchelle, A. 2000, ApJ, 543, L61
Hwang, U., Decourchelle, A., Holt, S. S., & Petre, R. 2002, ApJ, 581, 1101
Jokipii, J. R., K´ota, J., & Giacalone, J. 1993, G.R.L., 20, 1759 Jones, F. C., & Ellison, D. C. 1987, JGR, 92, 11,205
Jones, F. C., & Ellison, D. C. 1991, Space Sci. Rev., 58, 259 Jones, F. C., Jokipii, J. R., & Baring, M. G. 1998, ApJ, 509, 238 Kazanas, D., & Ellison, D. C. 1986, ApJ, 304, 178
Koyama, K., Petre, R., Gotthelf, E. V., et al. 1995, Nature, 378, 255 Laming, J. M., Raymond, J. C., McLaughlin, B. M., & Blair, W. P.
1996, ApJ, 472, 267
Long, K. S., Reynolds, S. P., Raymond, J. C., et al. 2003, ApJ, 586, 1162
Malkov, M. 1997, ApJ, 485, 638 Malkov, M. 1998, Phys. Rev. E, 58, 4911
Malkov, M. A., Diamond, P. H., & Jones, T. W. 2002, ApJ, 571, 856 Malkov, M. A., & Drury, L. O’C. 2001, Rep. Prog. Phys., 64, 429 Raymond, J. C., Blair, W. P., & Long, K. S. 1995, ApJ, 454, L31 Reimer, O., & Pohl, M. 2002, A&A, 390, L43
Reynolds, S. P. 1998, ApJ, 493, 375
Reynolds, S. P., & Ellison, D. C. 1992, ApJ, 399, L75
Slane, P., Gaensler, B. M., Dame, T. M., et al. 1999, ApJ, 525, 357 Truelove, J. K., & McKee, C. F. 1999, ApJS, 120, 299

![Fig. 9.Particle[numberdistributions,N(p)(multipliedbyp/(mpc)]4 mp/M⊙) from the shocked ISM (FS) and shockedejecta (RS) at various times during the SNR evolution](https://thumb-us.123doks.com/thumbv2/123dok_us/1494551.1182960/11.595.293.526.86.339/particle-numberdistributions-multipliedbyp-shocked-shockedejecta-various-times-evolution.webp)

