Concrete Evaluation by Rader Application
P.Deepak Kumar1, V.S.Satheesh2
P.G. Student, Department of Civil Engineering, Adhiyamaan college of Engineering, Hosur, India1
Assistant Professor, Dept of Civil Engineering, Adhiyamaan college of Engineering, Hosur, India2
ABSTRACT: Ground penetration radar (GPR) methods are investigation to increase the delamination of concrete. This type of concrete is evaluated the potential to the direct wave of radar ground coupled antennas for the physical characterization of concrete in site. The concrete specimen are sized 700 x 700 x 300 mm were casted. The duct are placed downward the reinforcement and another duct is placed in between the reinforcement. Experiments are tested using GPR is detecting the duct and reinforcement. Result are evaluated the identification of reinforcement position, duct, depth and voids are considered using NDT Method.
KEYWORDS: Ground penetration radar, reinforcement position, duct, Non-destruction test Method
I.INTRODUCTION
To keep a high level of structural safety, durability and performance of the infrastructure in each country, for early and regular structural assessment is required. The quality assurance during and after the construction of new structures characterization of material properties and, damage as a function of time and environmental influences is more and more
become the concern. Non-destructive testing (NDT) ways have an oversized potential to be a part of such a system. NDT ways normally are many trade branches. Aircraft, Nuclear facilities, Chemical plants, Electronic devices, and alternative safety vital installations often with quick and reliable testing technologies.A variety of advanced NDT strategies square measure out there for bimetal materials. In recent years, innovative NDT strategies, which may be used for the assessment of existing structures, became ac concrete structures; however area unit still not established for normal inspections. Therefore, the target of this project is to the performance, availability, complexity, and restrictions of NDT. The purpose of creating commonplace procedures for node structures of concrete structures is to qualify and quantify the fabric properties of unmoved concrete whereas not intrusively examining t properties. There are several techniques that are presently being analyzed for the NDT of materials these days. These chapter focus on ways relevant to the scrutiny and observation of concrete materials.
1.2 Need for non-destructive testing
Nondestructive check ways arm applied for the investigation of concrete structures. This increase within the application of NDT ways is because of the variety of technological improvements in hardware and software for data collection and analysis;
• The economic advantages in assessing concrete compared with coring; • Ability to perform comprehensive assessments of existing construction • Specification for quality assurance of deep foundations and concrete repairs.
• This increased use of NDT methods is occurring despite the l standards for many of the methods.
II EXPERIMENTAL PROCEDURES
Fig 2.1 GPR equipment system ready for scanning
2.1 Two dimensional data collection setup
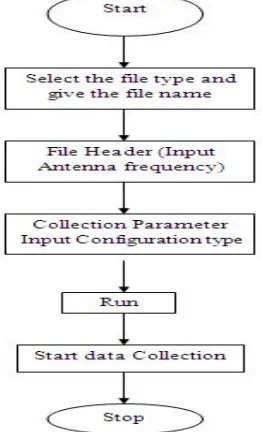
2-D data collection has three types of files parameters with extension (*.).They are project files (*.rpj), data files (*.dzt) and macro files (*.cmf). In these, actual radar profiles are stored in data files only in RADAN program. The data files take its name and acquisition from project file. It is a files header which contains acquisition parameter settings. In the file header dialog box, the values of dielectric constant, number of samples to be taken per scan and scan per second are given as input. Similarly in configuration window select the type of utility (i.e. concrete) and antenna frequency.
Then data collection setup screen will appear, click on run button, and then start data collection by moving the antenna along the line profile. The reflected scanned signals are collected as 2-D image in the line scan mode.2-D data collection is speedy and ease to work but it is used for visually noticing the presence of target in the field. The schematic flow chart representation of 2-D data collection mode sequence is given in figure 2.2.
2.2 Three dimension data collection setup
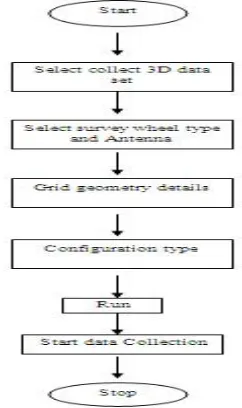
Collect 3-D data set is selected in the header files then the file name and title of project is given then selects the mode of survey wheel calibration. Then input survey area dimension and grid size in the grid geometry window. Figure 5.3 shows input geometry window for 3-D data collection, configuration and its geometry window for 3-D data collection. Then start data collection by moving the antenna from axis (0, 0) along X-direction window at scanning mode. The reflected signals are stored along the grid profile after completion of scanning. (Fig.2.3).The collected data will be processed and 3-D solid cube model will appear on the screen. This method is easy for imaging since we have guide grid profile on the screen itself. Geometry window are shown in Fig.2.3. (a) and Data collection mode window are shown in Fig.2.3 (b).
In this method of collection it is possible to visually identify the track of target as they twist and turn. The schematic flow chart representation of 3-D data collection mode sequence is given in figure 2.4.
Fig 2.4 Flow chart of 3-D Data Collection sequence
III. EXPERIMENTAL INVESTIGATION
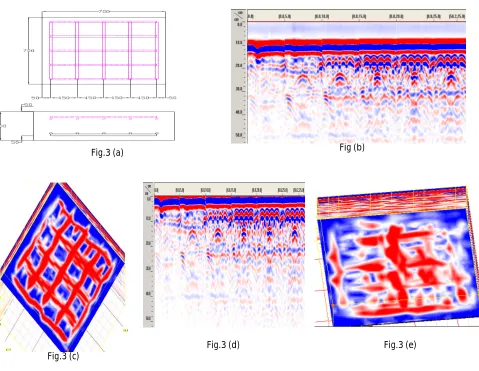
The specimen of size 700 X 700 X 300 mm contain top and bottom reinforcement with 16mm diameter 150mm center to center in both direction. Figure 3 (a) shows the plan and cross section of specimen. The radar data was collected with 1.6 GHz antenna. Figure 3 shows the collection of data with the SIR- 20 GPR system. Figure 3 (b) shows the line scan
obtained of a single line. The line scan was transferred into migration and position ranged and Figure 3 (c) shows the line scan after position ranging. The inverted hyperbolas represent the presence of reinforcement. After collection of radar data it was processed using the RADAN software. Figures 3 (d) and 3 (e) show the images of top and bottom reinforcements after processing.
Fig.3 (a) Fig (b)
Fig.3 (c)
Fig.3 (d) Fig.3 (e)
3.1 CONCRETE SPECIMEN
3.1.1 Duct is placed below the Reinforcement:
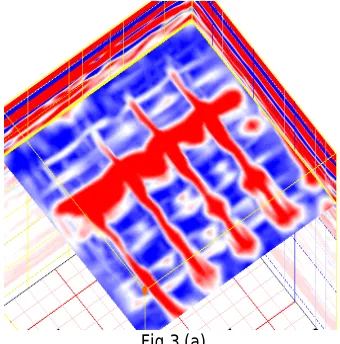
The Slab specimen -1 of size 700 X 700 X 300mm, M25 Grade concrete and Fe415 steel bars were used. Contains both top and bottom reinforcement, top reinforcement contains 16mm diameter 150mm centre to centre in both the direction, size of the mesh is 600mm and bottom reinforcement contains 8mm diameter in one direction and 6mm diameter in another direction of spacing 200mm center to center in both direction. Duct is placed below the reinforcement at the depth of 130mm from top and diameter of duct is 55mm.Size of the geometric grid is 50mm.
The duct is not detected. Figure 3.1 shows the image of top reinforcement Figure 3.1 (a) shows the image of top reinforcement after processing.
3.1.2 Duct is placed between the Reinforcement:
size of the mesh is 600mm and bottom reinforcement contains 8mm diameter in one direction and 6mm diameter in another direction of spacing 200mm center to center in both direction. Duct is placed below the reinforcement at the depth of 95mm from top and diameter of duct is 55mm. Size of the geometric grid is 50mm.
Fig.3.1.1 (a) Fig.3.1.1. (b)
Top reinforcement is not get clearly due to effect of duct; Figure 3.1.1(a) shows the top reinforcement with effect of duct. Figure 3.1.1(c) shows the image of duct. Image of bottom reinforcement is not detected clearly. Figure 3.1.1(d) shows the image of Bottom reinforcement Figure 3.1.1 (e)
IV. CONCLUSION
Nondestructive techniques such as Rebound hammer, Ultrasonic Pulse Velocity testing, etc. are commonly employed for the evaluation of quality of hardened concrete at site. The latest and advanced technique namely Ground Penetrating Radar (GPR) is gaining importance for the condition assessment of concrete structures such as bridges, tunnels, pavements, etc. The GPR has several advantages namely identification of reinforcement bars, PVC pipes and other materials present inside the concrete and can be viewed as an image. In addition the voids can also be determined. A large area can be scanned in a short period of time. In this project, the identification of reinforcement in RC structures and ducts in pestered concrete structures have been studied in detail by simulating in sand and coarse aggregate. The effect of reinforcement spacing in the identification of duct is also studied. In addition concrete specimens containing ducts were also evaluated. The conclusions from the studies made are given below:
1. Based on the experiments and test results, the Ground Penetrating Radar is useful in detecting the duct and reinforcements.
2. For 16 mm diameter bar at 150 mm spacing, both top and bottom mats can be deducted when the clear gap is more than 136 mm between top and bottom reinforcement. However the image is not clear.
3. For 16 mm diameter bar at 150 mm spacing, the top mat can be deducted clearly when it shifted more than 50 mm compared to bottom mat.
4. For 16 mm diameter bar at 150 mm spacing, bottom mat can also be deducted when the top mat is shifted by 50 mm.
5. The duct can be deducted clearly if it is placed away from the 16 mm bar by more than 50 mm. 6. The image of the duct is not clearly seen if it is placed just below the 16 mm bar.
7. For 32 mm bar of 50 mm clear spacing and more, the same may be deducted but the image is not clear because of the presence of bottom reinforcement.
8. The duct placed under 32 mm bar cannot be deducted because of the influence of the top bar.
9. It is possible to locate the reinforcement position inside the concrete, but several reinforcement meshes placed at layer is difficult to identify.
10. The spacing of the grid should be less than or equal to the reinforcement spacing for identifying the reinforcements. 11. For a newly concreted specimen, only the reflectors steel materials such as reinforcements can be identified. 12. Age of the concrete affect the accuracy of the result.
REFERENCES
1.Vega PEREZ-GRACIA, Daniel DI CAPUA1, Ramón GONZALEZ-DRIGO, Lluis G.PUJADES, (2009), “GPR resolution in NDT studies of structural elements: experimental methodology and examples”, NDTCE’09, Non-Destructive Testing in Civil Engineering, Nantes, France, June 30th – July 3rd, 2009.
2. Vega Perez-Gracia, Ramon Gonzalez-Drigo, Daniel Di Capua, (2008), “Horizontal resolution in a non-destructive shallow GPR survey: An experimental evaluation”, NDT&E International, 41 (2008) ,611– 620.
3. X. Yin, D.A. Hutchins, G.G. Diamond, P. Purnell, (2010), “Non-destructive analysis of concrete employing a electrical phenomenon imaging technique: Preliminary modelling and experiments”, Cement and Concrete analysis forty,, 1734-1743.
4. Srinivasan, P., “Advanced non-destructive test methods for concrete structures – Experimental Studies carried out at BAM”, December 2007.
5. Christiane Maierhofer, (2003), “Nondestructive Evaluation of Concrete Infrastructure with Ground penetrating radar”, Journel of materials in Civil Engineering, 287-297
6. Derobert. X, Aubagnace. C, Abraham. O, (2002), “Comparision of NDT techniques on a post-tensioned beam before its autopsy”, NDT&E International, vol. 35, 541-548
7. Lev Kofman, Amit Ronen, Sam Frydman, (2006), “Detection of model voids by identifying reverberation phenomena in GPR records,” Journal of Applied Geophysics 59, 284 – 299.
8.Francesco Soldovieri, RaffaelePersico, Erica Utsi, Vincent Utsi, (2006), “The application of inverse scattering techniques with ground penetrating radar to the problem of rebar location in concrete”, NDT&E International, 39, 602-607.
9. Christiane Maierhofer ,H.Wiggenhauser, (2003), “Detection of shallow Voids in Concrete structures with Impulse thermography and radar” NDT&E International journal volume 32.
11. Susan S.Hubbard, Jieying Zhang, (2004), “Experimental Detection of reinforcing bar corrosion Using Nondestructive Geophysical Techniques” ACI Materials Journal, Dec-2004.
12. X. Ferrieres, etal (2009), “Evaluation of the concrete electromagnetics properties by using radar measurements in a context of building sustainability”, Computer Physics Communications 180 1277–1281.
13.Klysz.G ,Balayssac.J.-P, (2007), “Determination of volumetric water content of concrete using ground - penetrating radar”, Cement and Concrete Research, 37, 1164-1171.
14. Laurens. S, etal (2007), “Aptitude of the near-field direct wave of ground-coupled radar antennas for the characterization of the cover concrete”, Construction and Building Materials, 21, 2072-2077.