INVESTIGATION
An Organelle Gatekeeper Function
for
Caenorhabditis elegans
UNC-16 (JIP3)
at the Axon Initial Segment
Stacey L. Edwards,* Szi-chieh Yu,†Christopher M. Hoover,* Barret C. Phillips,*,1 Janet E. Richmond,†and Kenneth G. Miller*,2 *Genetic Models of Disease Program, Oklahoma Medical Research Foundation, Oklahoma City, Oklahoma 73104, and
†Department of Biological Sciences, University of Illinois at Chicago, Illinois 60607
ABSTRACTNeurons must cope with extreme membrane trafficking demands to produce axons with organelle compositions that differ dramatically from those of the cell soma and dendrites; however, the mechanism by which they accomplish this is not understood. Here we use electron microscopy and quantitative imaging of tagged organelles to show thatCaenorhabditis elegansaxons lacking UNC-16(JIP3/Sunday Driver) accumulate Golgi, endosomes, and lysosomes at levels up to 10-fold higher than wild type, while ER membranes are largely unaffected. Time lapse microscopy of tagged lysosomes in living animals and an analysis of lysosome distri-butions in various regions ofunc-16mutant axons revealed thatUNC-16inhibits organelles from escaping the axon initial segment (AIS) and moving to the distal synaptic part of the axon. Immunostaining of nativeUNC-16inC. elegansneurons revealed a localized concentration ofUNC-16at the initial segment, althoughUNC-16is also sparsely distributed in distal regions of axons, including the synaptic region. Organelles that escape the AIS inunc-16mutants show bidirectional active transport within the axon commissure that occasionally deposits them in the synaptic region, where their mobility decreases and they accumulate. These results argue against the long-standing, untested hypothesis that JIP3/Sunday Driver promotes anterograde organelle transport in axons and instead suggest an organelle gatekeeper model in whichUNC-16(JIP3/Sunday Driver) selectively inhibits the escape of Golgi and endosomal organelles from the AIS. This is thefirst evidence for an organelle gatekeeper function at the AIS, which could provide a regulatory node for controlling axon organelle composition.
N
EURONS have a unique cell biology that presents daunting membrane trafficking challenges. For exam-ple, they must selectively transport two classes of regulated secretory vesicles (synaptic vesicles and dense core vesicles) long distances into axons, but only after the vesicles have completed their maturation process in the cell soma, during which they arise from, and interact with, other organelles in the soma. Neurons must also restrict, or even prevent, theflow of some organelles, such as Golgi, lysosomes, and endo-somes, into the distal synaptic region of axons, which are relatively devoid of these organelles compared to cell somas.
However, under special conditions, such as the need for axon repair or growth, neurons may require these organelles in axons. The potential hazards of excessive organelle transport into axons may include organelle traffic jams within narrow axons, reduced synaptic vesicle production as synaptic ves-icle proteins are transported away from the cell soma before they are assembled into mature vesicles, and the disruption of membrane trafficking pathways in the synaptic region of axons caused by the inappropriate presence of cell soma organelles.
A crucial regulatory domain for controlling axon compo-sition is the region at or near the junction of the cell soma and axon, designated the axon initial segment (AIS). The available evidence suggests that this region is not a uniform structure, but rather a cluster of specialized subdomains that perform at least two major functions (Grubb and Burrone 2010). First, in animals with sodium channels, this region serves as the site of action potential initiation. Second, it
Copyright © 2013 by the Genetics Society of America doi: 10.1534/genetics.112.147348
Manuscript received December 1, 2012; accepted for publication January 15, 2013 Supporting information is available online athttp://www.genetics.org/lookup/suppl/ doi:10.1534/genetics.112.147348/-/DC1.
1Present address: Department of Biological Sciences, University of Southern
California, Los Angeles, CA 90089-0371.
2Corresponding author: Oklahoma Medical Research Foundation; 825 Northeast 13th
provides a barrier or filtering function for establishing the molecular composition of axons. The barrier/filtering func-tion is known to affect the movement of molecules along the plasma membrane (Winckler et al.1999). However, a role for the AIS in regulating organelle flow into axons has not yet been established.
If the AIS has an organelle barrier function, genetic studies in model organisms could identify its molecular components by isolating mutants in which specific organ-elles accumulate at abnormally high levels in the distal regions of axons. Genetic studies have found that mutations in the Sunday Driver gene SYD (theDrosophilaortholog of JIP3) cause massive axonal accumulations of various un-identified membrane compartments (Bowmanet al.2000). However, that study proposed that the axonal accumulations resulted from stalled organelle transport rather than over-active or unregulated organelle transport. The logic behind the stalled transport model is based on the fact thatfly SYD mutants die as larvae and thus must be derived from het-erozygous mothers. The model predicts that a small amount of wild-type SYD from maternally contributed mRNA per-mits cargo to enter the axons of homozygous mutant larvae, but that organelle transport stalls as the maternal supply is de-pleted, leaving the organelles stranded in the axons (Bowman
et al. 2000). However, this interpretation has not been tested, and it is unclear why a gradual stall in transport would cause massive accumulations of organelles in axons instead of normal or even lower-than-normal levels of stalled organelles.
Studies of Caenorhabditis elegans mutants with im-paired UNC-16 (the worm Sunday Driver/JIP3 ortholog) seem to contradict the stalled transport model. unc-16
loss-of-function mutations cause synaptic vesicle proteins to move into axons by a transport mechanism that is in-dependent of the KIF1 motor that normally transports mature synaptic vesicles (Byrd et al. 2001), and unc-16
mutations are associated with axonal accumulations of unidentified membranous cisternae (Brown et al.2009). These phenotypes cannot be a function of maternal UNC-16, becauseunc-16 null mutants are homozygous viable and thus have no maternal contribution of wild type
unc-16mRNA.
In the current study we used time lapse imaging of tagged organelles in the axons of living animals to show that
UNC-16inhibits organelle transport into axons, rather than promoting organelle transport as predicted by the stalled transport model. We show that the accumulation of organ-elles in UNC-16 (JIP3) mutant axons results from the im-pairment of a previously unrecognized organelle gatekeeper function that selectively restricts theflow of Golgi and endo-somal organelles, but not endoplasmic reticulum (ER) mem-branes, beyond the axon initial segment. A JNK-1 MAP kinase signaling pathway contributes toUNC-16’s organelle gatekeeper function, suggesting that wild-type animals reg-ulate the organelle content of their axons in response to signals.
Materials and Methods
Worm culture and strains
Worm culture and manipulation essentially followed pre-viously described methods (Brenner 1974; Stiernagle 2006). Briefly, culture media was modified NGM, containing no added calcium or magnesium, and consisted of the follow-ing (per liter): 2 g NaCl, 3.1 g peptone, 3.0 g KH2PO4, 0.5 g
K2HPO4, and 20 g Sigma A-7002 agar. After autoclaving
and cooling to 55 the following was added (per liter): 1.6 ml 5 mg/ml cholesterol in ethanol, 1.0 ml of 100 mg/ml streptomycin in ddH2O, and 1.25 ml of 10 mg/ml mycostatin
suspension in ethanol. Prior studies define the culture plate types“spread plates,” “streak plates,”and“ locomo-tion plates”(Milleret al.1999; Edwardset al.2008). Wild-type worms were the N2 strain and the mapping strain
CB4856.File S6lists the complete genotypes of all strains used in this study. We maintained strains containingdhc-1
(or195ts)at 14. Forward genetic screen
The goa-1(sa734) suppressor screen has been previously described (Edwards et al. 2009). Briefly, we mutagenized L4-stagegoa-1mutants with 46 mM ethyl methanesulfonate (EMS) in M9 (Sulston and Hodgkin 1988). We plated syn-chronous F2 grandprogeny of the mutagenized animals as
young larvae on 24-well culture plates using a repeat pipet-tor to plate100 animals in each well for a total of 600,000 F2animals in 10 weekly cycles. We grew the cultures 2 days
at room temperature and 4 days at 20after plating, and screened the F3generations. We then screened the wells for
mutants with improved growth and reduced hyperactive behaviors.
Mapping, identification, and outcrossing of mutations
Before mapping the new suppressor mutations, we sepa-rated the mutations fromgoa-1(sa734)by crossingN2males to the suppressed strain and isolating putative suppressor single mutants in the F2generation based on their predicted
sluggish phenotype. We kept animals that were both homo-zygous for the mutation and did not segregategoa-1(sa734)
as one time outcrossed strain stocks. We then mapped the
ce421mutation relative to single nucleotide polymorphisms (SNPs) to a 7-Mb region in the center of chromosome III using a previously described method (Schade et al.2005). The mapping data for 47 mapping lines were as follows (listed in left–right order on the chromosome with the re-combination frequency in each interval in parentheses):
ceP37 (3/47) ce421(1/47) ceP168. The SNPs are located as follows (SNP names are followed by genome location, base pair change, and the restriction enzyme that can iden-tify the SNP):ceP37[III:3,391,534 (G/A Bgl II)] andceP168
[III:10,361,701 (G/C Mnl I)]. A complementation test with the mutantunc-16(e109), done by crossinge109/+males to
Similar complementation tests identifiedce451andce483as
unc-16 alleles. PCR amplification and sequencing of the
unc-16 gene coding region ince421,ce451, andce483 mu-tant genomic DNAs revealed a nonsense mutation in each of these mutants. We outcrossed ce421 and ce483 five times each and ce451once, to N2.dhc-1(or195) (Caenorhabditis
Genetics Center), andunc-116(e2310)(also known ase2281;
Caenorhabditis Genetics Center) had previously been out-crossed at least four times to wild type and we did not further outcross them.
Plasmids and PCR products
Supporting information, File S1 lists all of the DNA con-structs used in this study (plasmids and PCR products) along with construction details. In all constructs involving the cloning of PCR fragments, we sequenced the inserts and used clones containing no mutations in the fragment of in-terest to establish the plasmid stock. We produced sense– antisense (sas) fusion PCR products for cell-specific RNAi using a previously described method (Esposito et al. 2007). Briefly, we used Herculase II (Stratagene) and Expand 20 kb+ (Roche) and fusion PCR with overlapping primers to fuse the 2.6-kb unc-129 promoter with a 2-kb unc-116
genomic-rich region in forward and reverse orientations to allow sense and antisense RNAs to be formed in motor neurons in which the unc-129promoter is active.
Transgene production
We prepared plasmids for microinjection using the Qiagen Tip-20 system according to the manufacturer’s instruc-tions, except that we added a 0.1-M potassium acetate/ two volume ethanol precipitation step (30 min on ice; 10 min · 15,000 rpm microcentrifuge spin at 3, wash with 300ml220cooled 70% ethanol, spin for 5 min as above, and air dry the pellet 3–5 min before resuspending in 50 ml ddH2O) after resuspending the isopropanol-precipitated pellet. We prepared high-fidelity PCR products for microinjection by purifying with Wizard PCR Prep (Thermo Scientific) and quantifying with a Nanodrop spectrophotometer (Thermo Scientific). We precipitated fusion PCR products for cell-specific RNAi using the above potassium acetate method and resuspended them in ddH2O. We produced transgenic strains bearing extrachromo-somal arrays by the method of Mello et al. (1991). For the colocalization experiments (producing the ceEx329,
ceEx346,and ceEx353 arrays), the host was KG2338 unc-16(ce483). For theunc-116(e2310);ceIs56rescue experi-ment the host was KG1942. For strains bearingceEx305or
ceEx309arrays the host was KG2430. For all other injec-tion experiments, N2 was the host. We used pBluescript carrier DNA to bring the final concentration of DNA in each injection mixture to 175 ng/ml and integrated arrays into the genome as described (Reynoldset al.2005), using 9100 rad of gamma rays.File S6lists all of the transgenic arrays in this study, their DNA contents, and the injection concentration of each DNA.
C. elegans strain constructions
We constructed double mutants using the standard method of crossing heterozygous males of mutant A with homozy-gous hermaphrodites of mutant B and cloning virgin F1cross
progeny. From plates segregating mutant A in their F2
prog-eny, we cloned mutant A and/or B animals and looked for segregation of the double mutant in the next generation. For doubles with transgenes, we cloned candidate doubles di-rectly from the F2progeny and chose one line homozygous
for the fluorescence marker and behavioral phenotypes in the next generation. To make doubles with the temperature sensitive (ts) sterile mutation dhc-1(or195ts), homozygous or putative homozygous or195animals were grown at 14 or, if testing for or195 homozygosity, young adults were grown at 25for 1 day before transferring parental animals back to 14 to restore viability and leaving the eggs that were laid at 25for 24 hr to test for 100% embryonic lethal-ity. To produce the closely linked unc-116(e2310) unc-16
(ce421) double mutant, we cloned 122 Unc-116 mutant animals from the progeny of e2310/ ce421 transheterozy-gotes and, after incubating these cultures 4 days at room temperature, identified rare cultures segregating double mutants. For double mutants, we verified the homozygosity of both mutations by amplifying and sequencing both loci from genomic DNA.
Statistical analysis
We performed all statistical comparisons using the unpaired
t-test, Welch corrected, via Graphpad Instat 3 or Graphpad Prism software.
Live animal assays
The live animal assays have been described in detail in previous studies: locomotion assays (Milleret al.1999; Reynolds
et al.2005) and population growth rate assays (Williamset al.
2007).
Electron microscopy
Young adult hermaphrodites for each strain were prepared for high-pressure freezing as described (Rostainget al.2004). Briefly, 10–15 animals were loaded in a specimen chamber
(Tokyo) transmission electron microscope operating at 80 kV. Micrographs were collected using a Gatan digital cam-era (Pleasanton, CA) at a magnification of·100. Morpho-metric analysis of both ventral and dorsal nerve cord serial sections was scored blind. Images were quantified using National Institutes of Health Image software. A syn-apse was defined as a set of serial sections spanning the presynaptic density plus two flanking sections on each side.
Quantitativefluorescence imaging and image analysis
Growth and mounting of strains:We produced live adults for imaging fluorescent-tagged proteins by plating 10–14 L2-stage larvae on each of five locomotion plates and growing 5.5–6 days at 20 to produce next generation young adult progeny (growth times and numbers plated were modified as necessary for slow growing mutants). Approximately 50 young adults were selected and trans-ferred to an unseeded plate, from which we loaded them into a 30-ml drop of 30 mg/ml 2, 3-butanedione monoxime (BDM) (Sigma, B0753) (Sieburthet al.2005) in M9 buffer on a coverslip, which we incubated for 10 min (from the time the animals first touch the drop) on a moistened 1.5-cm Kimwipe square under a Petri plate lid. We then removed27ml of the solution using a P20 microinjection tip (Eppendorf, 5242 956.003), leaving the worms behind in a small amount of anesthetic. We inverted the coverslip onto a 2% agarose pad (Sulston and Hodgkin 1988), with the agarose dissolved in M9 buffer. After straightening the coverslip slightly and nudging it 1 mm to help with dorsal/ventral orientation, we sealed two diagonal corners with a dab of clear nail polish and imaged animals over the next 35–55 min. To grow dhc-1(or195ts)-containing strains for imaging, we produced freshly starved cultures containing a high density of L1 larvae. We then transferred these animals to spread plates and grew them 40–52 hr at 25.5before selecting young adults for imaging (the exact time of growth was modified based on the growth charac-teristics of the strain).
Collecting images:We collected images at 22using a Nikon Eclipse TE2000-E inverted microscope equipped with a Nikon CFI Apo TIRF 100·/1.49 numerical aperture (N.A.) objective, a Nikon motorized linear-encoded high-resolution z-drive, a SmartShutter ultrafast shutter with a Lambda SC controller and a foot pedal switch (Sutter Instruments), and a motorized filter turret containing GFP, CFP, YFP, and Texas Red image-registered filter cubes (Semrock). Our il-lumination source was an X-Cite 120Q illuminator (EXFO, Montreal, Canada), and we captured 12-bit images with an ORCA-AG camera (Hamamatsu, Bridgewater, NJ) controlled by Metamorph Premier software (versions 6.3 r1 and 7.7 were used over the course of this study). We only collected images from animals with their ventral or dorsal surfaces facing the objective. We collected dorsal cord images from a region extending posterior from a point10mm anterior
to the vulva. For lines expressing markers from theunc-129
promoter we collected ventral soma images from the DA6 and DB6 neurons (imaged together and quantified as one region). We used Metamorph to acquire a 0.243 mm·11 slice z-series (automatically closing the shutter between exposures) with 150-msec exposure times. Exposure times were adjusted down for some arrays to prevent chip satura-tion. We collected all images for an experiment at identical light source powers and repeated collections of the wild-type strain every sixth imaging session in an experiment. Before imaging each strain, we measured the light power of the peak emission wavelength at the objective plane using an XR2100 power meter (Lumen Dynamics) and an XP750 objective plane light sensor (Lumen Dynamics) with the stage position set at a standard distance (z-position) from the objective. We then used the XR2100 light guide insertion port to determine the total light power necessary to achieve the targeted light power at the objective. Total light power was then measured just prior to acquiring each image stack. If necessary, we adjusted the light power to within 1% of the target value by adjusting the extent to which the light guide was pushed into the exit port of the X-Cite 120Q. Typical total light powers were kept rel-atively low at 2.1 W (of 4.0 W maximum) to reduce photobleaching.
Processing and quantifying images:To process the images, we used AutoDeblur Gold CWF (Media Cybernetics) to deconvolve the image stacks using the adaptive point spread function blind method and 10 iterations at the low noise setting. After deconvolving, we produced max-imum intensity projections of each image stack and, for display images, set a scaling value that was used for all images in the experiment. To quantify dorsal axonfl uores-cence intensities per micrometer, wefirst tightly traced the dorsal cord across the entirefield of view using the Trace Region tool in Metamorph (version 6.3, or 7.7 for later experiments) and obtained the total integrated fl uores-cence in the region. We then copied this region and shifted it onto a region of the animal immediately adjacent to the cord to obtain the background value. We used the Multi-line tool to obtain the length of the region. Data were logged to a spreadsheet, which subtracted the background and computed the totalfluorescence per micrometer of cord length. To quantify ventral soma intensities per square micrometer from lines expressing markers from the unc-129 promoter, we traced the DA6 and DAB6 cell somas and the dendrite process between them as a single region, produced a background region as above, and used a spread-sheet to compute the background-corrected intensity per square micrometer. When tracing cell soma areas of
CTNS-1-RFP images, wefirst traced the soma region from a coexpressed marker such as NLP-21-Venus (for ceIs56) or GFP-RAB-5(forceIs81) and then copied the region onto the
dorsal axons for Figure 3 and Figure 5, we used the Meta-morph Thresholding feature to define a threshold of intensity for objects to count and applied this threshold level to all images in the experiment. To count lysosomes in commissures we divided each commissure in laterally oriented, unanesthe-tized animals mounted in polybeads on 10% agarose pad slides (see below) into four equal regions: thefirst half of the dis-tance between the ventral side of the animal and the center line of the animal; the second half of the distance between the ventral side of the animal and the center line of the animal; the
first half of the distance between the center line of the animal and the dorsal side of the animal; and the second half of the distance between the center line of the animal and the dorsal side of the animal. These correspond to regions 2–5 in the Figure 5 schematic. Starting at the posterior-most commissure and proceeding anteriorly, for each commissure we focused on the highest point of the commissure using a GFP filter (the transgene coexpresses soluble GFP and CTNS-1-mCherry), switched to the Texas Redfilter, and focused through the entire visible portion of the commissure, noting the number of lyso-somal puncta in the four regions using four tally counters. We kept thefluorescence diaphragm on the microscope maximally closed to restrict the excitation light to the commissure of in-terest. The cell somas, region 1, and the synaptic region (re-gion 6) were generally not visible in laterally oriented animals; lyosome counts of those regions come from ventrally and dor-sally oriented animals.
Producing representative images: After quantifying an image set we produced representative images for display by saving 8-bit versions of an image that was close to the mean6 standard error for the set. All images were scaled identically to the reference strain for each experiment. To crop images that show up as black due to low signal levels, wefirst produced an image scaled bright enough to see the subject and rotated and cropped the brightened image, not-ing the rotation and croppnot-ing coordinates. We then identi-cally rotated and cropped the properly scaled version of the image.
Time lapse imaging and analysis of organelle movements
Mounting unanesthetized animals: We produced 10% agarose pads by mixing 0.175 g of agarose and 1.75 ml of M9 buffer in a 2-ml screw-cap freezer tube (Sardstedt). We placed the tube with its cap tightened in 20 ml of water in a 50-ml beaker and autoclaved it for 5 min, after which we transferred it to a 95hot block. After preheating two glass slides on the hot block for1 min, we then arranged a taped slide (a slide with one layer of lab tape plus one layer of 3/4 inch Scotch tape) on each side of the mounting slide on the hot block. Using a small spatula we scooped agarose onto the slide and then compressed it with the other prewarmed slide, pressing down evenly to make a surface of even thick-ness. We removed the slide sandwich from the hot block and, after1 min, removed the top slide, added a coverslip
to the pad (to maintain a smooth surface), and stored it in a humidified chamber at 4 for up to 2 weeks. To mount animals, we prepicked45 young adults from growing cul-tures to an unseeded culture plate. We lifted the protective coverslip from the agarose pad and added 5–7.5ml (depend-ing on pad diameter) of Polybead microspheres (Polyscien-ces, 00876-15) to the center of the agarose pad. We used a pick with a gob of bacteria to transfer the animals to the Polybead suspension while viewing the transfer through the stereomicroscope. Shaking the pick vigorously in the drop promoted an even distribution of animals. We then used the pick to expand the area of the drop, approximately doubling its diameter. We used jewelers’forceps to mount a no. 1 1/2 coverslip over the drop and sealed two corners withfi nger-nail polish.
Time lapse imaging of lysosomes in commissures: We collected time lapse images using the same microscope, objective, and illumination system described in the Fluores-cence Imaging section, except that we lowered the light source power to 1.5 W (to reduce phototoxic effects) by adjusting the extent to which the light guide was pushed into the exit port of the illumination source, measuring the light power as described above. For the high-resolution mov-ies of organelles transiting between cell somas or axons and commissures, we used 0.5–1.0 mm“rotational nudging”of the coverslip before applying nail polish to encourage ori-entations with the ventral or dorsal side of the animal facing the objective. On dorsally or ventrally oriented animals we then used Metamorph 6.3r4 to acquire 25- or 50-msec single plane exposures at 2-sec intervals for 4–20 min, making small adjustments to the fine focus manually during the 2-sec intervals to keep the region of interest in focus. To image large regions for representative movies for quantifi -cation of spot movement speeds and processivity, we used Metamorph 6.3r4 to acquire a 16-plane z-series (0.24 mm spacing) of 50-msec exposures centered on a commissure of interest every 30 or 60 sec in a 10-min time course. “ Com-missure of interest” was defined as the first commissure containing two or more CTNS-1-GFP spots when scanning the length of an animal. We collected only one time course from each animal with a commissure of interest, although in some cases the image contained two or three commissures of interest. We did not begin collecting a new time course if the slide was.45 min old. We then used“Review Multidi-mensional Data”in Metamorph 6.3r4 to make a maximum projection at each time point. We used “Track Points” in Metamorph 6.3r4 to measure distances of spot movements. “Movement”was defined as a spot translation of.0.5mm. A movement ends when the spot pauses, changes direction, or exits thefield of view or focal plane.
in which the stuttering occurred and determined the direc-tion of movement (anterograde or retrograde) based on the location of the ventral somas. We then used the Metamorph Track Points tool to determine the distance traveled (until the spot left the focal plane). We noted the z-plane start and end of the movement and used an Excel spreadsheet to calculate the time elapsed as a fraction of the total time of the z-series. We experimentally measured the total time of a 16-plane z-series with 50-msec exposures as 9.39 sec 6 0.026 standard error of the mean (N= 7). This total time was divided by 15 (because the readout time of the final plane was not timed in this measurement) to give a “time per plane”of 626 msec.
Recording lysosome movements to and from the cell soma and axon initial segment: We mounted animals as de-scribed above forTime Lapse Imaging of Lysosomes in Com-missures, using 0.5–1.0 mm “rotational nudging” of the coverslip before applying nail polish to encourage orienta-tions with the animal’s ventral side facing the objective. To prevent the excitation light from affecting other cell somas on the same animals, we closed thefluorescence diaphragm such that only the cell soma(s) of interest were illuminated, and we adjusted the light power as described above to 1.5 W to reduce photobleaching. We used the transgene’s soluble GFP signal to focus on a cell soma and commissure, and then collected 151 images in the Texas Red channel (forCTNS-1 -mCherry) at 2-sec intervals, using a 50-msec exposure time. Every 10th frame we collected a 30-msec GFP image to allow us to identify the cell soma and commissure. In the 2-sec intervals between exposures we adjusted the focus if necessary. We sometimes imaged up to three cell somas and commissures on the same animal, but did not begin a new time course unless it couldfinish before 20 min had elapsed from the time the coverslip was applied. We prepared the time lapse movies as described above, except we loaded both colors, duplicating the missing GFP images to fill in the intervals between every 10th frame, thus providing a green cell soma and commissure background.
Antibody production
To produce the affinity-purified UNC-16 antibody KM37A-5.1, we prepared a recombinant maltose-binding protein (MBP)-UNC-16(codons 1–462) fusion protein by transform-ing KG#657 [MBP-His10-UNC-16(1–462)] into the bacte-rial expression host BL21-DE3(RIL). We then induced expression of the protein for 4 hr at 30from a 5-liter culture at an A600of 0.4 using 30mM IPTG. We froze cell pellets in
liquid nitrogen and rapidly thawed them before resuspend-ing in 67 ml ice cold lysis buffer [20 mM HEPES, pH 8.0/300 mM NaCl/10 mM bme/10 mM imidizole/1 mM PMSF/0.3 mM EDTA/1 mg/ml pepstatin/1 mg/ml leupeptin/0.255 mg/ml lysozyme (Sigma L-6876)] per liter of culture. All steps hereafter were at 4. To lyse, we stirred the suspension for 30 min and then added 5 mg of DNAse (Sigma; D-4527) and 400ml of 1 M MgSO4 and incubated 30 min with stirring.
After clearing the lysate with a 30-min 33,000·gspin, we loaded it at 0.5 ml/min onto a 5-ml Ni-NTA agarose (Qiagen) column hooked to a Biologic (Bio-Rad) low-pressure chromatography system. We washed the column with 100 ml of lysis buffer and then eluted with 25 ml of lysis buffer + 250 mM imidizole while collecting 1-ml fractions. We dia-lyzed peak fractions containing the fusion protein for 20 hr at 6in 4 liters of dialysis buffer (20 mM HEPES pH 8.0, 150 mM NaCl, 5 mM bme) supplemented with 2% w/w His6-TEV [S219V] protease, which we purified from a pRK793 bacte-rial lysate as described (Kapust et al.2001). We then drip-ped the dialysate over a fresh 5-ml Ni-NTA agarose column to rebind the His6-TEV protease, the cleaved MBP–His10 fusion partner, and any uncleaved fusion protein, chased with 15 ml of dialysis buffer, and concentrated theflow thru to 3.5 mg/ml using centrifugal concentrators (Millipore) for a total yield of 31.5 mg ofUNC-16(1-462; 53.3 kDa) with a purity of90%.
We further purified 1000mg of the protein on two SDS– PAGE gels, excised and homogenized the Coomassie-stained gel band in a 10-ml Kontes Potter-Elvehjem tissue grinder, using a drill press such that thefinal concentration was 250 mg/ml of gel suspension. We sent the suspension to Covance (Denver, PA) for injection into a rabbit (250 mg initial in-jection + four 125mg boosts at 3-week intervals). To affinity purifyUNC-16-specific antibodies we ran out 1000mg of the purified protein on two SDS–PAGE gels and blotted to ni-trocellulose. After staining the blots with Ponceau S, we excised the bands of interest and rinsed them in TBST (10 mM Tris, pH 8.0/150 mM NaCl/ 0.05% Tween-20). After blocking 30 min in TBST + 3% nonfat dry milk, we incu-bated 10 ml of theUNC-16antiserum with the nitrocellulose strips in a 15-ml conical for 2 hr at room temperature with gentle shaking. After washing the strips four times for 5 min in TBST and once in PBS, we eluted bound antibodies with 1.0 ml of 0.1 M glycine, pH 2.5 for 5 min, and neutralized the solution with 100ml of 1 M Tris, pH 8.0. We then eluted a second time with 0.2 M glycine, pH 2.3, neutralized with 79 ml of 1.5 M Tris base, combined the two eluants, and added 245ml of 10% BSA as a cryoprotectant.
Immunostaining
We prepared freeze-cracked 4% paraformaldehyde fixed worms for immunostaining as described (Charlie et al.
2006a,b). For immunostaining UNC-16, we coimmunos-tained ceIs123 [unc-129::GFP] and unc-16(ce483); ceIs123
fixed animals using rabbit anti-UNC-16(1/200; KM37A-5.1; this study) and mouse anti-GFP (1/500; mAb3E6; QBio-gene). We labeled theUNC-16primary antibody with a don-key anti-rabbit Dylight 550 secondary. We dual-labeled the GFP with donkey mouse Dylight 488 and donkey anti-mouse Dylight 650 secondaries, which allowed us to easily
find the signal using a GFPfilter and to assess permeabiliza-tion on camera images using a Cy5filter (since GFP can still
triple labeling ofUNC-16,UNC-17cholinergic synaptic vesicles, andUNC-13active zones, we coimmunostained wild-type ani-mals using rabbit anti-UNC-16(1/200; KM37A-5.1; this study), mouse anti-UNC-17 (1/5000 from monoclonal ascites fluid) (Duerr et al. 2001), and goat anti-UNC-13L (1/800; KM21E-3.1) (Charlieet al.2006b), using donkey anti-rabbit (Dylight 550), mouse (Dylight 488), and goat (Dylight 650) secondary antibodies. We used previously described methods for immu-nostaining offixed animals (Charlieet al.2006a,b), with the exception that we spread only 750 animals per slide at the
final mounting step.
Results
goa-1(sa734) suppressor mutations disrupt UNC-16 (JIP3)
InC. elegans, an inhibitoryGOA-1(Gao) pathway exerts its
effects on locomotion by a mechanism that is dependent on the EGL-30 (Gaq) pathway (Perez-Mansilla and Nurrish
2009). To investigate how theGOA-1andEGL-30pathways regulate synaptic activity, we undertook a large forward ge-netic screen for mutations that suppress the slow growing, sickly phenotypes and hyperactive behaviors of goa-1null mutants. The dual requirements of growth improvement and suppression of hyperactive behaviors produced a small number of prominent targets, includingEGL-30itself (Gaq,
34 mutants) and the Gaq effector UNC-73 (Trio RhoGEF
domain; 8 mutants) (Williamset al.2007). Here, we report our investigation of an unexpected target of this screen,
UNC-16, which encodes the soleC. elegans ortholog of hu-man JIP3 andfly Sunday Driver (SYD) (Bowmanet al.2000; Byrd et al. 2001). Our investigation has not yet revealed a direct connection between Gao/Gaqsignaling and
UNC-16, so this study focuses on the striking organelle trafficking defects we observed in theunc-16mutants.
The unc-16mutations we isolated are early stop codons and are thus likely to be null or near-null mutants (Figure S1A). Although unc-16 mutant adults are slightly shorter than wild-type adults, they are healthy and fertile as homo-zygotes, having population growth rates of 72% 6 3% of wild type (n = 3 populations; ce421 allele). Quantitative locomotion assays revealed that the three unc-16 mutants have similarly sluggish locomotion rates that are 15% of wild type (Figure S1B).
unc-16 null mutants accumulate high levels of golgi and endosomal organelles, but not ER membranes, in their axons
To identify potential membrane trafficking defects in neu-rons that might contribute to the sluggish locomotion of
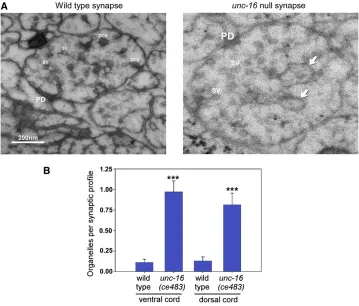
unc-16 mutants, we used high-pressure freezing electron microscopy to analyze the organelle content of unc-16 mu-tant axons. The EM analysis revealed that unc-16 null mutants accumulate organelles in their ventral and dorsal axons at levels that are approximately nine- and sixfold higher than wild type, respectively (Figure 1, A and B). To
identify the classes of organelles that accumulate inunc-16
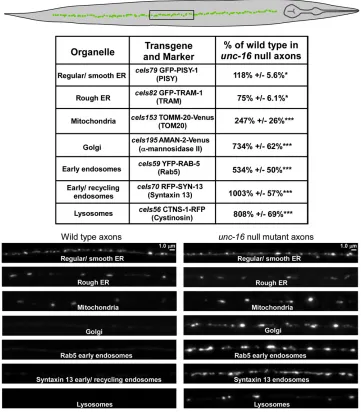
mutant axons (i.e., the organelles in the electron micro-graphs) we produced a series of integrated transgenes that use theunc-129promoter to express various organelle-specific
fluorescently tagged markers in a subset of nine chlolinergic motor neurons. The nine motor neurons have their cell somas and dendrites on the ventral side of the animal and their synaptic axonal regions on the dorsal side. A long axonal commissure crosses the animal’s body to connect the cell soma to the dorsal synaptic region. After crossing the transgenes into anunc-16null mutant background, we then imaged
de-fined axonal and cell soma regions in young adult animals and quantified the steady-state fluorescence (total fluorescence/ micrometer above background) of each organelle marker in those regions.
To quantify ER membranes we used the regular/smooth ER marker PISY-1(a worm ortholog of phospatidylinositol synthase) and the rough ER marker TRAM-1(a protein in-volved in translocation across the ER membrane). Both pro-teins have previously been shown to colocalize in a reticular pattern with each other and other ER markers when expressed from transgenes inC. elegansneuronal cell somas (Rollset al.2002). The axonal levels of the regular/smooth ER and rough ER membranes in unc-16 mutants were changed by ,20% of wild type, and the differences were only marginally significant (Figure 2).
To quantify mitochondria, we expressed the mitochon-drial membrane proteinTOMM-20-Venus, previously shown to localize to mitochondria by fluorescence nanoscopy (Watanabeet al.2011). The axonal levels ofTOMM-20-Venus in unc-16 mutants were elevated to 2.5-fold higher than wild type (Figure 2); however, this difference was relatively small when compared to the remaining markers and the or-ganelle levels we observed by EM.
The remaining markers tagged the Golgi, early/recycling endosomes, and lysosomes. We found that all of these markers accumulated inunc-16mutant axons at high levels.
AMAN-2-Venus (a-mannosidase II), which marks Golgi in
C. elegans neurons (Orci et al. 2000; Rolls et al. 2002; Sumakovic et al.2009); YFP-RAB-5, which marks early endosomes in C. elegans (Maxfield and McGraw 2004; Grosshanset al.2006; Grillet al.2007); RFP-SYN-13(Syntaxin 13), which marks early/recycling endosomes inC. elegans neu-rons (Prekeriset al.1998; Chunet al.2008); andCTNS-1-RFP (Cystinosin, a lysosome-specific cysteine transporter), which marks lysosomesin C. elegans(Kalatziset al.2001; Mangahas
et al. 2008) accumulated in unc-16mutant axons at levels that were 7-, 5-, 10-, and 8-fold higher, respectively, than wild type (Figure 2). The fold increases in axons for the Golgi, lysosome, and endosome transgenic markers parallel the fold increases we observed for native organelle compartments in
inunc-16(ce483)cholinergic motor neurons was 118.46 8% of wild type; N= 12 animals expressing theceIs123
transgene).
To provide independent evidence that the accumulations represent Golgi, endosomes, and lysosomes, we tagged alternative organelle markers for each compartment using different color fluorescent proteins, separately integrated the resulting transgenes, and crossed them together. Imag-ing cholinergic motor neuron somas in these strains revealed that the CTNS-1-RFP marker colocalized with the alternative marker LMP-1-GFP (the C. elegans LAMP, or lysosomal membrane protein, ortholog;Figure S2A), and the two early endosome markers YFP-RAB-5and RFP-SYN-13
colocalize (Figure S2B). As an alternative Golgi marker, we usedPST-2-CFP.PST-2is theC. elegansortholog of a Golgi-resident PAPS (phosphosulfate) transporter that has been localized to Golgi stacks in C. elegans (Dejima et al.
2010). AMAN-2-Venus andPST-2-CFP generally colocal-ized, with some slight offset that could be due to the two proteins localizing to different regions of the Golgi ( Fig-ure S2C).
The high steady-state levels of organelles in unc-16 mu-tant axons result from loss of unc-16 in the same neurons because a transgene expressing the unc-16 cDNA in the same neurons completely rescued the hyperaccumulation of early endosomes (Figure S3A). Endosomes are known components of axons that are involved in synaptic vesicle recycling. Thus, it is not the presence of early endosomes in
unc-16mutant axons that is unusual; it is the high levels of
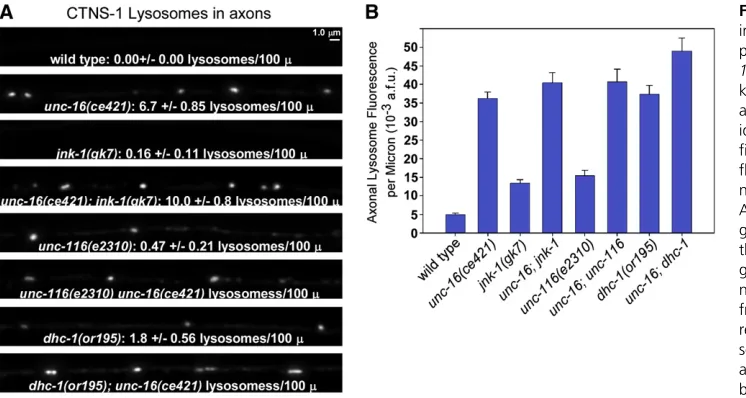
this organelle. However, the presence of Golgi and lysosome membranes in adult C. elegans cholinergic motor neuron axons is highly abnormal. The brightness and relatively sparse distribution of the CTNS-1 lysosome marker made it ideal for counting as well as tracking by time lapse video microscopy, so we focused on this marker for the remaining study. All threeunc-16null mutants accumulated the CTNS-1-RFP lysosomal marker in their axons at eightfold higher levels than wild-type axons as measured by quantifying total
CTNS-1-RFP fluorescence above background (Figure 3, A and B). Thresholding the data to count lysosomal puncta revealed only a diffuse, near-background level of the lyso-somal marker and no lysolyso-somal puncta in any of the 28 wild-type axons we analyzed. In contrast, unc-16 null mutants averaged a lysosomal punctum every 12 mm of axon length (Figure 3C).
unc-16 mutant cell somas are not depleted of the organelles that accumulate in axons
The unusually high levels of Golgi, endosomes, and lyso-somes in unc-16 mutant axons were not associated with a corresponding depletion in the cell somas. The levels of the three organelle markers that were most elevated in unc-16mutant axons (AMAN-2-Venus, RFP-SYN-13, and CTNS-1-RFP) were not statistically different from wild type with respect to their levels in cell somas, although all were slightly lower, and two of the threeunc-16nonsense mutants had slightly, but significantly lower numbers of lysosomal puncta in their cell somas (Figure 3, D–F) (S. L. Edwards Figure 1 unc-16 null mutants accu-mulate organelles in their axons. (A) Representative electron micrographs of synaptic profiles from the ventral nerve cord of wild type and theunc-16(ce483) null mutant as indicated. Arrows indi-cate representative organelles. PD, pre-synaptic density; SV, pre-synaptic vesicle; DCV, dense core vesicle. (B) Graph quantifying the number of organelles in the dorsal and ventral nerve cords of wild type and anunc-16null mutant. In this experiment we define“organelle”
and K. G. Miller, quantified data not shown for AMAN-2 -Venus and RFP-SYN-13).
Lysosomes in unc-16 null mutants are less likely to re-enter the soma after they move into the axon
The quantitative data from static images led us to hypoth-esize that UNC-16exerts an organelle gatekeeper function that inhibits organelle movements from the cell soma into the axon initial segment. The near normal organelle content in unc-16 mutant somas, as well as the near wild-type growth rate ofunc-16mutants, suggests that, despite heavy accumulations in axons over time, organelles move from
unc-16mutant somas to axons relatively infrequently, leav-ing time for them to be replaced as they leave the cell soma. To test these ideas, we constructed a transgenic array that coexpresses CTNS-1-RFP (to mark lysosomes) and soluble GFP (to mark cell somas and neuronal processes) in ventral cord cholinergic motor neurons. After integrating the array into the genome we crossed it into an unc-16null mutant and used two-color time lapse imaging to track lysosome
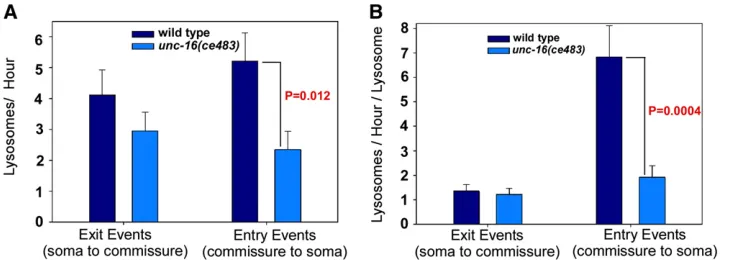
movements at the cell soma–axon boundary in living, un-anesthetized animals. In time lapse data from .100 cell somas each for wild type andunc-16mutants, we found that our initial gatekeeper hypothesis was wrong. Lysosomes in wild type andunc-16null mutants were just as likely to exit the cell soma, doing so, on average, at a rate of one per 15– 20 min (Figure 4A). However, the data also revealed that lysosomes in unc-16mutants are less likely to re-enter the soma once they have moved into the axon initial segment (Figure 4A). Since the rate of lysosome movements into and out of the soma is affected by the number of lysosomes in the starting location, we also normalized the data to reflect the event rate per lysosome in the starting location. This enhanced the difference between wild type and theunc-16
mutant with respect to cell soma entry rates and more closely equalized the exit rates (Figure 4B).
Files S1 andS2each are a stack of four two-color clips from wild type and unc-16mutants that are representative of the Figure 4 graph data. They show examples of lysosome movements into and out of the cell soma in each strain. The Figure 2 unc-16null mutants accumu-late high levels of Golgi and endosomal membranes in their axons. The drawing shows an adultC. elegansoriented with its dorsal cord up and a box around the targeted image region. The table sum-marizes the levels of various organelle markers inunc-16(ce421)mutant axons expressed as percentages of the levels in wild-type animals. All data are derived from the indicated genomically inte-grated transgenes and are the means and standard errors of the background-adjusted integratedfluorescence per mi-crometer of axon length from 12–14 animals each. Asterisks indicate levels of statistical significance as follows:
movies also show that, in some cases, the lysosomes transit-ing this boundary can be stretched into several micrometer long tubulovesicular structures as they enter the narrow axonal commissure. Thus, the lysosomal membranes moving out of cell somas include large organelle-size compartments.
UNC-16 exerts an organelle gatekeeper function at the axon initial segment
The above data suggest thatUNC-16is not acting at the cell soma–axon boundary as we initially hypothesized, but rather at some other location in the axon. Tofind the loca-tion of the gate region, we compared the distribuloca-tion of lysosomes throughout the entire axon, from the cell soma to the synaptic region in wild type and unc-16mutants. To
accumulate in the dorsally located synaptic region of the axon, lysosomes in D-type cholinergic motor neurons must
first pass through a long commissure that crosses the ani-mal’s body to connect the ventral soma with the dorsal syn-aptic region. Although the commissure is technically part of the axon, it has distinctly different properties from the syn-aptic region of the axon as indicated by its lack of synapses and unique active transport properties highlighted in forth-coming data in this article. We divided the commissures into six different regions, starting with the axon initial segment (nearest to the soma) andfinishing in the synaptic region on the other side of the animal. The data, obtained by counting lysosomes in the six regions of 320 commissures for each strain, revealed that lysosomes in wild type usually do not Figure 3 unc-16 mutants accumulate high levels of lysosomal membranes in their axons with minimal depletion from cell somas. (A and D) Representative images of the DA6/DB6 motor neuron axons and cell somas, respectively, from animals of the indicated genotypes carrying the genomically integrated trans-gene ceIs56, which expresses CTNS-1-RFP to mark lysosomes. Images were collected at identical light powers and scaled identically. In D, the approximate boundaries of the cell somas and den-drite processes, as determined from analysis of a set of more brightly scaled images, are outlined in red and green, respectively. Since DA6 and DB6 extend dendrites in opposite directions, the re-gion between the somas should contain the dendrites from both cells, but we were unable to resolve them. The spac-ing between the somas is variable. (B and E) Quantification of CTNS-1-RFP
fluorescence in the dorsal axons and ventral somas, respectively, of the indi-cated genotypes. Graphs show the background-adjusted integratedfl uores-cence per micrometer of dorsal axon length (B) or background-adjusted inte-grated cell soma and dendrite fl uores-cence normalized to area (E). Data are means and standard errors from 14 ani-mals each. The threeunc-16mutants in E are not significantly different from wild type. (C and F) The same data used for graphs B and E were used to count lyso-somes defined by a threshold level. Data are means and standard errors from images acquired from 14 animals each.
progress beyond the axon initial segment, whereas lyso-somes in unc-16 mutants often escape this region and ultimately accumulate at high levels in the synaptic re-gion (Figure 5, A and B). For example, segment 2 of wild type (the region just past the axon initial segment and possibly including part of the axon initial segment) had, on average,0.1 lysosomes per commissure, compared to 0.5 for the same region in theunc-16null mutant. Beyond region 2, wild type had essentially no lysosomes in any of the 320 commissures, whereas these distal regions often contained a lysosome in theunc-16mutant. The data thus suggest thatUNC-16exerts its gatekeeper function from the axon initial segment, not at the cell soma–axon boundary.
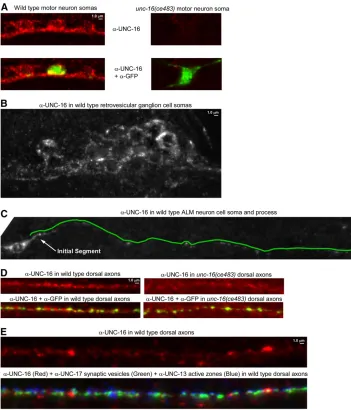
To determine whether native UNC-16 localizes to the axon initial segment we produced an affinity-purified anti-body to UNC-16 and used it to immunostain C. elegans
whole mounts. We saw UNC-16 signal broadly expressed throughout the nervous system (Figure 6, A and B shows
examples from the ventral nerve cord in the animal’s body and the retrovesicular ganglion in the head). The UNC-16
signal was largely absent from the cell somas and axons of anunc-16nonsense mutant (Figure 6, A and D). Due to the crowding of neuronal cell somas in the ventral cord and head ganglia, we were unable to determine whether UNC-16has a special preference for the axon initial segment in these neurons. However, when we imaged the well-isolated ALM neuron, we observed thatUNC-16was equally concen-trated in its cell soma and its initial segment (Figure 6C). TheUNC-16signal dropped off rapidly after the initial seg-ment, but was still sparsely distributed throughout the remaining process and was also sparsely distributed in the dorsal axons of motor neurons in a pattern that did not align with synaptic sites (Figure 6, C–E). The localization of native
UNC-16is thus consistent with a function in the axon initial segment; however, it is also present on sparsely distributed structures distal to the initial segment and thus may also function at other locations.
Figure 4 Lysosomes in unc-16 null mutants are less likely to re-enter the soma after they move into the axon ini-tial segment. (A) Graph comparing the number of lysosomes per hour exiting the cell soma to the axon commissure or entering the cell soma from the axon commissure in wild type andunc-16null mutants containing theceIs134integrated transgene, which expresses CTNS-1-RFP in cholinergic motor neurons. Data are from 114 (wild type) and 102 (unc-16 mu-tant) 5-min time lapse movies recorded from one to three cell somas per ani-mal. (B) Graph normalizes the data from A to the average number of lysosomes at the starting location, which is the cell soma for exit events or the axon initial segment for entry events. See alsoFiles S1andS2, which each show sequential time lapses movies of four tofive different somas from each genotype.
Lysosomes in unc-16 mutants exhibit bidirectional active transport in the commissure, but are much less active in the synaptic region
To determine how lysosomes reach the synaptic region in
unc-16 mutants, and why they accumulate there, we pro-duced time lapse movies of long regions of the commissure that allowed us to follow lysosome movements in living, un-anesthetized animals by rapidly collecting a 16-plane z-series at each time point in physically immobilized animals. We observed that lysosomes inunc-16null mutant axons moved vigorously and processively in both directions and sometimes stretched into long tubules as they moved through the narrow commissure (File S3). Anterograde and retrograde movements
were not significantly different with respect to the overall distance per movement, the average distance of all ments in each commissure, or the average number of move-ments per commissure per unit time (Figure 7, A–C).
The movements were processive. The average distance before a pause, change in direction, or loss of the lysosome from the field of view was 9 mm for both retrograde and anterograde movements (Figure 7A). The maximum distance we observed for an anterograde movement was 62 mm (essentially the length of the commissure as it crosses the body), and the maximum retrograde distance was 49mm.
The movements were vigorous and consistent with fast axonal transport velocities. The mean anterograde velocity Figure 6 Native UNC-16 immunolocali-zation inC. eleganswhole mounts. (A) Representative, identically scaled images of UNC-16 immunoreactivity (Red) in wild-type and unc-16(ce483) motor neuron cell somas in the ventral nerve cord. Note that the red signal is greatly diminished or absent in theunc-16 mu-tant, thus demonstrating that the red signal represents UNC-16. Each strain also contains the ceIs123 integrated transgene, which expresses soluble GFP in a subset of nine motor neurons. The top images show UNC-16 signal only. The bottom images show an overlay of the UNC-16 and GFP signals to demon-strate equal permeablization of wild-type and mutant animals. GFP protein (green) was detected using a Far Red secondary antibody to avoid native GFP
was 1.2160.15mm/sec (mean6SEM;N= 14), while the mean retrograde velocity was 1.2960.16mm/sec (mean6 SEM;N= 9). The maximum speeds we observed were 2.62 mm/sec (anterograde) and 2.28mm/sec (retrograde). Organelle active transport strongly decreases after deposition in the main axon
Since the bidirectional organelle movements in commissures appear balanced in each direction, we sought to determine why organelles accumulate in the synaptic region ofunc-16
mutant axons. One possibility is that the bidirectional move-ments occasionally bring the organelle all the way to the synaptic region of the axons, and that organelle mobility decreases upon reaching this region. To test this, we quan-tified the number of lysosomal puncta moving in unc-16
mutant commissures vs. the synaptic region. Indeed, we found that lysosomal puncta in the synaptic region of unc-16 mutant axons were much less active than those in the commissural regions. File S4shows simultaneous views of multiple lysosomes actively moving in the commissural re-gion and not moving in the dorsal rere-gions. However, as shown in the two clips in File S5, the bidirectional move-ments of lysosomes can persist for at least a few minutes even after reaching the synaptic region, and they can even move back into the commissure. The birectional movements into and out of the synaptic region are likely to be short-lived, however, because a quantitative analysis revealed that, on average, CTNS-1-GFP lysosomal puncta were nine times more likely to be moving when in the commissural region of the axon than when in the dorsal (synaptic) region (Figure 7D). Thus, if the vigorous bidirectional shuttling in the commissures successfully deposits a lysosome in the syn-aptic region, the lysosome would be less likely to return to the cell soma if it does not re-enter the commissure before
its mobility decreases. This would cause lysosomes to accu-mulate in axons (at higher levels than commissures) without depleting them from the cell soma. These data are also sig-nificant because they suggest that the commissural regions of axons have specialized active transport properties com-pared to the synaptic regions.
Impairing UNC-116 (Kinesin) or dynein does not prevent axonal lysosome accumulation
Prior studies reported that the dynein intermediate light chain (a component of the dynein motor complex), the kinesin light chain (a cargo-binding subunit of the KIF5 kinesin motor), and KIF5 (kinesin heavy chain) directly bind to UNC-16and/or its JIP3 orthologs (Bowmanet al.2000; Verheyet al. 2001; Kelkaret al.2005; Nguyenet al.2005; Sakamotoet al.2005; Montagnacet al.2009; Arimotoet al.
2011; Sun et al.2011). Since these interactions involve ac-tive transport motors, we used mutations in these motors, along with theCTNS-1lysosome marker to test the hypoth-esis that one or both motors carries organelles to axons in the absence ofUNC-16. EliminatingDHC-1orUNC-116inC. elegansresults in sterility or early embryonic lethality (Ham-ill et al. 2002; Koushika et al. 2004; Yang et al. 2005). Therefore, to produce adult animals with strongly impaired
DHC-1(dynein heavy chain) function, we grew strains with the temperature-sensitive alleledhc-1(or195)(Hamillet al.
2002; Koushika et al. 2004) at the restrictive temperature from hatching to adulthood, yielding 100% sterile adults. To impair UNC-116 (KIF5C) function in adults, we used the homozygous viable reduction-of-function mutationunc-116
(e2310)(Patelet al.1993).
In mutants with strongly impaired DHC-1function, axo-nal levels of CTNS-1-RFP (lysosomes) were 7.5-fold higher than wild type (Figure 8, A and B). Growing the dhc-1
mutants at the permissive temperature of 14 decreased
CTNS-1-RFP levels in axons to 1.760.19-fold higher than wild type, consistent with a small degree of impairment even at the permissive temperature (Figure S3B). To
con-firm that thedhc-1mutant phenotype is caused by disrup-tion of dynein funcdisrup-tion in motor neurons, we impaired dynein function by overexpressing DNC-2 (dynamitin) in the same neurons and observed a greater thanfivefold in-crease in the axonal levels ofCTNS-1-RFP lysosomes com-pared to wild type (Figure S3B). Overexpressing dynamitin dissociates the dynactin complex and causes phenotypes identical to dynein loss-of-function mutations (Burkhardt
et al. 1997; Koushika et al. 2004). From these results we conclude that dynein is also required to inhibit the lyso-somal marker from accumulating in axons.
To test for a possible role for kinesin (KIF5) in the axonal accumulation of lysosomes, we crossedCTNS-1-RFP into the
unc-116(e2310) mutant and observed a 3.1-fold increase relative to wild type (Figure 8, A and B). This phenotype results from a loss of UNC-116 (KIF5) function in motor neurons because transgenic, cell-specific unc-116 RNAi in the same neurons also caused a low, but significant axonal accumulation of the lysosomal marker (Figure S3C). Con-versely, expressing the wild type unc-116cDNA inunc-116
mutant motor neurons rescued, rather than enhanced, the lysosome accumulation phenotype (Figure S3C). The data thus show that conventional kinesin (KIF5) also inhibits the accumulation of the lysosome marker in axons.
An analysis ofunc-16;dhc-1andunc-16;unc-116double mutants suggested that neither the dynein nor the kinesin motors are responsible for the axonal organelle accumula-tion that occurs in the absence ofunc-16, since both double mutants accumulated lysosomes at levels slightly higher thanunc-16single mutants (Figure 8, A and B). This result
could also suggest that the dhc-1 and unc-116 mutations disrupt the same organelle gatekeeper as the unc-16 null mutations, since the double mutants (unc-16; dhc-1 and
unc-16;unc-116) did not strongly worsen the organelle ac-cumulation phenotype of unc-16 mutants. However, this analysis quantified overall levels of the organelle markers in axons (total marker fluorescence above background). We also counted lysosomal puncta in the dorsal axons of the same strains. The punctal analysis revealed that unc-16andunc-116 mutations do not have identical effects on lysosomal accumulation in axons. Most of the CTNS-1-RFP signal inunc-116mutant axons was diffusely distributed or was associated with vesicles too small to be individually re-solved by light microscopy. The number of lysosomal puncta in unc-116 mutants, though significantly higher than wild type, was only 7% of the number inunc-16mutants (Figure 8A). Similarly, although thedhc-1mutant accumulated the lysosomal marker in its axons at a high level that was not significantly different from unc-16 mutants, the number of lysosomal puncta in dhc-1 mutant axons was only 27% of the number inunc-16mutants (Figure 8A). Thus, the lyso-somal marker inunc-16mutant axons appears more likely to be associated with sparsely distributed organelle size com-partments, whereas the lysosomal marker in the unc-116
anddhc-1mutants appears more likely to be associated with uniformly distributed membranes in the axon.
UNC-16 and the JNK-1 MAPK act in the same pathway to prevent axonal lysosome accumulation
Prior studies have shown thatUNC-16and its JIP3 orthologs directly interact with multiple MAP kinase signaling pro-teins, includingC. elegansJNK-1 (a JNK-type MAP kinase) (Itoet al.1999; Kelkaret al.2000; Byrdet al.2001). To test whether MAP kinase signaling contributes to UNC-16’s Figure 8 UNC-16 and the JNK-1 signal-ing kinase act in the same pathway to prevent lysosome accumulation in unc-16 mutant axons, but impairing KIF5 kinesin or dynein does not prevent the accumulation. (A and B) Representative, identically scaled images (A) and
quanti-fication (B) of CTNS-1-RFP lysosome
fluorescence in defined dorsal and axo-nal regions of the indicated genotypes. All strains carry the genomically inte-grated transgene ceIs56. Graph shows the mean background-adjusted inte-grated fluorescence per micrometer of nerve cord length from images acquired from 11–12 animals each. Error bars represent standard errors. Intensity and scaling values for theunc-116; unc-16 anddhc-1;unc-16double mutants have been reduced by 1.79- and 1.60-fold, respectively, to normalize for increased expression of the transgene in these two double mutants as determined by quantitatively imagingceIs56fluorescence in cell somas in each strain. The cell somafluorescence ofceIs56in all other strains is not significantly different from wild type. The means of all eight mutant strains are significantly different from wild type (P,0.0001 using the unpairedt-test with Welch correction). The text data in A state the mean number of lysosomes/100mm
organelle gatekeeper function, we compared the axonal steady-state levels of CTNS-1-RFP lysosomes in wild type and jnk-1 null mutants. The axonal level of lysosomes in
jnk-1 null mutants was 2.5-fold higher than wild type vs.
8.1-fold higher for unc-16null mutants.unc-16;jnk-1 dou-ble mutants did not significantly differ fromunc-16 single mutants in axonal lysosome accumulation, consistent with
UNC-16 and JNK-1 acting as part of the same process to inhibit the axonal accumulation of lysosomes (Figure 8). The less severe effect of thejnk-1null mutation compared to theunc-16null could indicate thatJNK-1has a nonessen-tial modulatory role in regulating the organelle gatekeeper. Alternatively,JNK-1may act in parallel with one or more of thefive otherC. elegansMAP kinases in the JNK and/or p38 MAP kinase subgroups (Sakaguchiet al.2004).
Discussion
Organelle gatekeeper model for UNC-16 (JIP3) function
A prior study proposed that the massive accumulation of organelles inDrosophilaSYD (JIP3) mutants is a failure of axonal transport (Bowmanet al.2000) and that the function of JIP3 is to promote organelle transport into axons. Since that study used SYD homozygotes derived from heterozy-gous mothers, the explanation for why a failure of axonal transport would lead to a buildup rather than a loss of organelles in axons was that a gradual loss of maternally contributed SYD leaves organelles stalled and stranded in axons. We also observed a massive accumulation of organ-elles in C. elegansunc-16(JIP3) mutant axons. Using dual, independent organelle markers, we found that the most strongly affected organelles originate from Golgi and endo-somal membranes, including lysosomes. However, the C. elegansmutants are homozygous viable and thus have never been exposed to wild-typeUNC-16. Time lapse observations of lysosome movements in living, unanesthetized animals and an analysis of lysosome distributions support a model in which UNC-16functions as an organelle gatekeeper to inhibit the escape of organelles from the axon initial seg-ment (Figure 9). Additional time lapse data showed that organelles escaping the initial segment in unc-16 mutants undergo processive, bidirectional, fast axonal transport in commissures. Thus, instead of promoting organelle move-ments into axons as previously proposed (Bowman et al.
2000), this new data suggest that UNC-16 (JIP3) and its orthologs normally function to inhibit the escape of organ-elles from the axon initial segment. Our data suggest that organelles accumulate inunc-16 mutant axons because bi-directional transport of organelles that have escaped the axon initial segment occasionally deposits them in the syn-aptic region, where their mobility decreases, causing them to accumulate at higher levels than in commissures.
Prior studies have shown that the axon initial segment has a barrier/filtering function that affects the movement of molecules along the plasma membrane (Winckler et al.
1999) as well as the movement of small transport vesicles carrying specific proteins (Songet al.2009). However, a role for the axon initial segment in restricting theflow of organ-elles into axons has not been reported. Our study is thefirst to demonstrate that a gatekeeper function restricts theflow of Golgi and endosomal organelles, including lysosomes, through the axon initial segment.
Our data do not rule out the possibility thatUNC-16may have one or more other functions or sites of action in addi-tion to its role at the axon initial segment. Indeed, our immunolocalization of nativeUNC-16showed that it is pres-ent in the synaptic region of axons. Since our time lapse data suggest thatUNC-16promotes the return of organelles from the axon initial segment to the cell soma, we hypothesize that UNC-16in the synaptic region may also promote the return of selected organelles to the soma. Consistent with
UNC-16targeting selected organelles in the synaptic region, our data showed that UNC-16 was heavily concentrated around large, sparsely distributed puncta in the synaptic region.
A prior study also reported a massive accumulation of the early endosome marker YFP-RAB-5and unidentified mem-branous cisternae in unc-16 mutant axons (Brown et al.
2009). However, that study suggested thatUNC-16has a spe-cific role in regulating the dynamics of a RAB-5-associated organelle compartment and, even more specifically, the activ-ity state of theRAB-5on that compartment. The authors pro-posed a connection between thisRAB-5-specific function and the reduced number of synaptic vesicles at unc-16mutant synapses (Brownet al.2009). Our study revealed thatUNC-16
has a much more general role as a gatekeeper that acts in the axon initial segment to restrict theflow of Golgi and endo-somal organelles, including both early endosomes and lyso-somes, into the synaptic region. While it is possible that
UNC-16 has both the general organelle function that we discovered as well as an additionalRAB-5-specific function that affects synaptic vesicle recycling, we believe that the more general UNC-16gatekeeper model can also account for the reduced synaptic vesicle numbers atunc-16mutant synapses, as discussed below.
What molecular motors contribute to the gatekeeper and the bidirectional movements in commissures?
RNAi (also likely to cause a mild reduction-of-function phe-notype, since RNAi does not work efficiently in neurons) caused a low level of organelle accumulation in the synaptic region of axons, and that neither the kinesin nor the dynein mutations strongly worsened the axonal organelle accumu-lation inunc-16null mutants. At face value, this could sug-gest that kinesin and dynein function withUNC-16as part of the same organelle gatekeeper, although, as pointed out in the results, there appear to be differences in the organelle accumulation phenotypes caused by the motor protein mutations compared to the unc-16 null. These differences may or may not indicate that the motor protein mutations cause organelle accumulation by a different mechanism. The
finding that a kinesin reduction-of-function mutation causes organelle marker accumulation in axons is unexpected be-cause kinesin is an anterograde motor, and thus reducing its function should decrease the anterograde movements of organelles (movements directed away from the cell soma). However, this result is consistent with previous Drosophila
studies, which reported massive accumulations of organelles in the axons of fly mutants lacking either Kinesin Heavy Chain or Kinesin Light Chain, as well as other phenotypes, such as larval tailflipping, that are similar to Sunday Driver mutants (Hurd and Saxton 1996; Gindhartet al.1998; Bowman
et al.2000).
Why do neurons need an organelle gatekeeper?
There are at least three trafficking-related needs which, either singly or in combination, might have driven neurons to evolve an organelle gatekeeper function at the axon initial segment: (1) preserving the integrity and efficiency of synaptic vesicle biogenesis; (2) preventing organelle traffic jams or clogs in axons; and (3) regulating axon growth or repair.
First, neurons may use the gatekeeper to preserve the integrity of synaptic vesicles during their biogenesis or to maintain the efficiency of synaptic biogenesis. During synaptic
vesicle biogenesis, synaptic proteins must traverse the Golgi and a portion of the early endosomal system as they come together with other synaptic vesicle proteins to form synaptic vesicle precursors in the cell soma (Bonanomiet al.2006). In the absence of a gatekeeper, synaptic vesicle proteins might prematurely move from the cell soma into the synaptic region of axons as the cargo of Golgi or endosomal membranes, resulting in decreased synaptic vesicle production. Consistent with this prediction, a previous study found thatunc-16 muta-tions allow a fraction of the synaptic vesicle proteinsSNB-1 -GFP andSNT-1to move to axons by a method of transport that does not require the UNC-104 synaptic vesicle motor (Byrdet al.2001). SinceUNC-104appears to specifically rec-ognize mature synaptic vesicle precursors for transport (Hall and Hedgecock 1991; Okada et al. 1995; Pack-Chung et al.
2007), theUNC-104-independent transport of synaptic vesicle proteins in unc-16 mutants indicates that those proteins are not components of mature synaptic vesicle precursors. Further supporting the idea that unc-16 mutations impact synaptic vesicle biogenesis, synaptic vesicles numbers at motor neuron synapses are reduced inunc-16mutants (Brownet al.2009). Second, neurons may require a gatekeeper function to prevent axonal clogging. Our time lapse experiments show that large organelles dramatically reshape themselves from spherical to elongated compartments as they move through the narrow commissures. The extent to which these large organelles may contribute to temporary or permanent organelle traffic jams in axons is unknown. However, fly mutants with phenotypes that are similar to SYD (JIP3) mutants are described as having organelle“clogs”or“jams” in their axons (Hurd and Saxton 1996; Gindhart et al.