A Study of Composite column in High-Rise
Building under Seismic Excitations Using
ETABS
P.Yashoda 1, S.Sudheer 2
P.G. Student, Department of Civil Engineering, Dr.K.V.Subba Reddy Institute of Technology, Kurnool, AP, India1 Assistant Professor, Department of Civil Engineering, Dr.K.V.Subba Reddy Institute of Technology, Kurnool,
AP, India2
ABSTRACT: The present work seeks to research the seismic behavior of different heights of multi storey structure in 30,60 meters height structure with composite columns and examine the key style problems involved. The current study deals with unstable behavior different heights of multi storied framed structure assessed through equivalent static technique of study as per IS: 1893-2002 for zone II & zone V in loose soil (soil-III) by using ETABS software.The analyses performed on a collection of two forms of standard moment resisting framed 3D area models with totally composite columns. The analysis is provided and therefore the results compared in terms of important earthquake response parameters like displacement of the structure.
KEYWORDS:Composite columns, ETABS, Highrise building.
I. INTRODUCTION
Composite columns are constructed using various combinations of structural steel and concrete in an attempt to utilize the beneficial properties of each material. The interactive and integral behavior of concrete and the structural steel elements makes the composite column a very stiff, more ductile, cost effective and consequently a structurally efficient member in building and bridge constructions.
II. NUMERICLMODELLING
Storey height = 3 m Ground Storey height = 3.3 m
III.EXPERIMENTAL RESULTS
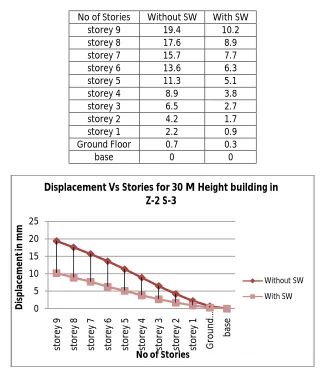
Table : 1 Comparative values of displacement in zone-2 soil-3 for 30 m height building without Shear wall and with shear wall
No of Stories Without SW With SW
storey 9 19.4 10.2
storey 8 17.6 8.9
storey 7 15.7 7.7
storey 6 13.6 6.3
storey 5 11.3 5.1
storey 4 8.9 3.8
storey 3 6.5 2.7
storey 2 4.2 1.7
storey 1 2.2 0.9
Ground Floor 0.7 0.3
base 0 0
Graph 1 Displacement curve for 30 m height building in zone-2 soil-3
0 5 10 15 20 25 st o re y 9 st o re y 8 st o re y 7 st o re y 6 st o re y 5 st o re y 4 st o re y 3 st o re y 2 st o re y 1 G ro u n d … b as e D is p la ce m e n t in m m
No of Stories
Displacement Vs Stories for 30 M Height building in Z-2 S-3
Without SW
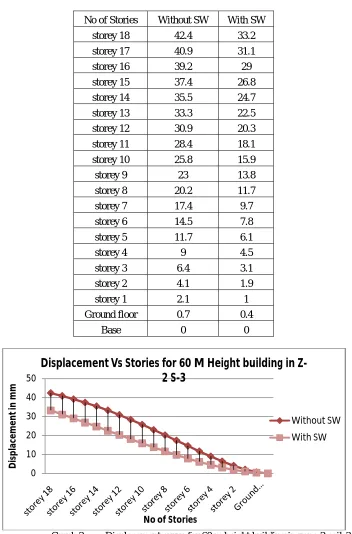
Table : 2 Comparative values of displacement in zone-2 soil-3 for 60 m height building without Shear wall and with shear wall
No of Stories Without SW With SW
storey 18 42.4 33.2
storey 17 40.9 31.1
storey 16 39.2 29
storey 15 37.4 26.8
storey 14 35.5 24.7
storey 13 33.3 22.5
storey 12 30.9 20.3
storey 11 28.4 18.1
storey 10 25.8 15.9
storey 9 23 13.8
storey 8 20.2 11.7
storey 7 17.4 9.7
storey 6 14.5 7.8
storey 5 11.7 6.1
storey 4 9 4.5
storey 3 6.4 3.1
storey 2 4.1 1.9
storey 1 2.1 1
Ground floor 0.7 0.4
Base 0 0
Graph 2 Displacement curve for 60 m height building in zone-2 soil-3
0 10 20 30 40 50
D
is
p
la
ce
m
e
n
t
in
m
m
No of Stories
Displacement Vs Stories for 60 M Height building in
Z-2 S-3
Without SW
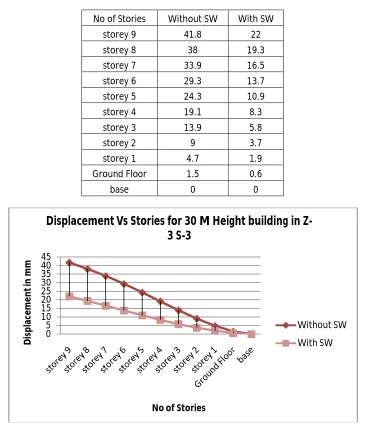
Table : 3 Comparative values of displacement in zone-5 soil-3 for 30 m height building without Shear wall and with shear wall
No of Stories Without SW With SW
storey 9 41.8 22
storey 8 38 19.3
storey 7 33.9 16.5
storey 6 29.3 13.7
storey 5 24.3 10.9
storey 4 19.1 8.3
storey 3 13.9 5.8
storey 2 9 3.7
storey 1 4.7 1.9
Ground Floor 1.5 0.6
base 0 0
Graph 3 Displacement curve for 30 m height building in zone-5 soil-3
0 5 10 15 20 25 30 35 40 45
D
is
p
la
ce
m
e
n
t
in
m
m
No of Stories
Displacement Vs Stories for 30 M Height building in
Z-3 S-Z-3
Without SW
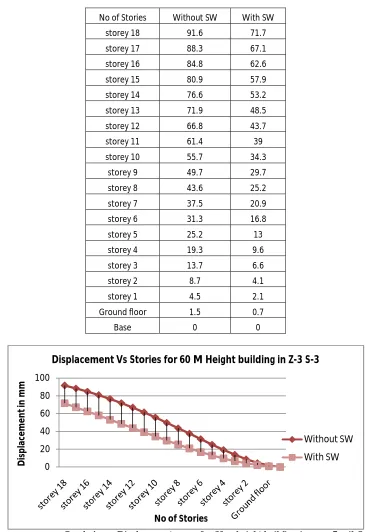
Table : 4 Comparative values of displacement in zone-5 soil-3 for 60 m height building without Shear wall and with shear wall
No of Stories Without SW With SW
storey 18 91.6 71.7
storey 17 88.3 67.1
storey 16 84.8 62.6
storey 15 80.9 57.9
storey 14 76.6 53.2
storey 13 71.9 48.5
storey 12 66.8 43.7
storey 11 61.4 39
storey 10 55.7 34.3
storey 9 49.7 29.7
storey 8 43.6 25.2
storey 7 37.5 20.9
storey 6 31.3 16.8
storey 5 25.2 13
storey 4 19.3 9.6
storey 3 13.7 6.6
storey 2 8.7 4.1
storey 1 4.5 2.1
Ground floor 1.5 0.7
Base 0 0
Graph 4 Displacement curve for 60 m height building in zone-5 soil-3
0 20 40 60 80 100
D
is
p
la
ce
m
en
t
in
m
m
No of Stories
Displacement Vs Stories for 60 M Height building in Z-3 S-3
Without SW
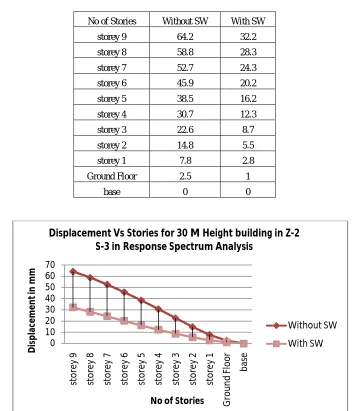
Table : 5 Comparative values of displacement in zone-2 soil-3 for 30 m height building without Shear wall and with shear wall in dynamic analysis
No of Stories Without SW With SW
storey 9 64.2 32.2
storey 8 58.8 28.3
storey 7 52.7 24.3
storey 6 45.9 20.2
storey 5 38.5 16.2
storey 4 30.7 12.3
storey 3 22.6 8.7
storey 2 14.8 5.5
storey 1 7.8 2.8
Ground Floor 2.5 1
base 0 0
Graph 5 Displacement curve for 30 m height building in zone-2 soil-3 response spectrum analysis.
0 10 20 30 40 50 60 70 st o re y 9 st o re y 8 st o re y 7 st o re y 6 st o re y 5 st o re y 4 st o re y 3 st o re y 2 st o re y 1 G ro u n d F lo o r b as e D is p la ce m e n t in m m
No of Stories
Displacement Vs Stories for 30 M Height building in Z-2 S-3 in Response Spectrum Analysis
Without SW
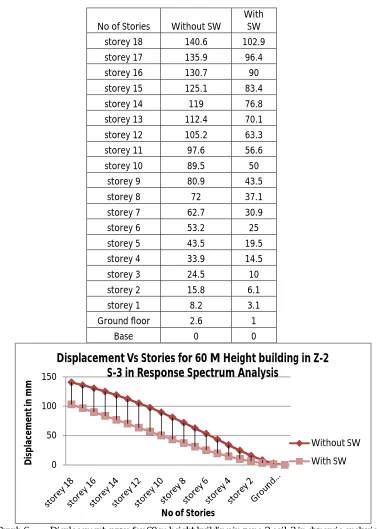
Table : 6 Comparative values of displacement in zone-2 soil-3 for 60 m height building without Shear wall and with shear wall in dynamic analysis
No of Stories Without SW
With SW
storey 18 140.6 102.9
storey 17 135.9 96.4
storey 16 130.7 90
storey 15 125.1 83.4
storey 14 119 76.8
storey 13 112.4 70.1
storey 12 105.2 63.3
storey 11 97.6 56.6
storey 10 89.5 50
storey 9 80.9 43.5
storey 8 72 37.1
storey 7 62.7 30.9
storey 6 53.2 25
storey 5 43.5 19.5
storey 4 33.9 14.5
storey 3 24.5 10
storey 2 15.8 6.1
storey 1 8.2 3.1
Ground floor 2.6 1
Base 0 0
Graph 6 Displacement curve for 60 m height building in zone-2 soil-3 in dynamic analysis
0 50 100 150
D
is
p
la
ce
m
e
n
t i
n
m
m
No of Stories
Displacement Vs Stories for 60 M Height building in Z-2
S-3 in Response Spectrum Analysis
Without SW
Table : 7 Comparative values of displacement in zone-5 soil-3 for 30 m height building without Shear wall and with shear wall in dynamic analysis
No of Stories Without SW With SW
storey 9 231.1 115.9
storey 8 211.6 101.8
storey 7 189.7 87.3
storey 6 165.4 72.7
storey 5 138.8 58.2
storey 4 110.4 44.2
storey 3 81.4 31.2
storey 2 53.3 19.7
storey 1 28.2 10.2
Ground Floor 9.2 3.5
base 0 0
Graph 7 Displacement curve for 30 m height building in zone-5 soil-3 in dynamic analysis.
0 50 100 150 200 250
D
is
p
la
ce
m
en
t
in
m
m
No of Stories
Displacement Vs Stories for 30 M Height building in Z-5 S-3 in Response Spectrum Analysis
Without SW
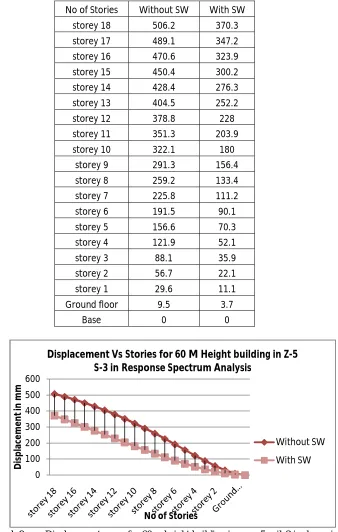
Table : 8 Comparative values of displacement in zone-5 soil-3 for 60 m height building without Shear wall and with shear wall in dynamic analysis.
No of Stories Without SW With SW
storey 18 506.2 370.3
storey 17 489.1 347.2
storey 16 470.6 323.9
storey 15 450.4 300.2
storey 14 428.4 276.3
storey 13 404.5 252.2
storey 12 378.8 228
storey 11 351.3 203.9
storey 10 322.1 180
storey 9 291.3 156.4
storey 8 259.2 133.4
storey 7 225.8 111.2
storey 6 191.5 90.1
storey 5 156.6 70.3
storey 4 121.9 52.1
storey 3 88.1 35.9
storey 2 56.7 22.1
storey 1 29.6 11.1
Ground floor 9.5 3.7
Base 0 0
Graph 8 Displacement curve for 60 m height building in zone-5 soil-3 in dynamic analysis
0 100 200 300 400 500 600
D
is
p
la
ce
m
e
n
t
in
m
m
No of Stories
Displacement Vs Stories for 60 M Height building in Z-5 S-3 in Response Spectrum Analysis
Without SW
IV. CONCLUSION
1. Analysis carried out on two different heights of buildings i.e.. 30m, 60m in both static analysis and dynamic
analysis with composite column and shear wall at optimum locations.
2. From the analysis Displacement is compared for all the models in zone 2 & zone 5 and it can be concluded
that displacement is increasing with increase in height and the displacement can be reduced by providing shear
walls at optimum locations.
REFERENCES
1. IS: 456-code of practice for plain and reinforced concrete
2. IS: 875(part 1-5) - code of practice for structural safety of Building loading standards
3. IS 1893(Part-1):2002, Criteria for earthquake resistant design of structures.
4. IS 13920:1993, Ductile detailing of reinforced concrete structure subjected to seismic forces-code of practice.
5. SP: 16-design aids for reinforced concrete
6. Earthquake resistant design by pankaj agarwal.
7. Rosinblueth and Holtz “Analysis of shear walls in tall buildings” (1960)
8. Clough.R, King I.P and Wilson E.I-“Structural analysis of multi storied buildings” (1964).
9. Khan, F.R. and Sbrounis, J.A, (7) „Introduction of shear wall with frames in concrete Sabrcounis structure under lateral loads (1964).
10. Agarwal P. and M Shrikhande (2007), “Earthquake Resistant Design of Structures”, Prentice Hall of India Pvt. Ltd., 2007, New Delhi.
11. Stefano, M.D., and Pintucchi, B., june 2-5,2002, “A Model For Analyzing Inelastic Seismic Response Of Plan-Irregular Buiding Structures”,
15th ASCE engineering mechanics conference, Columbia University, New York, NY
12. Aoyama, H.,2001, Design of Modern High Rise Reinforced Concrete Structures,